ISSN Online: 2160-0406 ISSN Print: 2160-0392
DOI: 10.4236/aces.2019.91004 Jan. 8, 2019 44 Advances in Chemical Engineering and Science
Temperature Dependence of Density, Viscosity,
Thermal Conductivity and Heat Capacity of
Vegetable Oils for Their Use as Biofuel in
Internal Combustion Engines
Augustin Sampawindé Zongo
1*, Gilles Vaïtilingom
2, Tizane Daho
1, Christian Caillol
3,
Jean-François Hoffmann
4, Bruno Piriou
2, Jeremy Valette
2, Bila Gérard Segda
1, Pascal Higelin
31LPCE, Département de physique, Université Ouaga 1 Pr JKZ, Burkina Faso
2Unité de recherche BioWooEB, CIRAD Montpellier, Bat 16, 73 rue JF Breton, Montpellier, France
3Laboratoire PRISME, Université d’Orléans, 8 rue Léonard de Vinci, 45072 Orléans Cedex 2, France
4Laboratoire PROMES-CNRS UPR-8521 Université de Perpignan Via Domitia, Rambla de laThermodynamique, Tecnosud,
Perpignan, France
Abstract
This work gives tools to overcome the difficulty to determine experimentally physical properties for vegetable oils within the range of temperature typically observed during the injection phase in a diesel engine. Knowing vegetable oils’ physical properties to these ranges of temperature is of fundamental im-portance when modeling their combustion in diesel engine. However, vegetable oils’ experimental physical properties data are rare in the literature for temper-ature above 523 K. This paper describes experimental measurements and esti-mation methods for density, dynamic viscosity, thermal conductivity and heat capacity of vegetable oils for this particular range of temperature. The methodology uses several correlative methods using group contribution ap-proach for each property and compares experimental data with predicted one to select the more accurate model. This work has shown the rapeseed and ja-tropha oils’ physical properties can be satisfactorily predicted as a function of temperature using group contribution approach.
Keywords
Rapeseed Oil, Jatropha Oil, Physical Properties, Group Contribution Method, Energy, Diesel Engine
1. Introduction
In the last three decades, several studies have shown the potential of pure
vege-How to cite this paper: Zongo, A.S., Vaïti-lingom, G., Daho, T., Caillol, C., Hoffmann, J.-F., Piriou, B., Valette, J., Segda, B.G. and Higelin, P. (2019) Temperature Dependence of Density, Viscosity, Thermal Conductivity and Heat Capacity of Vegetable Oils for Their Use as Biofuel in Internal Combustion Engines. Advances in Chemical Engineering and Science, 9, 44-64.
https://doi.org/10.4236/aces.2019.91004
Received: December 8, 2018 Accepted: January 5, 2019 Published: January 8, 2019 Copyright © 2019 by author(s) and Scientific Research Publishing Inc. This work is licensed under the Creative Commons Attribution International License (CC BY 4.0).
http://creativecommons.org/licenses/by/4.0/
DOI: 10.4236/aces.2019.91004 45 Advances in Chemical Engineering and Science
table oils as fuel in diesel engines and burners [1] [2] [3] [4] [5]. Their applica-tions are numerous for developing countries: agriculture, irrigation, power and heat generation as well as drinking water supply. However, there are still prob-lems related to their chemical and physical properties such as fatty acid compo-sition, viscosity and volatility [6] [7] [8] [9] [10]. Their use may lead to the for-mation of carbon deposits under certain temperature conditions. These deposits can lead rapidly to engine mechanical failure. Studies have been conducted to determine the causes and possible solutions to the problems encountered in us-ing vegetable oils as fuel in diesel engines [6] [11].
Many studies, mostly experimental, have described the mechanisms of evapo-ration and combustion of vegetable oils under different conditions of tempera-ture and pressure [12] [13] and have determined their characteristics of evapora-tion. Attempts of models to calculate these characteristics are facing difficulties to correctly describe the transient phase. This phase of heating and dilatation takes place before the vaporization of vegetable oils droplets when they are in-troduced in diesel engines combustion chamber which minimum working tem-perature is above 450 K. Taking account of this transient phase requires the knowledge of the physical properties such as density, viscosity, thermal conduc-tivity and specific heat capacity, which data are rare in literature for temperature above 450 K. Density, thermal conductivity, dynamic viscosity and heat capacity are useful for selecting fuels for internal combustion engines and have normative values in quality standards for commercial fuels used in compression ignition engines. Recent researches on the determination of the physical properties of al-ternative fuels have focused on biodiesel [14] [15] [16] [17] [18] or blends be-tween diesel and other substances or mixtures [19] [20] [21] [22] [23]. Only a few studies have been interested in pure vegetable oils [24] [25] [26]. Indeed, determining vegetable oils physical properties is difficult because their composi-tion varies from one oil to another. Furthermore, experimental measurements of these properties are difficult or impossible to perform over a certain level of temperature because of their decomposition [27]. Methods such Static Method and a Flow Method [28], Low Residence Time Flow Method [29] and the Pulse-Heating Method [30] are much more used to determine critical properties of pure compounds or unstable substances and mixtures.
DOI: 10.4236/aces.2019.91004 46 Advances in Chemical Engineering and Science
above mentioned are evaluated as a function of temperature and the models which give very good agreement with literature or experimental data obtained in this work will be retained. The contribution of this work is to provide rapeseed and Jatropha experimental physical properties and predictive one by group tribution methodology that can be applied to others vegetable oils. Group con-tribution method has been used in recently works to estimate vegetable oils den-sity [25] and viscosity [31], lower heating value [32], cetane number of biodiesel fuel [33], and fatty acid compounds viscosities [15], but few of them has deter-mined properties above 450 K. Jatropha curcas and rapeseed oils were chosen because they are respectively representative of southern and northern hemis-phere first generation biofuels and also because of the availability of their physi-cal properties data in the literature.
The critical properties such as critical temperature, critical pressure or critical volume are very important because they are involved in determining the physical properties mentioned above. Then, the critical properties and normal boiling point will be firstly determined by correlative method.
2. Materials and Methods
Experimental tests were carried out at CIRAD Biomass Energy Laboratory (UR BioWooEB) in Montpellier (France), with the collaboration of the ‘‘Laboratoire de Physique et de Chimie de l’Environnement’’ (Burkina Faso), and the PROMES-CNRS laboratory of Perpignan (France).
2.1. Vegetable Oils
Jatropha curcas oil was obtained from agricultural producers in Burkina Faso. Rapeseed oil is commercially available and was purchased in a refined standard state from a food reseller in France.
[image:3.595.209.540.650.726.2]The physical and chemical characteristics in standard conditions of jatropha curcas and rapeseed oils used in this study were determined at BioWooEB. They are listed in Table 1. The density values were obtained using a pycnometer fol-lowing the NF EN ISO 12185 procedure. The dynamic viscosities were measured according to the NF EN ISO 3104. The flashpoints were obtained with a Pensky-Martens apparatus and using the NF EN ISO 2719 normative. We ob-tained the surface tension values by using the NF ISO 6295. Whereas lower heating values were measured in an Anton Paar Calorimeter type 6200 according to the NF EN 14918 method for solid biofuels, adapted and applied to liquids. The
Table 1. Physical characteristics of rapeseed oil and jatropha curcas oil.
Density (kg/m3 at
288 K)
Kinematic viscosity (mm2/s at 313 K)
Flash
point (K) tension (N/m) Surface value (MJ/kg) Low heating residue (%) Carbon Rapeseed oil 925 34.9 483 32.9 37.1 0.39
DOI: 10.4236/aces.2019.91004 47 Advances in Chemical Engineering and Science
carbon residue was measured by performing the NF EN ISO 10370 operation in a furnace of 773 K. Some of these physical properties were determined at the IESPM on the request of the unit BioWooEB.
The fatty acid composition was determined by gas chromatography, using a Agilent 6890 GC type with a FID detector and a CP-WAX 58CB column (25 m × 0.32 mm × 0.2 µm). The fatty acid composition of the oils is reported in Table 2.
2.2. Methods
2.2.1. Experimental
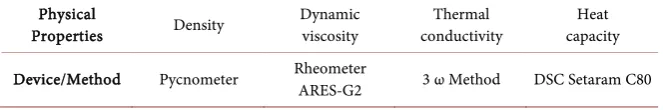
[image:4.595.210.539.515.623.2]In this section the experimental methods used to characterize the considered oils in the 298 - 523 K temperature range are described.The different methods or devices used in this work for the determination of density, dynamic viscosity, thermal conductivity and heat capacity of rapeseed and jatropha oils are listed in
Table 3. These physical properties were carried out at the PROMES-CNRS la-boratory in Perpignan.
The details of method 3 ω can be obtained in the following literature [34].
2.2.2. Correlative Methods
A model that could predict pure vegetable oils physical properties based on the knowledge of their fatty acid composition would be useful in their direct use as fuel or in the optimization of biodiesel production processes or for the blending with others suitable products. On the basis of the fatty acid composition of the vegetable oils, the group contribution methods are known to be a powerful tool for predicting physical properties when experimental data are not available [15] [35]. Indeed, more than 95% of vegetable oil composition includes fatty acids. Furthermore, group contribution method is very effective to take into account of the contribution of glycerol that cannot be neglected for a more accurate esti-mate.
Table 2. Measured Fatty acids composition (peak area, %) of rapeseed and jatropha oils.
Fatty acids Formula Rapeseed oil Jatropha oil Oleic (C18:1) C18H34O2 60.78 41.64
Linoleic (C18:2) C18H32O2 19.22 32.53
Linolenic (C18:3) C18H30O2 8.92 0.00
Palmitic (C16:0) C16H32O2 4.78 16.00
Stearic (C18:0) C18H38O2 1.35 6.05
[image:4.595.209.541.670.725.2]Other minor fatty acids - 4.95 3.77
Table 3. Experimental devices or methods for rapeseed and jatropha oils physical proper-ties determination.
Physical
DOI: 10.4236/aces.2019.91004 48 Advances in Chemical Engineering and Science
In this study, rapeseed and jatropha oils critical properties were estimated by using correlative methods that are based on group-contribution approach. Mar-rero and Gani (MG) method was used [36]. In fact, several studies [26] [36] [37] [38] show that this method performs better in terms of greater accuracy and wide applicability. Marrero and Gani method performs estimations at different levels: the primary level describes a wide variety of simple, monofunctional groups; the higher levels treat multifunctional structures and take into account the interactions among isomers functionalities.
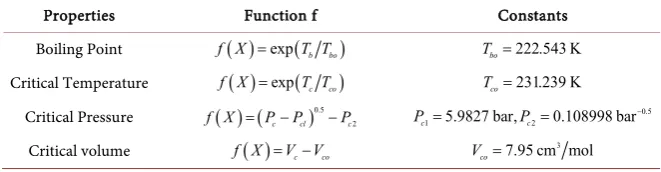
For this method, each critical property is estimated by a function f which de-pends, on the one hand on the different contributions of the functional groups at different levels as shown in the Equation (1) and on the other hand on the pri-mary properties. The functions used for this work are listed in Table 4.
( )
i i i j j j k k kf X =
∑
N C w+∑
M D +z∑
O E (1)f(X) is a function of the property X to be estimated, and i, j and, k refer to the first, second and third order groups defined in the group contribution method.
Ni and Mjare the number of the i-th first order group, and the j-th second order
group, respectively, present in the molecule, and C and D are the fitted contribu-tions to the first and second order groups, respectively.
The approach used is based on the rapeseed and jatropha oils fatty acid com-position: each fatty acid has been fragmented into several chemical groups and the contribution of each group is taken into account to get the contribution of the corresponding fatty acid. Then, the rapeseed or Jatropha oils critical proper-ties can be estimated satisfactorily by taking into account their composition in fatty acids. For these different physical properties, at least two methods most suited for vegetable oils were considered and the best of them was retained.
Density estimation
There are several methods that can be used to estimate liquid density of pure or mixture compound [39]. However, the most important and accurate among them, and that is applicable to vegetable oils is Gunn Yamada’s and Method of Ihmels et al. [38].
[image:5.595.208.539.635.721.2]According to Gunn Yamada’s estimation method, the pure compound liquid density is evaluated as follows Equations (2) to (6). The temperature range of this correlation extends from a reduced temperature of 0.20 to just below the critical temperature.
Table 4. Functions and constants for Marrero and Gani’s group estimation method.
Properties Function f Constants Boiling Point f X
( )
=exp(
T Tb bo)
Tbo=222.543 KCritical Temperature f X
( )
=exp(
T Tc co)
Tco=231.239 KCritical Pressure ( ) ( )0.5 2
c cl c
f X = P P− −P 0.5
1 5.9827 bar, 2 0.108998 bar
c c
P = P = −
Critical volume f X( )= −V Vc co
3 7.95 cm mol co
DOI: 10.4236/aces.2019.91004 49 Advances in Chemical Engineering and Science
( )
(
)
1 o 1
sc R
V V ω
ρ = − Γ (2)
where ( )
( )
( )
1 1 ref sc oR ref ref
V
V T T
ρ ω
=
− Γ
(3)
and 0.29607 0.09045 0.04843 2
R R
T T
Γ = − − (4)
and ω is the acentric factor and is calculated using Equation (5)
0.291 0.080
c c
C
PV
RT = − ω (5)
where Pc, Tc and Vc are the critical pressure, temperature and volume,
respec-tively. Tref is a reference temperature, generally ambient temperature, ρref is the
density at the reference temperature.
( )O 0.33593 0.33593 1.51941 2 2.02512 3 1.11422 4
R R R R R
V = − T + T − T + T (6)
for temperature ranges corresponding to 0.2≤TR≤0.8 where TR is the reduced
temperature with R C
T T
T
= . In this study, reference data are these obtained
expe-rimentally at 298 K from this study.
Ihmels and Gmehling [38] extended and revised the group contribution me-thod GCVOL developed by Elbro et al. for the prediction of liquid density. Ac-cording to this method, the density of vegetable oils can be estimated by the Eq-uation (7) below:
w w
i i
M M
V n v
ρ= = ∆
∑
(7)where MW is the molecular weight and V the molar volume. The molar volume
is obtained by summing up all the group volume contributions Δνi with ni the
number of group i appearing in the compound, while Δνiis expressed as a
poly-nomial function of absolute temperature: 2
i i i i
v A B T C T
∆ = + + (8)
where the units are K for temperature and cm3·mol−1 for Δν
i. Group functional
and there parameters Ai, Biand Ci can be seen in this literature [39].
The molecular weight of vegetable oils can be estimated using Equation (9):
3 38.0488
w i wi
M =
∑
x M + [40] (9)Dynamic viscosity estimation
The most important methods used for dynamic viscosity estimation of pure compounds are based on group contribution models proposed by
Jöback-Lydersen’s [39] and by Morris [41].
Jöback-Lydersen’s method used a simple correlation given by Equation (10):
597.82
exp a 4.294
w b
M
T
µ
µ= ⋅ ∆ − + ∆ −µ
DOI: 10.4236/aces.2019.91004 50 Advances in Chemical Engineering and Science
where Δμa and Δμb are Jöback groups’ contributions which are given and T is the
temperature. No temperature limitations are specified for this method except for the fact that the temperature must be less than the critical.
For Morris’s Method, the dynamic viscosity μL can be estimated using
Equa-tion (11) to EquaEqua-tion (12).
10 1
log L 1
R
J T
µ µ+
= −
(11)
where J=
(
0.577+∑
∆µ
M)
1 2 (12)ΔμM represents the group contributions factors which are given and μ+ is
compound class group contribution. This method is limited to temperatures less than 0.8 times the critical temperature.
Thermal conductivity estimation
For thermal conductivity estimation of rapeseed and jatropha oils respectively, two methods based on group contribution method proposed by Sastri, and Sa-to-Riedel [39] were selected. Sastri method gives the thermal conductivity λL by
Equation (13) below:
m
L ba
λ =λ (13)
where m is given by Equation (14) 1 1
1
n R br
T m
T
−
= − −
(14)
and λb is calculated using the group contribution method Equation (15):
b b corr
λ =
∑
∆λ +∑
∆λ (15)Δλb is the group contribution value of the different groups and Δλcorris a
cor-rection factor which may be required for some compounds. “a” and “n” are con-stants. Excepted for alcohols and phenols (where a = 0.856 and n = 1.23) the values for these constants are respectively 0.160 and 0.20 for most compounds
[6], Tbr is the ratio of the boiling temperature and the critical temperature. Sato-Riedel method is based on the equation of Sato-Riedel Equation (16) as follow:
(
)
(
)
(
)
(
)
2 3
2 3 1 2 1.1053 3 20 1
3 20 1
R
br w
T
T M
λ= ∗ + −
+ − ∗ (16)
The upper temperature limit for Sato-Riedel method is the critical point and thermal conductivity will not be calculated at temperatures above this.
Heat capacity at constant pressure (Cp) estimation
Two methods were selected to estimate the heat capacity at constant pressure. The most accurate method was chose by comparing the values of the estimated properties with experimental values of this study. Zong et al.[43] developed an approach based on chemical constituent fragments to estimate the thermo phys-ical properties. The heat capacity l
p
ac-DOI: 10.4236/aces.2019.91004 51 Advances in Chemical Engineering and Science
cording to this approach.
( )
, ,l l
P A frag A P A
C =
∑
N C T (17)where CP Al, =A1,A+A T2,A (18), A1,A and A2,A are parameters of temperature
dependent correlation for fragment A and T is the temperature (K), and Nfrag,A
is the number of fragments A in the component. The detail of Zong et al. me-thod and the others parameters can be found in the following references [38] [43].
Ceriani et al. [44] applied group contribution method to predict heat capacity for fatty compounds and oils. The equation used is given by Equation (18)
(
)
l
Pi k k k k
C =
∑
N ⋅ A B T+ (18)where Nk is the number of group k in the molecule and Ak, Bk are parameters
obtained from the regression. The detail of Ceriani et al. [38] [44] method and the others parameters can be found in the following literature [39].
No temperature limit was found for Ceriani et al. and Zong et al. methods.
3. Results and Discussion
For all the physical properties, the Average Relative Deviation (ARD) which formula given by Equation (19) is used to evaluate the accuracy of the different studied methods and for the validation of the estimated values.
( )
1 1ARD % N100
V V V
Exp Est Exp
N
=
∑
∗ − (19)where N is the number of data points, ExpV is experimental value, EstV is
esti-mated value.
[image:8.595.210.540.592.711.2]3.1. Results for Critical Properties and Normal Boiling Point
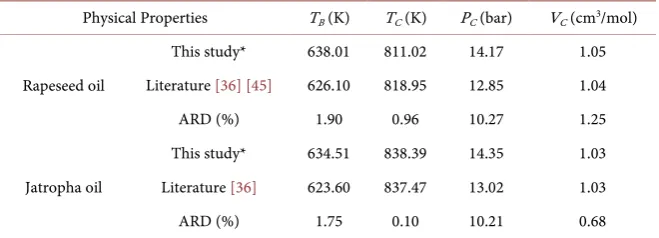
Table 5 shows the results of critical properties and normal boiling point pre-dicted by the MG method for rapeseed and Jatropha oils.
To test the reliability of MG method, the estimated values of this study have been compared with literature data. However, there are literature data for only canola oil which is another variety of rapeseed oil and then is used for comparison.
Table 5. Rapeseed and Jatropha oil estimated critical properties and normal boiling point by MG method.
Physical Properties TB (K) TC (K) PC (bar) VC (cm3/mol)
Rapeseed oil
This study* 638.01 811.02 14.17 1.05 Literature [36] [45] 626.10 818.95 12.85 1.04 ARD (%) 1.90 0.96 10.27 1.25
Jatropha oil
This study* 634.51 838.39 14.35 1.03 Literature [36] 623.60 837.47 13.02 1.03 ARD (%) 1.75 0.10 10.21 0.68
DOI: 10.4236/aces.2019.91004 52 Advances in Chemical Engineering and Science
As shown in Table 5, the relative deviation between literature data and esti-mated values for rapeseed and jatropha oils are low for TB, TC and VC confirming
the reliability of MG method. Large deviations were only observed for critical pressure in both cases. Poling et al. [39] have already noted that for the estima-tion of the critical pressure, the largest errors are found for the heavier mole-cules, consequently the estimations may be too high or too low with no obvious pattern for errors under these conditions. This could therefore explain the high ARD for vegetable oils, since they are formed of triglycerides which are large molecules.
3.2. Experimental Results of Rapeseed and Jatropha Oils Physical
Properties
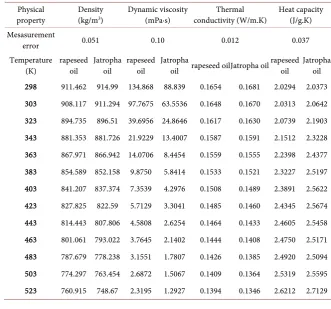
The experimental data of this work for physical properties of rapeseed and Ja-tropha oils, for the temperature range 298 to 523 K, using the different methods and devices above mentioned are given in Table 6.
[image:9.595.205.537.422.731.2]Figure 1 and Figure 2 show curves evolution of experimental density, heat capacity, thermal conductivity and dynamic viscosity. Figures indicate that all physical properties of the two oils above mentioned decrease as the temperature increases except the heat capacity which increases along with temperature. For the viscosity, the effect of temperature is related to the decrease of intermolecu-lar forces, making easier the flow and therefore the reduction of viscosity [46]. In
Table 6. Experimental values for secondary physical properties of rapeseed and jatropha oils obtained in this work.
Physical
property Density (kg/m3) Dynamic viscosity (mPa∙s) conductivity (W/m.K) Thermal Heat capacity (J/g.K)
Mesasurement
error 0.051 0.10 0.012 0.037 Temperature
DOI: 10.4236/aces.2019.91004 53 Advances in Chemical Engineering and Science Figure 1. Experimental density and dynamic viscosity curves evolution of rapeseed and Jatropha versus temperature.
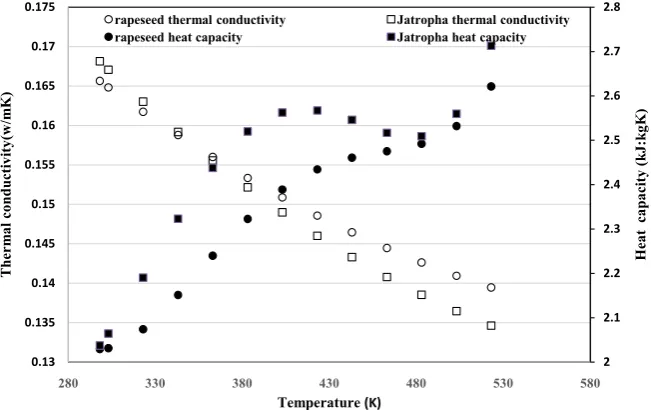
Figure 2. Experimental thermal conductivity and heat capacity curves evolution of rape-seed and Jatropha versus temperature.
the case of density, when the temperature increases, the molecules disperse and the fluid expands in occupying a larger space. As the mass of the fluid remains identical, this expansion causes a decrease in the density. However, the specific heat of the two oils increases along with increasing temperature. This trend con-firms the experimental results obtained by Morad et al. [40] with DSC method. They also found that this increase in heat capacity with temperature is related to the mobility of the molecules depending on the temperature.
0 20 40 60 80 100 120 140 160 720 770 820 870 920 970
280 330 380 430 480 530 580
D yn am ic vi sc os ity ( m P a s) D en sit y ( g/c m 3) Temperature (K)
Rapeseed density Jatropha density
Rapeseed dynamic viscosity Japtropha dynamic viscosity
2 2.1 2.2 2.3 2.4 2.5 2.6 2.7 2.8 0.13 0.135 0.14 0.145 0.15 0.155 0.16 0.165 0.17 0.175
280 330 380 430 480 530 580
H eat c ap ac ity (k J: kgK ) T he rm al c onduc tiv ity (w /m K ) Temperature(K)
rapeseed thermal conductivity Jatropha thermal conductivity
[image:10.595.211.537.366.571.2]DOI: 10.4236/aces.2019.91004 54 Advances in Chemical Engineering and Science
3.3. Estimated Physical Properties for Rapeseed and Jatropha Oils
[image:11.595.211.537.255.462.2]3.3.1. Density
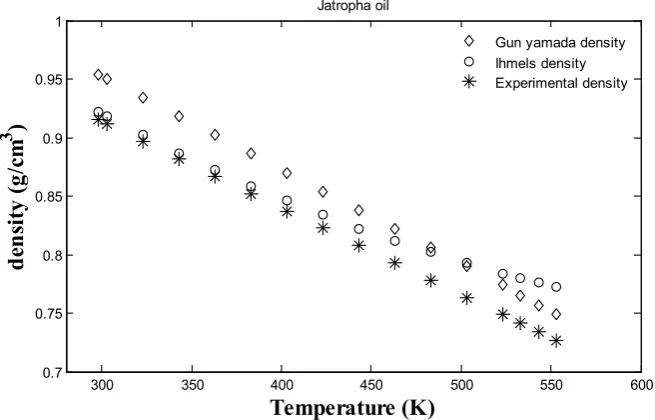
Figure 3 and Figure 4 show respectively the estimated and experimental density values for rapeseed and Jatropha oils as a function of temperature. In both cases, the estimated and experimental data show the same trend with temperature: density decreases when temperature increases. In particular when temperature increases the Gunn Yamada density curve gets closer to the experimental one while the Ihmels et al.’s density curve is closer to the experimental one at low temperatures and deviates more and more as the temperature increases. In ad-dition, low deviations between experimental values and predicted one were found with the two methods as shown in Table 7 showing the goodness
[image:11.595.210.538.497.707.2]Figure 3. Experimental and estimated density of rapeseed oil.
Figure 4. Experimental and estimated density of jatropha oil.
300 350 400 450 500 550 600
0.7 0.75 0.8 0.85 0.9 0.95 1
Temperature (K)
den
si
ty
(g
/c
m
3
)
Rapeseed oil
Gun yamada density Ihmels density Experimental density
300 350 400 450 500 550 600
0.7 0.75 0.8 0.85 0.9 0.95 1
Temperature (K)
den
si
ty
(g
/c
m
3
)
Jatropha oil
DOI: 10.4236/aces.2019.91004 55 Advances in Chemical Engineering and Science Table 7. ARD values for the different methods used.
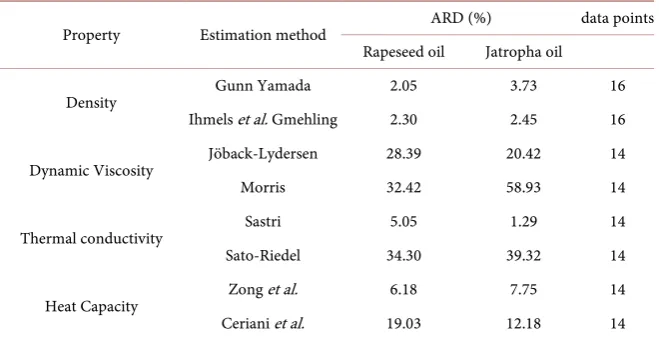
Property Estimation method ARD (%) data points Rapeseed oil Jatropha oil
Density Gunn Yamada 2.05 3.73 16 Ihmels et al. Gmehling 2.30 2.45 16 Dynamic Viscosity Jöback-Lydersen 28.39 20.42 14 Morris 32.42 58.93 14 Thermal conductivity Sastri 5.05 1.29 14 Sato-Riedel 34.30 39.32 14 Heat Capacity Zong et al. 6.18 7.75 14 Ceriani et al. 19.03 12.18 14
of the two correlatives methods. However, in view of the purpose of this work, Gunn Yamada correlative method is recommended for extrapolation of density at high temperatures typically observed during the injection phase in diesel en-gine. Ihmels et al.’s method is then recommended for determined edible vegeta-ble oils properties for food purposes.
3.3.2. Dynamic Viscosity
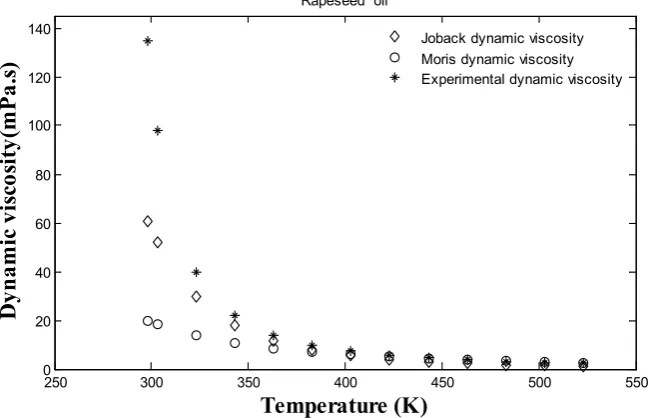
The accuracy of the experimental measurements by considering the imperfec-tions of the geometry and the precision of the rheometer was estimated to be in the order of 10%. Two estimation methods have been discussed. In Figure 5 and
Figure 6, calculated dynamic viscosities are compared with experimental values for rapeseed and jatropha oils.
For temperatures lower than 350 K, large errors result, as illustrated on both figures for the two methods. This is due to the fact that Jöback-Lyderson and Morris viscosity correlations [39] [41] don’t assume that ln is a linear function of reciprocal temperature. Because generally for a temperature range from the freezing point to the normal boiling temperature, when the natural logarithm of dynamic viscosity is assume to be a linear reciprocal absolute temperature, good approximation is found.
Therefore, for low temperatures, deviations can be observed. In the same range of temperature, experimental values of viscosity are higher than estimated ones obtained by Jöback-Lyderson and Morris. The two methods give similar accuracies and tend to underestimate vegetable oil dynamic viscosity but the method of Jöback-Lyderson yields the smallest errors.
DOI: 10.4236/aces.2019.91004 56 Advances in Chemical Engineering and Science Figure 5. Experimental and estimated dynamic viscosity of rapeseed oil.
Figure 6.Experimental and estimated dynamic viscosity of jatropha oil.
3.3.3. Thermal Conductivity
Table 8 shows the reproducibility error of the device for measuring the thermal conductivity of vegetable oils. The measuring device was found to lead to a re-producibility error of about 1.2%.
Two estimation methods have been discussed: Sastri and Riedel methods [39]. In Figure 7 and Figure 8, calculated thermal conductivity is compared with ex-perimental values for rapeseed and jatropha oils. As expected, in both figures, the results show that the thermal conductivity decreases when the temperature increases. However, the difference between the thermal conductivity obtained by the two estimative methods is very large. The average relative deviation between the estimated thermal conductivity and the experimental values is about 5% for
250 300 350 400 450 500 550
0 20 40 60 80 100 120 140
Temperature (K)
D
yn
ami
c vi
sc
os
ity(
mP
a.
s)
Rapeseed oil
Joback dynamic viscosity Moris dynamic viscosity Experimental dynamic viscosity
250 300 350 400 450 500 550
0 10 20 30 40 50 60 70 80 90 100
Temperature (K)
D
yn
ami
c vi
sc
os
ity(
mP
a.
s)
Jatropha oil
DOI: 10.4236/aces.2019.91004 57 Advances in Chemical Engineering and Science Table 8. Reproducibility errors for measuring the thermal conductivity of vegetable oils.
Method Error (%) Oil Reference Photoacoustic 2 Sunflower [47]
3 Soybean
Thermal analyser
1 Sunflower (21˚C)
[48]
[image:14.595.212.535.454.662.2]1,8 Sunflower (68.7˚C) 1.2 Soybean (21˚C)
Figure 7. Experimental and estimated thermal conductivity of rapeseed oil.
Figure 8. Experimental and estimated thermal conductivity of jatropha oil.
Sastri method. Riedel method overestimates the rapeseed and jatropha oils thermal conductivity. Then, Sastri method gives good agreement between
pre-300 350 400 450 500 550
0.08 0.1 0.12 0.14 0.16 0.18
Temperature (K)
T
he
rmal
c
on
du
ct
ivi
ty (
W
/mK
)
Rapeseed oil
Sastri Thermal condcutivity Riedel Thermal conductivity Experimental thermal conductivity
300 350 400 450 500 550
0.08 0.09 0.1 0.11 0.12 0.13 0.14 0.15 0.16 0.17 0.18
Temperature (K)
T
he
rmal
c
on
du
ct
ivi
ty (
W
/mK
)
Jatropha oil
DOI: 10.4236/aces.2019.91004 58 Advances in Chemical Engineering and Science
dicted thermal conductivity and experimental thermal conductivity data in the studied temperature range. The higher agreement of Sastri method with experi-mental values is probably due to the fact that this correlative method involves the contribution of functional groups as well as correction factors, whereas the Riedel method involves only a reference value and a reduced temperature.
3.3.4. Heat Capacity at Constant Pressure (Cp)
Two methods for estimating liquid heat capacities were considered. Figure 9
[image:15.595.213.534.248.458.2] [image:15.595.210.537.494.707.2]and Figure 10 show comparison of estimated values and experimental data of heat capacity for rapeseed and jatropha oils. For all the considered cases, the heat capacity increases along with the temperature. The figures show that Zong et al.
Figure 9. Experimental and estimated thermal heat capacity of rapeseed oil.
Figure 10. Experimental and estimated thermal heat capacity of jatropha oil.
300 350 400 450 500 550
1.8 2 2.2 2.4 2.6 2.8 3 3.2 3.4 3.6
Temperature (K)
H
eat
C
ap
ac
ity(
J/
g.
K
)
Rapeseed oil Zong et al Heat capacity
Ceriani et al Heat capacity Experimental Heat capacity
300 350 400 450 500 550
2 2.5 3 3.5
Temperature (K)
H
eat
C
ap
ac
ity(
J/
g.
K
)
Jatropha oil
DOI: 10.4236/aces.2019.91004 59 Advances in Chemical Engineering and Science [43] method give large negative deviation, while Ceriani et al. method has small positive deviation [44]. Ceriani’s method gives very low errors especially for rel-atively low temperatures (<400 K). But in the considered temperature range, Zong et al. method shows satisfactory agreement with experimental data for both vegetable oils. This can be seen in Table 7 for ARD values. Zong’s method is based on a fragmentation approach of the molecule which is likely to occur at higher temperature whereas Cerani’s method is based on the functional groups. This shows that for low temperatures, the functional group approach is better than that of the fragmentation approach. But both of these methods yield better results which show that although the vegetable oils are formed of triglycerides which are themselves formed of fatty acids, their physical properties can be de-termined successfully by fragmentation or group contribution approach.
In addition, while the curve of the three methods evolves linearly, the experi-mental one varies first linearly and then changes the slope from 450 K. This clearly shows that from a certain temperature the nature of the oil evolves. This confirms the results of our previous studies which showed that, starting from a certain temperature depending on the oil, the nature of the latter evolved fol-lowing the thermal decomposition of the triglycerides it contains.
For each recommended estimation model, the curves of the physical proper-ties as well as the ARDs of the two oils can differ depending on the physical property under consideration. The rapeseed and jatropha oils are substantially different in their fatty acid composition. Indeed, according to the Table 2, al-though both oils are mono-unsaturated, rapeseed oil contains more than 8% of linolenic acid while jatropha oil does not contain any. This difference in terms of fatty acid composition certainly affects the physical properties of vegetable oils as well as their evolution with temperature. This is in accordance with literature results [49].
4. Conclusions
DOI: 10.4236/aces.2019.91004 60 Advances in Chemical Engineering and Science
Sastri and Zong et al. methods with ARD lower than 7.75 for both Rapeseed and Jatropha oils.
Further studies to be conducted on vegetable oils having extreme fatty acid composition will allow correlating more specifically the evolution up to 523 K of a given physical property to the composition of oils.
Acknowledgements
A.S. Zongo expresses his gratitude to French Cooperation in Burkina Faso who, through the Service for Cooperation and Cultural Action (SCAC), financed this study by awarding an internship fellowship in 2017 at CIRAD Montpellier.
Conflicts of Interest
The authors declare no conflicts of interest regarding the publication of this paper.
References
[1] Ramadhas, A.S., Jayara, J.S. and Muraleedharan, C. (2004) Use of Vegetable Oils as
I.C. Engine Fuels—A Review. Renewable Energy, 29, 727-742.
https://doi.org/10.1016/j.renene.2003.09.008
[2] Misra, R.D. and Murthy, M.S. (2010) Straight Vegetable Oils Usage in a
Compres-sion Ignition Engine. Renewable and Sustainable Energy Reviews, 14, 3005-3013.
https://doi.org/10.1016/j.rser.2010.06.010
[3] Altin, R., Cetinkaya, S. and Yücesu, H.S. (2001) The Potential of Using Vegetable
Oil Fuels as Fuel for Diesel Engines. Energy Conversion and Management, 42,
529-538. https://doi.org/10.1016/S0196-8904(00)00080-7
[4] Peterson, C.L., Wagner, G.L. and Auld, D.L. (1983) Vegetable Oil Substitutes for
Diesel Fuels. Transactions of the American Society of Agricultural Engineers, 26,
0322-0327. https://doi.org/10.13031/2013.33929
[5] José, J.S., Sanz-Tejedor, M.A. and Arroyo, Y. (2015) Effect of Fatty Acid
Composi-tion in Vegetable Oils on CombusComposi-tion Processes in an Emulsion Burner. Fuel
Processing Technology, 130, 20-30. https://doi.org/10.1016/j.fuproc.2014.09.036
[6] Agarwal, D. and Agarwal, A.K. (2007) Performance and Emissions Characteristics
of Jatropha Oil (Preheated and Blends) in a Direct Injection Compression Ignition
Engine. Applied Thermal Engineering, 27, 2314-2323.
https://doi.org/10.1016/j.applthermaleng.2007.01.009
[7] Devan, P.K. and Mahalakshmi, N.V. (2009) A Study of the Performance, Emission
and Combustion Characteristics of a Compression Ignition Engine Using Methyl
Ester of Paradise Oil-Eucalyptus Oil Blends. Applied Energy, 86, 675-680.
https://doi.org/10.1016/j.apenergy.2008.07.008
[8] Prasad, C.M.V., Krishna, M.V.S., Reddy, C.P. and Mohan, K.R. (2000) Performance
Evaluation of Non-Edible Vegetable Oils as Subtitute Fuels in Low Heat Rejection
Diesel Engines. Proceedings of the Institution of Mechanical Engineers, Part D:
Journal of Automobile Engineering, 214, 181-188.
https://doi.org/10.1177/095440700021400207
[9] Labeckas, G. and Slavinskas, S. (2003) The Analysis of Diesel Engine Performance
on Pure Rapeseed Oil. Proceedings of 4th International Conference, Vilnius
DOI: 10.4236/aces.2019.91004 61 Advances in Chemical Engineering and Science
[10] Zongo, A.S. (2015) Etude des processus physiques et chimiques mis en jeu lors de la
combustion des huiles végétales pures dans les moteurs diesel: mécanismes de décomposition et de polymérisation. Ph D, Ouaga I Pr Joseph KI-ZERBO/Université d’Orléans.
[11] Agarwal, D., Lokesh, K. and Agarwal, A.K. (2008) Performance Evaluation of a
Vegetable Oil Fuelled Compression Ignition Engine. Renewable Energy, 33,
1147-1156. https://doi.org/10.1016/j.renene.2007.06.017
[12] Daho, T., Vaïtilingom, G., Sanogo, O., Ouiminga, S.K., Segda, B.G., Valette, J.,
Hi-gelin, P. and Koulidiati, J. (2012) Study of Droplet Vaporization of Various Vegeta-ble Oils and Blends of Domestic Fuel Oil-Cottonseed Oil under Different Ambient
Temperature Conditions. Biomass and Bioenergy, 46, 653-663.
https://doi.org/10.1016/j.biombioe.2012.06.031
[13] Daho, T., Vaïtilingom, G., Sanogo, O., Ouiminga, S.K., Segda, B.G., Valette, J.,
Hi-gelin, P. and Koulidiati, J. (2012) Model for Predicting Evaporation Characteristics
of Vegetable Oils Droplets Based on Their Fatty Acid Composition. International
Journal of Heat and Mass Transfer, 55, 2864-2871.
https://doi.org/10.1016/j.ijheatmasstransfer.2012.01.048
[14] Wallek, T., Rarey, J., Metzger, J.O. and Gmehling, J. (2013) Estimation of
Pure-Component Properties of Biodiesel-Related Components: Fatty Acid Methyl
Esters, Fatty Acids, and Triglycerides. Industrial & Engineering Chemistry
Re-search, 52, 16966-16978. https://doi.org/10.1021/ie402591g
[15] Ceriani, R., Gonçalves, C.B. and Coutinho, J.A.P. (2011) Prediction of Viscosities of
Fatty Compounds and Biodiesel by Group Contribution. Energy & Fuels, 25,
3712-3717.https://doi.org/10.1021/ef200669k
[16] Freitas, S.V.D., Pratas, M.J., Ceriani, R., Lima, A.S. and Coutinho, J.A.P. (2011)
Evaluation of Predictive Models for the Viscosity of Biodiesel. Energy & Fuels, 25,
352-358.https://doi.org/10.1021/ef101299d
[17] Machado, F.A.L., Zanelato, E.B., Guimarães, A.O., Silva, E.C.D. and Mansanares,
A.M. (2012) Thermal Properties of Biodiesel and Their Corresponding Precursor
Vegetable Oils Obtained by Photopyroelectric Methodology. International Journal
of Thermophysics, 33, 1848-1855.https://doi.org/10.1007/s10765-012-1245-6
[18] Vicente, G., Martínez, M. and Aracil, J. (2006) A Comparative Study of Vegetable
Oils for Biodiesel Production in Spain. Energy & Fuels, 20, 394-398.
https://doi.org/10.1021/ef0502148
[19] Moradi, G.R., Karami, B. and Mohadesi, M. (2013) Densities and Kinematic
Viscos-ities in Biodiesel-Diesel Blends at Various Temperatures. Journal of Chemical &
Engineering Data, 58, 99-105.https://doi.org/10.1021/je3008843
[20] Nogueira, C.A., Carmo, F.R., Santiago, D.F., Nogueira, V.M., Fernandes, F.A.N.,
Aguiar, R.S.S. and Sant’Ana, H.B.D. (2012) Viscosities and Densities of Ternary
Blends of Diesel + Soybean Biodiesel + Soybean Oil. Journal of Chemical &
Engi-neering Data, 57, 3233-3241.https://doi.org/10.1021/je300838n
[21] Barabás, I. and Todoruţ, I.A. (2011) Predicting the Temperature Dependent
Viscos-ity of Biodiesel-Diesel-Bioethanol Blends. Energy & Fuels, 25, 5767-5774.
https://doi.org/10.1021/ef2007936
[22] Feitosa, F.X., Rodrigues, M.D.L., Veloso, C.B., Cavalcante, C.L., Albuquerque,
M.C.G. and Sant’Ana, H.B.D. (2010) Viscosities and Densities of Binary Mixtures of
Coconut + Colza and Coconut + Soybean Biodiesel at Various Temperatures.
Jour-nal of Chemical & Engineering Data, 55, 3909-3914.
DOI: 10.4236/aces.2019.91004 62 Advances in Chemical Engineering and Science
[23] Dias, J.M., Alvim-Ferraz, M.C.M. and Almeida, M.F. (2008) Mixtures of Vegetable
Oils and Animal Fat for Biodiesel Production: Influence on Product Composition
and Quality. Energy Fuels, 22, 3889-3893.https://doi.org/10.1021/ef8005383
[24] Anand, K., Ranjan, A. and Mehta, P.S. (2010) Estimating the Viscosity of Vegetable
Oil and Biodiesel Fuels. Energy & Fuels, 664-672.https://doi.org/10.1021/ef900818s
[25] Anand, K., Ranjan, A. and Mehta, P.S. (2010) Predicting the Density of Straight and
Processed Vegetable Oils from Fatty Acid Composition. Energy & Fuels, 24,
3262-3266.https://doi.org/10.1021/ef100143f
[26] Cunico, L.P., Ceriani, R. and Guirardello, R. (2013) Estimation of Physical
Proper-ties of Vegetable Oils and Biodiesel Using Group Contribution Methods. Chemical
Engineering Transactions, 32, 535-540.
[27] Wang, C. and Erhan, S. (1999) Studies of Thermal Polymerization of Vegetable Oils
with a Differential Scanning Calorimeter. JAOCS, 76, 1211-1216.
https://doi.org/10.1007/s11746-999-0096-1
[28] Wilson, L.C., Wilson, H.L., Wilding, W.V. and Wilson, G.M. (1996) Critical Point
Measurements for Fourteen Compounds by a Static Method and a Flow Method. Journal of Chemical & Engineering Data, 41, 1252-1254.
https://doi.org/10.1021/je960052x
[29] VonNiederhausern, D.M., Wilson, G.M. and Giles, N.F. (2006) Critical Point and
Vapor Pressure Measurements for Four Compounds by a Low Residence Time Flow
Method. Journal of Chemical & Engineering Data, 51, 1986-1989.
https://doi.org/10.1021/je0602465
[30] Nikitin, E.D., Pavlov, P.A. and Skripov, P.V. (1993) Measurement of the Critical
Properties of Thermally Unstable Substances and Mixtures by the Pulse-Heating
Method. The Journal of Chemical Thermodynamics, 25, 869-880.
https://doi.org/10.1006/jcht.1993.1084
[31] Plank, M., Wachtmeister, G., Remmele, E., Thuneke, K. and Emberger, P. (2017)
Ignition Characteristics of Straight Vegetable Oils in Relation to Combustion and
Injection Parameters, as Well as Their Fatty Acid Composition. Fuel Processing
Technology, 167, 271-280.https://doi.org/10.1016/j.fuproc.2017.07.007
[32] Mehta, P.S. and Anand, K. (2009) Estimation of a Lower Heating Value of
Vegeta-ble Oil and Biodiesel Fuel. Energy & Fuels, 23, 3893-3898.
https://doi.org/10.1021/ef900196r
[33] Mishra, S., Anand, K. and Mehta, P.S. (2016) Predicting the Cetane Number of
Bio-diesel Fuels from Their Fatty Acid Methyl Ester Composition. Energy & Fuels, 30,
10425-10434.https://doi.org/10.1021/acs.energyfuels.6b01343
[34] Hoffmann, J.-F., Henry, J.-F., Vaitilingom, G., Olives, R., Chirtoc, M., Caron, D.
and Py, X. (2016) Temperature Dependence of Thermal Conductivity of Vegetable Oils for Use in Concentrated Solar Power Plants, Measured by 3omega Hot Wire
Method. International Journal of Thermal Sciences, 107, 105-110.
https://doi.org/10.1016/j.ijthermalsci.2016.04.002
[35] Neto, E.G.L., Silva, G.P. and Silva, G.F. (2012) Evaluation of Group-Contribution
Methods to Estimate Vegetable Oils and Biodiesel Properties. International Journal
of Engineering and Technology, 2, 1600-1605.
[36] Marrero, J. and Gani, R. (2001) Group-Contribution Based Estimation of Pure
Component Properties. Fluid Phase Equilibria, 183-208.
https://doi.org/10.1016/S0378-3812(01)00431-9
Or-DOI: 10.4236/aces.2019.91004 63 Advances in Chemical Engineering and Science
ganic Compounds. Industrial & Engineering Chemistry Research, 43, 7618-7621.
https://doi.org/10.1021/ie049378m
[38] Su, Y.C. (2011) Selection of Prediction Methods for Thermophysical Properties for
Process Modeling and Product Design of Biodiesel Manufacturing. Virginia Poly-technic Institute and State University.
[39] Poling, B.E., Prausnitz, J.M. and O’connel, J.P. (2001) The Properties of Gases and
Liquids. 8th Edition, McGraw-Hill, New York.
[40] Morad, N.A., Kamal, A.A.M., Panau, F. and Yew, T.W. (2000) Liquid Specific Heat
Capacity Estimation for Fatty Acids, Triacylglycerols, and Vegetable Oils Based on
Their Fatty Acid Composition. JAOCS, 77, 1001-1005.
https://doi.org/10.1007/s11746-000-0158-6
[41] Morris, P.S. (1964) M.S Thesis. Polytechnic Institute of Brooklyn, New York.
[42] Technology, D. (1995) Predict Chemical Thermodynamic & Transport Properties of
Interest to Chemical Engineers and Chemists, Version 4.
[43] Zong, L., Ramanathan, S. and Chen, C.C. (2010) Fragment-Based Approach for
Es-timating Thermophysical Properties of Fats and Vegetable Oils for Modeling Biodiesel
Production Process. Industrial & Engineering Chemistry Research, 49, 876-886.
https://doi.org/10.1021/ie900513k
[44] Ceriani, R., Gani, R. and Meirelles, A.J.A. (2009) Prediction of Heat Capacities and
Heats of Vaporization of Organic Liquids by Group Contribution Methods. Fluid
Phase Equilibria, 283, 49-55.https://doi.org/10.1016/j.fluid.2009.05.016
[45] Lima Neto, E.G., Silva, G.P. and Silva, G.F. (2012) Evaluation of Group
Contribu-tion Methods to Estimate Vegetable Oils and Biodiesel Properties. International
Journal of Engineering and Technology, 9, 1600-1605.
[46] Santos, J.C.O., Santos, I.M.G. and Souza, A.G. (2005) Effect of Heating and Cooling
on Rheological Parameters of Edible Vegetable Oils. Journal of Food Engineering,
67, 401-405.https://doi.org/10.1016/j.jfoodeng.2004.05.007
[47] Balderas Lopez, J.A., Galvez Coyt, G., Munoz Diosdado, A. and Diaz Reyes, J.
(2013) Thermal Characterization of Vegetable Oils by Means of Photoacoustic
Techniques. Revista Mexicana de Fisica, 59, 168-172.
[48] Brock, J., Nogueira, M.R., Zakrzevski, C., Corazza, F.D.C., Corazza, M.L. and De
Oliveira, J.V. (2008) Experimental Measurements of Viscosity and Thermal
Con-ductivity of Vegetable Oils. Ciência e Tecnologia Alimentos, 28, 564-570.
https://doi.org/10.1590/S0101-20612008000300010
[49] Sanz-Tejedor, M., Ascensión, Y.A. and José, J.S. (2016) Influence of Degree of
Un-saturation on Combustion Efficiency and Flue Gas Emissions of Burning Five
Re-fined Vegetable Oils in an Emulsion Burner. Energy & Fuels, 30, 7357-7366.
DOI: 10.4236/aces.2019.91004 64 Advances in Chemical Engineering and Science
Nomenclature
ARD : Average relative deviation,% Tref : Reference temperature, K
Clp : Liquid phase specific heat Vc : Critic volume, cm3/mol
Cp : Heat capacity W : Acentric factor p
C° : Ideal gas heat capacity, kj/kmol K x
i : Mole fraction of component i
Ev : Estimated value ZRAi : Rackett parameter of component i
Fc : Correction factor Δλb : Thermal conductivity group contribution
Lv : Litterature value Δλcor : Thermal conductivity correction factor
MW : Molecular weight Δμa : Jöback groups’ contributions a
MWi : Molecular weight of component i Δμb : Jöback groups’ contributions b
N : Number of data points ΔμM : Group contributions factors
Tbr : Quotient of the boiling temperature, K λ0 : Reference thermal conductivity
Nfrag : Fragment number λL : Liquid thermal conductivity
Nk : Number of group k μ+ : Compound class group contribution
Pci: : Critical pression of component i μL : Liquid dynamic viscosity
R : Universal gas constant ρoil : Density of vegetable oil