ISSN Online: 2158-2750 ISSN Print: 2158-2742
Efficacy of Less Toxic Phytochemicals to
Prevent the Insect Vector of
Mungbean Yellow
Mosaic Virus
(
MYMV
)
Jesmin Nahar Joly, Hosna Ara Chowdhury, Abdullah Ali Imtiaz, Fatema Begum,
Hasibur Rahman, Md. Belal Hossain
*Department of Plant Pathology, Sher-e-Bangla Agricultural University, Dhaka, Bangladesh
Abstract
Planting material BARI mungbean-5 and two phytochemicals viz. Imitaf, ac-tive ingredient imidacloprid and ACmix, acac-tive ingredient chloropyriphos (50%) + Cypermethrin (5%) were used in this experiment. In case of Imitaf, the lowest percent disease incidence (10.12% per plant and 3.51% per plot) and severity (7.21%) were recorded in four times spray (T4) at 70 DAS. The
highest percent disease incidence (36.50% per plant and 11.37% per plot) and severity (23.33%) were recorded in no spray (T0) at 70 DAS. In case of
AC-mix, the lowest percent disease incidence (12.21% per plant and 4.21% per plot) and severity (7.53%) were recorded in four times spray (T4) at 70 DAS.
The highest percent disease incidence (36.49% per plant and 11.37% per plot) and severity (36.67%) was recorded in T0 at 70 DAS. The highest number of
flower, no of pod and yield was found in four times spray (T4) that was higher
in Imitaf than ACmix. The highest chlorophyll content was recorded in four times spray (T4) for Imitaf (49.62 µmol∙m−2∙s−1) and ACmix (56.80
µmol∙m−2∙s−1), and the lowest chlorophyll content was recorded in T
0 for
Im-itaf (42.01 µmol∙m−2∙s−1) and ACmix (48.34 µmol∙m−2∙s−1). However from the
results of this experiment it was revealed that Imitaf gave the better perfor-mance to control the insect vector (Whitefly) of MYMV with four times spray.
Keywords
Mungbean, MYMV, Whitefly, Phytochemicals, Bangladesh
1. Introduction
Mungbean (Vigna radiata L.) remains under the family Fabaceae. This is an
How to cite this paper: Joly, J.N., Chowd-hury, H.A., Imtiaz, A.A., Begum, F., Rah-man, H. and Hossain, Md.B. (2019) Effica-cy of Less Toxic Phytochemicals to Prevent the Insect Vector of Mungbean Yellow Mosaic Virus (MYMV). American Journal of Plant Sciences, 10, 44-54.
https://doi.org/10.4236/ajps.2019.101005
Received: September 4, 2018 Accepted: January 6, 2019 Published: January 9, 2019
Copyright © 2019 by authors and Scientific Research Publishing Inc. This work is licensed under the Creative Commons Attribution International License (CC BY 4.0).
http://creativecommons.org/licenses/by/4.0/
Open Access
ancient, cheapest and conventional pulse crop in the world. Almost 90% of world’s mungbean production comes from Asia. Mungbean is also widely grown in Bangladesh. It is grown three times in a year covering 43,680 ha with an aver-age yield of 0.78 t/ha [1]. It contains high graded vegetable proteins and satis-factory level of minerals and vitamins. It also contains amino acids especially ly-sine which is generally deficit in cereal food grains [2]. According to World Health Organization (WHO), per capita per day requirement of pulse is 45 g. But in Bangladesh, only 12 g pulse is available per capita per day. About 6.01 million tons of pulse is required to meet the present per capita requirement of our country [3]. But the mungbean production has not considerably increased yet. The main cause for the low yield is the susceptibility of the crop to insects, weeds and diseases caused by virus, fungus or bacterium of which Mungbean yellow mosaic virus (MYMV) is one of the most prevalent and destructive viral pathogen in mungbean. MYMV is transmitted by white fly (Bemisia tabaci). To increase the production it is very important to reduce the virus infection and/or transmission by managing its vectors. We can manage the vector using several measures. We can manage the disease using resistant variety, by practicing crop rotation, implanting slush and burn process; maintain growing time and prop-erly intercultural operation. Besides these management practices, this devastat-ing viral disease can also be managed precisely by applydevastat-ing insecticides properly. Epidemiological factors play crucial role in the development of MYMV and white fly population. The proper time of application of insecticides could be helpful not only to manage whitefly and virus minimizing with the number of sprays. The study of epidemiological factors determined the most conducive en-vironment for the application of pesticides at right time, enhancing the yield of this crop. The prime aim of this study was to evaluate the selected phytochemi-cals viz. Imitaf, active ingredient imidacloprid and ACmix, active ingredient chloropyriphos (50%) + Cypermethrin (5%) for controlling the insect vectors with the minimum number sprays at the right time.
2. Materials and Methods
2.1. Experiment Location and Duration
The field experiment was conducted at the central Farm under the Department of Plant Pathology, Sher-e-Bangla Agricultural University, Dhaka-1207, Bangla-desh. The experiment was carried out during the period from March to June 2016.
2.2. Soil Type and Climatic Condition
The soil of the experimental plot belongs to the Tejgaon series under the Agro Ecological Zone, Madhupur Tract (AEZ-28) and the type soil shallow red brown terrace soil with pH 6.5 - 7.5. The experimental site has sub-tropical climatic condition characterized by high temperature, heavy rainfall during May to Sep-tember and scanty rainfall during rest of the year.
2.3. Collection of Planting Materials and Phytochemicals
BARI Mungbean-5 a variety of Mungbean was collected from Bangladesh Agri-cultural Research Institute (BARI), Joydebpur, Gazipur, Bangladesh. The selected phytochemicals namely Im itaf and ACmix were collected from local market.
2.4. Design and Layout of the Experiment
The experiment was laid out in a Randomized Complete Block Design (RCBD) with three replications and two blocks as “Imitaf” and “ACmix”. There were seven treatments including a control treatment and 21 (3 × 7) unit plots were laid for each of the block. The size of each unit plot was 3 m2 (3 m × 1 m) and
plot to plot distance was 0.5 m.
2.5. Treatments of the Experiment
Treatments of the experiment were as follows: T0 = Control/No spray
T1 = One time spray (at 30 DAS)
T2 = Two time spray (at 30, 35 DAS)
T3 = Three time spray (at 30, 35 and 40 DAS)
T4 = Four time spray (at 30, 35 40 and 45 DAS)
T5 = Five time spray (at 30, 35 40, 45 and 50 DAS)
T6 = Six time spray (at 30, 35 40, 45 50 and 55 DAS)
2.6. Land Preparation and Fertilizer Application
The selected experimental plot was ploughed by power tiller driven rotavator. Finally, the land was leveled and the experimental plot was partitioned equally into the unit plots. Well decomposed cowdung was applied during land prepara-tion. The Triple super phosphate (TSP) and Muriate of potash (MOP) were also applied at final land preparation @ 50 kg/ha and 35 kg/ha respectively. No urea fertilizer was used during the land preparation and as top dressing.
2.7. Sowing of Seeds
Seeds were sown in the main field on 14 March 2016 maintaining line to line distance 30 cm and plant to plant distance 10 cm for better plant growth. Seed-ing rate was 20 kg/ha of land.
2.8. Management Practices
Several intercultural operations such as thinning of plants, Gap filling, mulching and irrigation were practiced as per necessity to keep the plants healthy. Weed-ing was done to keep the plots free from weeds and stagnant water was effective-ly drained out at the time of heavy rains.
2.9. Spraying of Phytochemicals
First spray was started 30 days after sowing (DAS) and other spray was continued
at 5 days after interval upto 55 DAS. The phytochemicals (Imitaf and ACmix) spraying rate was 0.5 ml/L and 1.5 ml/L respectively.
2.10. Parameters Assessed
The following parameters were assessed:
− Number of plants per plot
− Number of infected plants per plot
− Number of leaves per infected plant
− Number of infected leaves per infected plant
− Disease incidence (%) per plot and per plant
− Disease severity (%)
− Number of flower per plant
− Number of pod per plant
− Chlorophyll content
− Yield/plot
All parameter were recorded from each plot at 50, 60 and 70 days after sowing (DAS). For measurement the number of leaves per infected plant, infected leaves per infected plant, flower per plant, pod per plant and chlorophyll content, in total ten (10) plants were randomly selected.
2.11. Disease Incidence (%) and Disease Severity (%)
Disease incidence was defined as the number of plant units sampled that are diseased expressed as a percentage or proportion of the total number of units assessed. For measurement the disease incidence (%) per plant, in total ten (10) plants were randomly selected and then data were collected on the basis of total number of leaf infected.
( )
1Disease incidence % X 100 X
= ×
where,
X = Total number of plants assessed/total number of leaves assessed.
X1 = Number of infected plants/leaves.
Disease severity was defined as the area of a sampling unit affected by disease, expressed as a percentage or proportion of the total area assessed. Data on mo-saic disease severity (%) were recorded at an interval of 10 days commencing from first severity and continued up to 3 times.
( )
1Disease Severity % X 100 X
= ×
where,
X1 = Leaf area infected
X = Total leaf area assessed
2.12. Chlorophyll Content in Leaves Per Plant
Chlorophyll content of leaf was measured by using “S-pad meter”. From each
plot five plant was selected in each plant 3 leafs were selected randomly for chlorophyll content. Lower leaf, middle leaf and top leaf were measured to de-fine the average chlorophyll content of the plant.
2.13. Statistical Analysis
The collected data were arranged in a excel sheet and then was statistically ana-lyzed by using the computer based software MSTAT-c. The mean data was cal-culated through ANOVA at 1% level of significant.
3. Results and Discussion
3.1. Effect of Imitaf on Percent Disease Incidence and Severity of
Mungbean Yellow Mosaic Virus
(
MYMV
)
at 50, 60 and 70 DAS
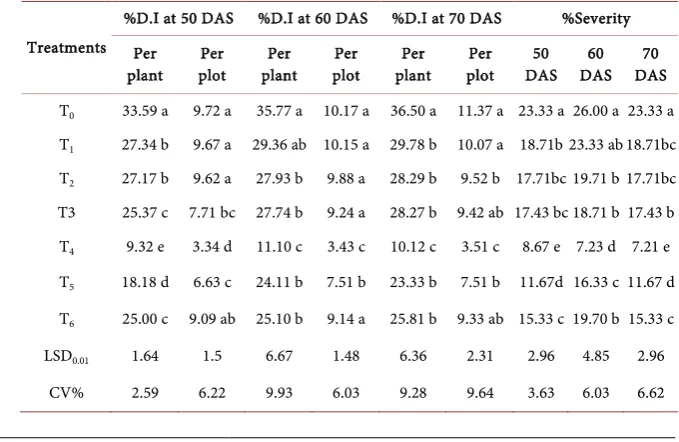
After the application of Imitaf up to six times spray, at 50 DAS the lowest disease incidence per plant was found in T4 (9.32%) followed by T5 (18.18%). The
high-est disease incidence per plant in T3 (25.37%) is statistically similar with T6
(25.00%). The lowest disease incidence per plot was also found in T4 (3.34%) and
followed by T5 (6.63%). The highest disease incidence was observed in control
treatment (T0 = 33.59%). The moderate disease incidence per plant was observed
per plot was observed in T0 (9.72%) which is statistically similar with T1 (9.67%)
and T2 (9.62%) and identical with T6 (15.33%). The moderate disease incidence
was found in T3 (27.17%).
In case of disease severity at 50 DAS after the application of Imitaf, the lowest disease incidence was measured in T4 (8.67%) and followed by T5 (11.67%) and
the lowest disease severity was measured in T0 (23.33%) which is statistically
identical with T1 (18.71%). After the application of Imitaf up to six times at 60
DAS, the lowest disease incidence per plant was found in T4 (11.10%) and
fol-lowed by T5 (24.11%). The highest disease incidence per plant was recorded in
control (T0 = 35.77%), which is statistically similar with T6 (25.10%) and T2
(27.93%). The lowest disease incidence per plot was also found in T4 (3.43%) and
followed by T5 (7.51%). The highest disease incidence per plot was observed in
case of control (T0 = 10.17%) which is statistically similar with T1 (10.15%), T2
(9.88%), T6 (9.14%).
In case of disease severity at 60 DAS after application of Imitaf, the lowest disease severity was found in T4 (7.23%) and following T5 (16.33%), the highest
disease severity was recorded in control (T0 = 26.00%), the moderate disease
se-verity per plant was found in T2 (19.71%). After the application of Imitaf up to
six times at 70 DAS, the lowest disease incidence per plant was found in T4
(10.12%) and followed by T5 (23.33%). The highest disease incidence per plant
was recorded in control (T0 = 36.50%), the moderate disease incidence per plant
was found in T2 (28.29%). The lowest disease incidence per plot was also found
in T4 (3.51%) and followed by T5 (7.51%). The highest disease incidence per plot
was observed in case of control (T0 = 11.37%) and followed by T1 (10.07%)
which is statistically similar with T2 (9.52%) and T3 (9.42%). In case of disease
severity at 70 DAS after application of Imitaf the lowest disease severity was found in T4 (7.21%) and followed by T5 (11.67). The highest disease severity was
recorded in control (T0 = 23.33%). These results are presented in Table 1.
3.2. Effect of ACmix on Disease Incidence (Per Plant and Per Plot)
and Disease Severity of
MYMV
at 50, 60, 70 DAS
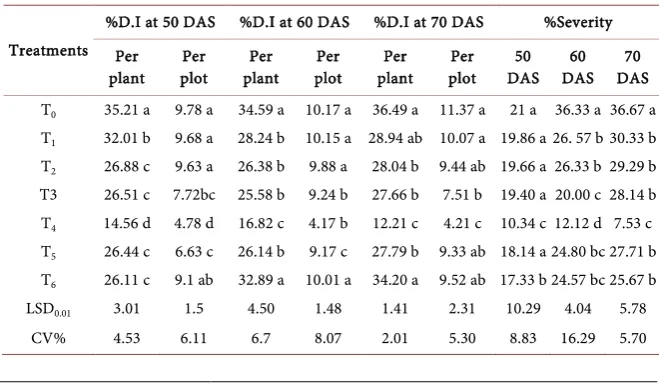
After the application of ACmix up to six times at 50 DAS, the lowest disease in-cidence per plant was found in T4 (14.56%) and followed by T5 (26.44%). The
highest disease incidence per plant was recorded in control (T0 = 5.21%), which
is statistically identical with T1 (32.015%). The lowest disease incidence per plot
was also observed in T4 (4.78%) and followed by T5 (6.63%). The highest disease
incidence per plot was observed in case of control (T0 = 9.78%) which is
statisti-cally similar with T1 (9.68%) and statistically identical with T6 (9.1%).
In case of disease severity at 50 DAS after application of ACmix the lowest disease severity was found in T4 (10.34%) and followed by T6 (17.33%). The
highest disease severity was recorded in control (T0 = 21%), which is statistically
similar with T1 (19.86%). After the application of ACmix up to six times at 60
DAS, the lowest disease incidence per plant was found in T4 (16.82%) and
fol-lowed by T5 (26.14%). The highest disease incidence per plant was recorded in
control (T0 = 34.59%), which is statistically similar with T6 (32.89%) and
statis-tically identical with T1 (28.24%). The lowest disease incidence per plot was also
found in T4 (4.17%) and followed by T5 (9.17%). The highest disease incidence
per plot was observed in case of control (T0 = 10.17%) which is statistically
simi-lar with T1 (10.15%).
In case of disease severity at 60 DAS after application of ACmix the lowest disease severity was found in T4 (12.12%) and followed by T5 (24.80%). The
[image:6.595.199.539.519.740.2]highest disease severity was recorded in control (T0 = 36.33%). The moderate
Table 1. Effect of Imitaf on disease incidence (D.I/plant and D.I/plot) and disease severity at 50, 60, 70 DAS in designed treatments.
Treatments
%D.I at 50 DAS %D.I at 60 DAS %D.I at 70 DAS %Severity
Per
plant plot Per plant Per plot Per plant Per plot Per DAS 50 DAS 60 DAS 70
T0 33.59 a 9.72 a 35.77 a 10.17 a 36.50 a 11.37 a 23.33 a 26.00 a 23.33 a
T1 27.34 b 9.67 a 29.36 ab 10.15 a 29.78 b 10.07 a 18.71b 23.33 ab 18.71bc
T2 27.17 b 9.62 a 27.93 b 9.88 a 28.29 b 9.52 b 17.71bc 19.71 b 17.71bc
T3 25.37 c 7.71 bc 27.74 b 9.24 a 28.27 b 9.42 ab 17.43 bc 18.71 b 17.43 b
T4 9.32 e 3.34 d 11.10 c 3.43 c 10.12 c 3.51 c 8.67 e 7.23 d 7.21 e
T5 18.18 d 6.63 c 24.11 b 7.51 b 23.33 b 7.51 b 11.67d 16.33 c 11.67 d
T6 25.00 c 9.09 ab 25.10 b 9.14 a 25.81 b 9.33 ab 15.33 c 19.70 b 15.33 c
LSD0.01 1.64 1.5 6.67 1.48 6.36 2.31 2.96 4.85 2.96
CV% 2.59 6.22 9.93 6.03 9.28 9.64 3.63 6.03 6.62
disease severity per plant was found in T3 (20.00%) which is identical with T6
(24.57%). After the application of ACmix up to six times at 70 DAS, the lowest disease incidence per plant was found in T4 (12.21%) and followed by T5
(27.79%). The highest disease incidence per plant was recorded in control (T0 =
34.49%), The moderate disease incidence per plant was found in The lowest dis-ease incidence per plot was also found in T4 (4.21%) and followed by T3
(7.51%).The highest disease incidence per plot was observed in case of control (T0 = 11.37%) which is statistically similar with T1 (10.07%), and identical with
T2 (9.44%).
In case of disease severity at 70 DAS after application of ACmix the lowest disease severity was measured in T4 (7.53%) and followed by T6 (25.67). The
highest disease severity was recorded in control (T0 = 36.67%) and followed by
T1 (30.33%). These results are presented in Table 2.
Disease incidence for both per plant and per plot was recorded the lowest in case of insecticide Imitaf in T4 and similarly for the ACmix in T4. The highest
disease incidence was recorded in T0 or in no spray for both insecticides. In case
of disease severity for both Imitaf and ACmix was recorded the lowest in T4 and
the highest in control T0.. Almost same result was found in the previous work [4] [5] and they also found better result while used Imitaf against MYMV in their study.
3.3. Chlorophyll Content in Different Treatment for Both Imitaf
and ACmix
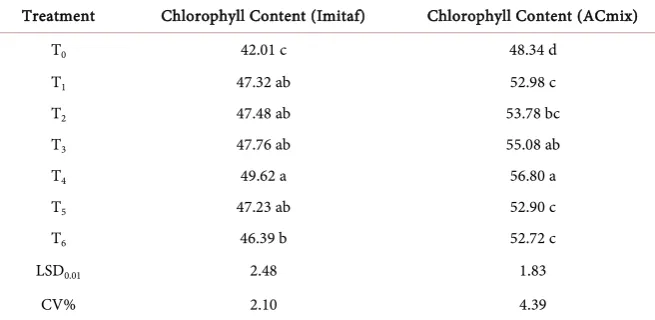
Chlorophyll content in different treatment for both the insecticides are pre-sented in Table 3. The lowest amount of chlorophyll content was found for both the insecticides for the control in case of Imitaf it is (42.01 µmol∙m−2∙s−1) and for
the ACmix it is (48.34 µmol∙m−2∙s−1). The highest amount of chlorophyll content
was found for the Imitaf in T4 (49.62 µmol∙m−2∙s−1) and thus for the ACmix in
[image:7.595.208.538.547.741.2]T4 (56.80 µmol∙m−2∙s−1).
Table 2. Effect of ACmix on disease incidence (D.I/plant and D.I/plot) and disease sever-ity at 50, 60, 70 DAS in designed treatments.
Treatments
%D.I at 50 DAS %D.I at 60 DAS %D.I at 70 DAS %Severity
Per
plant plot Per plant Per plot Per plant Per plot Per DAS 50 DAS 60 DAS 70
T0 35.21 a 9.78 a 34.59 a 10.17 a 36.49 a 11.37 a 21 a 36.33 a 36.67 a
T1 32.01 b 9.68 a 28.24 b 10.15 a 28.94 ab 10.07 a 19.86 a 26. 57 b 30.33 b
T2 26.88 c 9.63 a 26.38 b 9.88 a 28.04 b 9.44 ab 19.66 a 26.33 b 29.29 b
T3 26.51 c 7.72bc 25.58 b 9.24 b 27.66 b 7.51 b 19.40 a 20.00 c 28.14 b
T4 14.56 d 4.78 d 16.82 c 4.17 b 12.21 c 4.21 c 10.34 c 12.12 d 7.53 c
T5 26.44 c 6.63 c 26.14 b 9.17 c 27.79 b 9.33 ab 18.14 a 24.80 bc 27.71 b
T6 26.11 c 9.1 ab 32.89 a 10.01 a 34.20 a 9.52 ab 17.33 b 24.57 bc 25.67 b
LSD0.01 3.01 1.5 4.50 1.48 1.41 2.31 10.29 4.04 5.78
CV% 4.53 6.11 6.7 8.07 2.01 5.30 8.83 16.29 5.70
Table 3. Chlorophyll content in different treatment for both Imitaf and ACmix.
Treatment Chlorophyll Content (Imitaf) Chlorophyll Content (ACmix)
T0 42.01 c 48.34 d
T1 47.32 ab 52.98 c
T2 47.48 ab 53.78 bc
T3 47.76 ab 55.08 ab
T4 49.62 a 56.80 a
T5 47.23 ab 52.90 c
T6 46.39 b 52.72 c
LSD0.01 2.48 1.83
CV% 2.10 4.39
3.4. Relationship between Chlorophyll Content in Imitaf Treated
Plants and Disease Incidence at 70 DAS (Figure 1)
Two selective insecticides with different number of spray in different plot were used in the present study regarding chlorophyll content (µmol∙m−2∙s−1) and
dis-ease incidence (%), it is revealed that incrdis-eased chlorophyll content was observed with decreased disease incidence. The highest chlorophyll content was observed in T4 (49.67 µmol∙m−2∙s−1) followed by T3 (47.76 µmol∙m−2∙s−1) and T2 (46.48
µmol∙m−2∙s−1) where control treatment showed the lowest chlorophyll content
with the highest disease incidence. The relation of chlorophyll content with the disease incidence at 70 DAS per plot was shown below by the bar-graph.
3.5. Relationship between Chlorophyll Content in ACmix Treated
Plants and Disease Incidence at 70 DAS (Figure 2)
The highest chlorophyll content was observed in T4 (56.80 µmol∙m−2∙s−1)
fol-lowed by T3 (55.08 µmol∙m−2∙s−1) and T2 (53.78 µmol∙m−2∙s−1) where control
treatment showed the lowest chlorophyll content with the highest disease inci-dence. The relation of chlorophyll content with the disease incidence at 70 DAS per plot was shown below by the bar-graph.
3.6. Relationship between Chlorophyll Content in Imitaf and
ACmix Treated Plants and Disease Severity at 70 DAS
(Figure 3)
The highest chlorophyll content was observed in T4 (49.67 µmol∙m−2∙s−1)
fol-lowed by T3 (47.76 µmol∙m−2∙s−1) and T2 (46.48 µmol∙m−2∙s−1) where control
treatment showed the lowest chlorophyll content with the highest disease sever-ity. The relation of chlorophyll content with the disease incidence at 70 DAS per plot was shown below by the bar-graph.
3.7. Relationship between Chlorophyll Content in ACmix Treated
Plants and Disease Severity at 70 DAS (Figure 4)
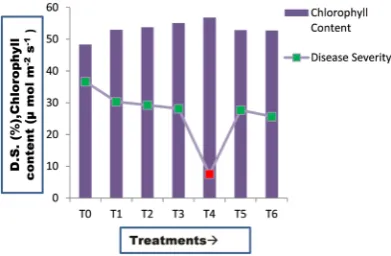
The highest chlorophyll content was observed in T4 (56.80 µmol∙m−2∙s−1)
Figure 1. Relationship between chlorophyll content in Imitaf treated plants and disease incidence at 70 DAS.
Figure 2. Relationship between chlorophyll content in ACmix treated plants and disease incidence at 70 DAS.
Figure 3. Relationship between chlorophyll content in Imitaf treated plants and disease severity at 70 DAS.
Figure 4. Relationship between chlorophyll content in ACmix treated plants and disease severity at 70 DAS.
[image:9.595.275.471.408.521.2] [image:9.595.275.471.566.694.2]followed by T3 (55.08 µmol∙m−2∙s−1) and T2 (53.78 µmol∙m−2∙s−1) where control
treatment showed the lowest chlorophyll content with the highest disease severity. From this study it was cleared that the minimum chlorophyll content per plant was recorded in control and the maximum chlorophyll content per plant was recorded when Imitaf was sprayed four times than spraying ACmix. Babu et al. [6] reported through his experiment that infection of Vigna radiata plants by
MYMV caused significant reduction in number of pods/plant, seed yield and 100-seed weight. The highest chlorophyll content was found in T4 and control
treatment showed the lowest chlorophyll content because of the highest disease incidence. Here the Relationship between chlorophyll content (µmol∙m−2∙s−1) and
disease severity (%) is revealed that increased chlorophyll content was observed with decreased disease severity. The highest chlorophyll content was found in T4
where control treatment showed lowest chlorophyll content because of highest disease severity.
4. Conclusion
In this experiment, the highest disease incidence was found in control at 50 DAS, 60 DAS and thus in case of 70 DAS for both of the insecticides Imidacloprid (33.59%, 35.77%, 36.50%) per plant as well (9.72%, 10.17%, 11.37%) per plot and ACmix (35.21%, 34.59%, 36.49%) per plant as well (9.78%, 10.17%, 11.37%) per plot. The lowest disease incidence and disease severity were found in T4 at 50
DAS, 60 DAS and 70 DAS for both of the insecticides Imidacloprid (23.33%, 26.00%, 23.33%) and ACmix (21%, 36.33%, 36.67%). In case of chlorophyll con-tent, the lowest amount of chlorophyll was observed in control Imidacloprid (42.01 µmol∙m−2∙s−1) and ACmix (48.34 µmol∙m−2∙s−1) with the highest disease
incidence and disease severity and the highest amount of chlorophyll was found in T4 Imidacloprid (49.62 µmol∙m−2∙s−1) and ACmix (56.80 µmol∙m−2∙s−1) with
the lowest amount of disease incidence and disease severity for both the cides. From this experiment, it may be conducted that the application of insecti-cides Imidachloprid with 4 time spraying showed promising performance in management of Mungbean Yellow Mosaic Virus (MYMV) contributing attributes and yield.
Conflicts of Interest
The authors declare no conflicts of interest regarding the publication of this pa-per.
References
[1] BBS (2010) Bangladesh Bureau of Statistics, Statistical Yearbook of Bangladesh, Sta-tistics Division, Ministry of Planning, GOB.
[2] Elias, S. M., Hossain, M.S., Sikder, F.S., Ahmed, J. and Karim, M.R. (1986) Identifi-cation of Constraints to Pulse Production with Special Reference to Present Farm-ing Systems. Annual Report of the Agricultural Economics Division, BARI, Joy-debpur, p-1.
[3] BARI (Bangladesh Agricultural Research Institute) (1998) Bangladesh-e Moog Da-ler Chash (in Bangla)-Mungbean Cultivation in Bangladesh. Pulse Res. Sta., Ban-gladesh Agril. Res. Inst., Joydebpur, Gazipur, 45.
[4] Islam, M.S. and Hossain, M.B. (2016) Management of Mungbean Yellow mosaic Virus (MYMV) through Peak Performance Neutrient (PPN) and Some Selected In-secticides. M.S Thesis, Sher-e-Bangla Agricultural University, Dhaka.
[5] Madhuban, G., Mukherjee, I. and Srivastava, K.P. (1997) Efficacy of Imidacloprid and Its Comparison with Other Insecticides for Controlling Whitefly in Pulses.
Annals of Plant Protection Science, 5, 29-33.
[6] Babu, R.C., Rathinaswamy, R. and Srinivasan, P.S. (1984) Certain Physiological Changes in Green Gram Plants Infected by Mungbean Yellow Mosaic Virus. Ma-dras Agricultural Journal, 71, 795-798.