ISSN Online: 1942-0749 ISSN Print: 1942-0730
DOI: 10.4236/jemaa.2017.911014 Nov. 23, 2017 155 Journal of Electromagnetic Analysis and Applications
Analysis of Behaviour Pattern in
Sprague-Dawley Rats Using Microwave
Techniques
Anil Lonappan
1*, Ernest Remy Hervé Ebell’a Dallé
2, Thomas Joachim Odhiambo Afullo
3,
Williams Mark Uren Daniels
21Department of Electrical Engineering, Mangosuthu University of Technology, Durban, South Africa
2College of Health Sciences, School of Laboratory Medicine and Medical Sciences, University of KwaZulu-Natal, Durban,
South Africa
3School of Electrical Electronic and Computer Engineering, Howard College, University of KwaZulu-Natal, Durban, South Africa
Abstract
This communication presents a new method of detecting the behaviour pat-tern in Sprague-Dawley (SD) rats based on the measurement of the dielectric properties of blood plasma at microwave frequencies at different periods of time. The microwave measurements were performed by rectangular cavity perturbation method in the S-band of microwave frequency with the blood plasma collected from normal rats (Controls) as well as chemically induced rats (Aβ). A change is observed in the dielectric properties of the Aβ samples but not the controls samples at the extended period of time. This measure-ment technique is simple and the collection of blood from the rats is nonsur-gical in nature. These results prove a new method of diagnosing Alzheimer’s Disease (AD) using microwave techniques.
Keywords
Blood Plasma, Sprague-Dawley Rats, Cavity Perturbation, Alzheimer’s Disease
1. Introduction
Alzheimer’s Disease, (AD) is the most common form of dementia with no cure at the moment. It worsens as it progresses, and eventually leads to death. The concept of senile dementia has evolved from a rather vague notion that mental decline occurred inevitably in old age, to become defined today by a distinct set of clinical and pathological features with the potential for treatment and preven-How to cite this paper: Lonappan, A.,
Dallé, E.R.H.E., Afullo, T.J.O. and Daniels, W.M.U. (2017) Analysis of Behaviour Pat-tern in Sprague-Dawley Rats Using Micro-wave Techniques. Journal of Electromag-netic Analysis and Applications, 9, 155-166.
https://doi.org/10.4236/jemaa.2017.911014
Received: August 16, 2017 Accepted: November 20, 2017 Published: November 23, 2017
Copyright © 2017 by authors and Scientific Research Publishing Inc. This work is licensed under the Creative Commons Attribution International License (CC BY 4.0).
http://creativecommons.org/licenses/by/4.0/
DOI: 10.4236/jemaa.2017.911014 156 Journal of Electromagnetic Analysis and Applications tion within grasp [1]. Alzheimer’s Disease (AD) is diagnosed in people over 65 years of age although the less-prevalent early-onset AD can occur much earlier. Modern advances in therapeutic and preventive strategies that lead to even small delays in the onset and progression of Alzheimer’s Disease can significantly re-duce the global burden of this disease [2][3].
The microwave technology is often used in various diagnostic and therapeutic applications in medicine [4]. Dielectric properties of various human tissues and body fluids are studied and reported at different RF frequencies [5][6][7]. Var-ious measurement methods are used to measure the complex permittivity of a material and the method of choice depends on factors like the nature of the samples under study and the frequency range used [8][9][10][11]. When only very small volumes of the sample are available, the cavity perturbation technique is an attractive option as it requires only minute volumes for the measurement
[12]. This makes it suitable for the dielectric study of blood plasma, as only very small volumes can be extracted from the Sprague-Dawley rats. However, no data is currently available for the complex permittivity of blood plasma of Spra-gue-Dawley rats in the literature. In this study the rectangular cavity perturba-tion technique has been employed for the measurement of the dielectric proper-ties of blood plasma obtained from normal rats (Controls) as well as chemically induced rats (Aβ samples) in the frequency range 2 to 4 GHz. It is observed that an appreciable a change in the dielectric properties of Aβ samples than the con-trols samples at the extended period of time. This microwave measurement pro-cedure as well as the extraction of blood plasma from Sprague-Dawley rats is simple and nonsurgical in nature. These results prove a new method of diagnos-ing Alzheimer’s Disease usdiagnos-ing microwave diagnostic procedures.
2. Sample Preparation
The study was conducted on Sprague-Dawley (SD) rats, weighing between 300 - 350 g (8/9 weeks of age). The animals were randomly divided into 4 groups upon arrival and housed with two animals/cage under standard lighting conditions of 12 hour light/dark cycles of protocol [13]. They were given 7 days to acclimatize to the new environment before the experiments were conducted. They were given ad libitum and bedding was changed at least two times a week.
behavior-DOI: 10.4236/jemaa.2017.911014 157 Journal of Electromagnetic Analysis and Applications al in the same MWM to assess any impairment in the recall ability caused by the neurotoxin. The animals were sacrificed 3, 7, 10 and 14 days following in-tra-cerebral injections by Halothane overdose. Blood was collected by cardiac puncture into heparin blood tubes, centrifuged at 3500 rpm for 10 minutes, and plasma was collected in eppendorfs, snap frozen by liquid nitrogen and stored at −80˚C. The blood plasma was then filled into capillary bulb for microwave measurements.
3. Material and Methods
The experimental set-up consists of a transmission type S-band rectangular cav-ity resonator, Rohde & Schwarz ZVL network analyser. The cavcav-ity resonator is a transmission line with one or both ends closed. The numbers of resonant fre-quencies are determined by the length of the resonator. The resonator in this set-up is excited in the TE10ρ mode. The sample holder which is made of glass in the form of a capillary tube flared to a disk shaped bulb at the bottom is placed into the cavity through the non-radiating cavity slot, at broader side of the cavity which can facilitate the easy movement of the holder. The resonant frequency fo and the corresponding quality factor Qo of the cavity at each resonant peak with the empty sample holder placed at the maximum electric field are noted. The same holder filled with known amount of sample under study is again intro-duced into the cavity resonator through the non-radiating slot. The resonant frequencies of the sample loaded cavity is selected and the position of the sample is adjusted for maximum perturbation (i.e. maximum shift of resonant fre-quency with minimum amplitude for the peak). The new resonant frefre-quency fs and the quality factor Qs are noted. The same procedure is repeated for other resonant frequencies. The measurement are made from 2 GHz to 4 GHz of S-band in microwave region [14].
4. Theory
When a material is introduced into a resonant cavity, the cavity field distribution and resonant frequency are changed which depend on shape, electromagnetic properties and its position in the fields of the cavity. Dielectric material interacts only with electric field in the cavity.
According to the theory of cavity perturbation, the complex frequency shift is related as [14]:
( )
*0
2 0
1 d
d
2 d
s
c r
V
V
E E V
E V
ε
− ⋅Ω
− ≈
Ω
∫
∫
(1)But
0
d d 1 1
2 s
j
Q Q
ω ω
Ω
≈ + −
Ω (2)
DOI: 10.4236/jemaa.2017.911014 158 Journal of Electromagnetic Analysis and Applications 1
2
o s c
r
s s
f f V
f V
ε′ − = −
(3)
4
c o s
r
s o s
V Q Q
V Q Q
ε′′ = −
(4) Here, εr =εr′− jεr′′, εr is the relative complex permittivity of the sample,
r
ε ′ is the real part of the relative complex permittivity, which is known as di-electric constant. ε ′′r is the imaginary part of the relative complex permittivity associated with the dielectric loss of the material. Vs and Vc are corresponding volumes of the sample and the cavity resonator. The conductivity can be related to the imaginary part of the complex dielectric constant as
0 2π
e f r
σ =ωε′′= ε ε′′ (5)
5. Results and Discussion
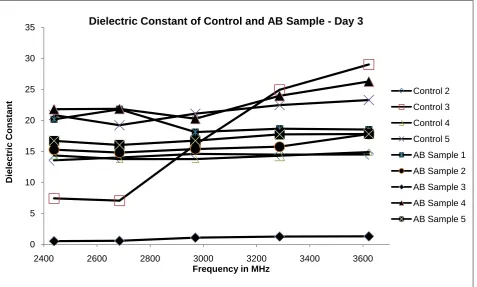
The microwave experiment in blood plasma was done using cavity perturbation technique collected from normal rats (Controls) as well as chemically induced rats (Aβ samples) and the results are shown in Figures 1-16. The Figures 1-4
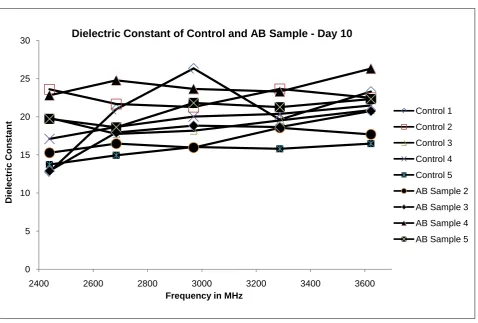
[image:4.595.62.540.418.705.2]shows the dielectric values and the corresponding Figures 9-12 shows the aver-age values of the dielectric constant. From Figures 1-3 it is noticed that the con-trols as well as Aβ samples exhibit similar ranges of dielectric constant. This shows that dielectric constant of controls and Aβ samples from day 3, day 7 and day 10 have almost same values. This is quite evident from the average value
Figure 1. Variation of dielectric constant in control and Aβ samples after 3 days.
0 5 10 15 20 25 30 35
2400 2600 2800 3000 3200 3400 3600
D
iel
ect
ri
c C
o
n
st
an
t
Frequency in MHz
Dielectric Constant of Control and AB Sample - Day 3
DOI: 10.4236/jemaa.2017.911014 159 Journal of Electromagnetic Analysis and Applications
Figure 2. Variation of dielectric constant in control and Aβ samples after 7 days.
Figure 3. Variation of dielectric constant in control and Aβ samples after 10 days.
0 5 10 15 20 25 30 35
2400 2600 2800 3000 3200 3400 3600
D
iel
ect
ri
c C
o
n
st
an
t
Frequency in MHz
Dielectric Constant of Control and AB Sample - Day 7
Control 1 Control 2 Control 3 Control 4 Control 5 AB Sample 1 AB Sample 2 AB Sample 3 AB Sample 4 AB Sample 5
0 5 10 15 20 25 30
2400 2600 2800 3000 3200 3400 3600
D
iel
ect
ri
c C
o
n
st
an
t
Frequency in MHz
Dielectric Constant of Control and AB Sample - Day 10
[image:5.595.60.539.388.711.2]DOI: 10.4236/jemaa.2017.911014 160 Journal of Electromagnetic Analysis and Applications
Figure 4. Variation of dielectric constant in control and Aβ samples after 14 days.
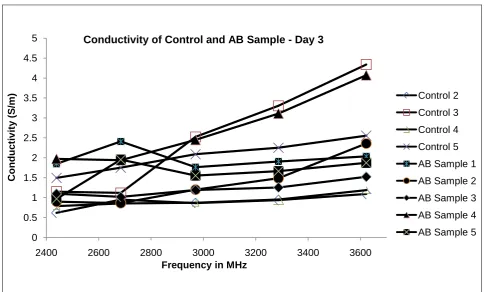
Figure 5. Variation of conductivities in control and Aβ samples after 3 days.
0 5 10 15 20 25 30 35 40
2400 2600 2800 3000 3200 3400 3600
D
iel
ect
ri
c C
o
n
st
an
t
Frequency in MHz
Dielectric Constant of Control and AB Sample - Day 14
Control 1 Control 2 Control 3 Control 4 Control 5 AB Sample 1 AB Sample 2 AB Sample 3 AB Sample 4 AB Sample 5
0 0.5 1 1.5 2 2.5 3 3.5 4 4.5 5
2400 2600 2800 3000 3200 3400 3600
C
o
n
d
u
c
ti
v
ity
(S
/m
)
Frequency in MHz
Conductivity of Control and AB Sample - Day 3
DOI: 10.4236/jemaa.2017.911014 161 Journal of Electromagnetic Analysis and Applications
Figure 6. Variation of conductivities in control and Aβ samples after 7 days.
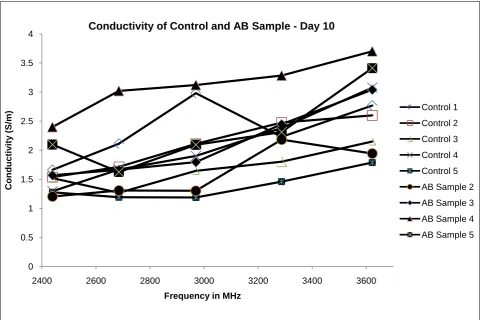
Figure 7. Variation of conductivities in control and Aβ samples after 10 days.
0 1 2 3 4 5 6
2400 2600 2800 3000 3200 3400 3600
C
o
n
d
u
c
ti
v
ity
(S/
m
)
Frequency in MHz
Conductivity of Control and AB Sample - Day 7
Control 1 Control 2 Control 3 Control 4 Control 5 AB Sample 1 AB Sample 2 AB Sample 3 AB Sample 4 AB Sample 5
0 0.5 1 1.5 2 2.5 3 3.5 4
2400 2600 2800 3000 3200 3400 3600
C
o
n
d
u
c
ti
v
ity
(S/
m
)
Frequency in MHz
Conductivity of Control and AB Sample - Day 10
[image:7.595.57.540.383.703.2]DOI: 10.4236/jemaa.2017.911014 162 Journal of Electromagnetic Analysis and Applications
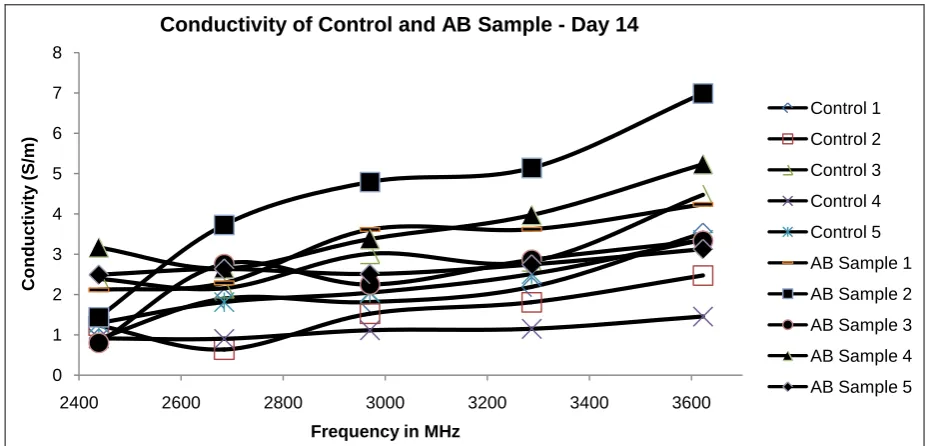
Figure 8. Variation of conductivities in control and Aβ samples after 14 days.
3 days dielectric constant
0 10 20 30
Controls Aβ samples
3622.067 3286.685 2969.675 2684.517 2438.763 2400
Frequency (MHz)
d
ie
lect
ri
c co
n
st
an
[image:8.595.239.511.323.490.2]t
Figure 9. Variation of the average dielectric constant of controls and Aβ samples after 3-days.
7 days dielectric constant
0 10 20 30 40
Controls Aβ samples
2400 2438.7632684.517 2969.6753286.6853622.067
Frequency (MHz)
d
ie
lect
ri
c co
n
st
an
t
Figure 10. Variation of the average dielectric constant of controls and Aβ samples after 7-days.
0 1 2 3 4 5 6 7 8
2400 2600 2800 3000 3200 3400 3600
C
o
n
d
u
c
ti
v
ity
(S/
m
)
Frequency in MHz
Conductivity of Control and AB Sample - Day 14
[image:8.595.237.509.534.693.2]DOI: 10.4236/jemaa.2017.911014 163 Journal of Electromagnetic Analysis and Applications
10 days dielectric constant
0 10 20 30
Controls Aβ samples
2400 2438.7632684.5172969.675 3286.6853622.067
Frequency (MHz)
d
ie
lect
ri
c co
n
st
an
[image:9.595.222.530.69.252.2]t
Figure 11. Variation of the average dielectric constant of controls and Aβ samples after 10-days.
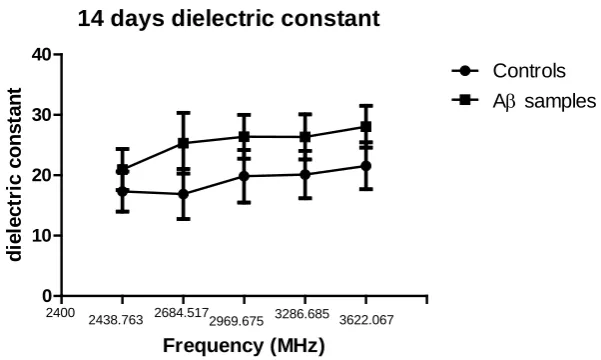
14 days dielectric constant
0 10 20 30 40
Controls Aβ samples
2400 2438.763 2684.517
2969.675 3286.685 3622.067
Frequency (MHz)
d
ie
lect
ri
c co
n
st
an
t
Figure 12. Variation of the average dielectric constant of controls and Aβ samples after 14-days.
results dielectric constants shown in the Figures 9-11. From Figure 4 as well as
Figure 12, Aβ samples exhibit a higher dielectric constant than that the controls. This implies that dielectric constant in Aβ samples is higher than the controls after day 14 and is due to the change in the behaviour of samples attributed by Alzheimer’s Disease. The Figures 5-8 shows the conductivity values and the corresponding Figures 13-16 shows the average values of the conductivities.
Figure 5 to Figure 6 show the variation of conductivity of blood plasma of con-trol and Aβ samples and its values are practically similar. The average values of conductivities during same period is shown in Figure 13 and Figure 14. From
[image:9.595.222.523.292.472.2]DOI: 10.4236/jemaa.2017.911014 164 Journal of Electromagnetic Analysis and Applications
3 days conductivity
0 1 2 3 4 5
Controls Aβ samples
3622.067 3286.685 2969.675 2684.517 2438.763 2400
Frequency (MHz)
co
n
d
u
ct
ivi
[image:10.595.219.509.70.257.2]ty
Figure 13. Variation of the average conductivity of controls and Aβ samples after 3-days.
7 days conductivity
0 2 4 6
Controls Aβ samples
2400 2438.7632684.517 2969.6753286.6853622.067
Frequency (MHz)
co
n
d
u
ct
ivi
[image:10.595.222.462.292.476.2]ty
Figure 14. Variation of the average conductivity of controls and Aβ samples after 7-days.
10 days conductivity
0 1 2 3 4
Controls Aβ samples
3622.067 3286.685 2969.675 2684.517 2438.763 2400
Frequency (MHz)
co
n
d
u
ct
ivi
ty
Figure 15. Variation of the average conductivity of controls and Aβ samples after
[image:10.595.220.520.511.692.2]DOI: 10.4236/jemaa.2017.911014 165 Journal of Electromagnetic Analysis and Applications
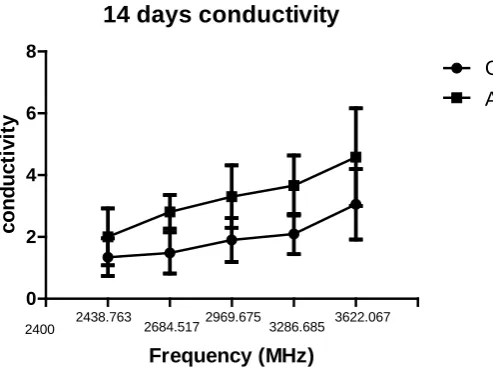
14 days conductivity
0 2 4 6 8
Controls Aβ samples
2400 2438.763 2684.5172969.675 3286.685 3622.067
Frequency (MHz)
co
n
d
u
ct
ivi
[image:11.595.225.472.70.256.2]ty
Figure 16. Variation of the average conductivity of controls and Aβ samples after
14-days.
microwave (ISM band), controls and Aβ samples of blood plasma of Spra-gue-Dawley rats were studied and exhibit distinct variation of dielectric constant and conductivity after 14 days.
6. Conclusion
The microwave characterization has been performed in the blood plasma ob-tained from normal rats (Controls) as well as chemically induced rats (Aβ sam-ples) using the cavity perturbation technique. The cavity perturbation technique is quick, simple, and accurate and it requires very low volume of sample for measuring the dielectric properties of samples like blood plasma. It is observed that a substantial change in the dielectric properties of Aβ samples occurs on day 14. This measurement technique as well as the extraction of blood samples from Sprague-Dawley rats is simple. These results prove a new method of diagnosing Alzheimer’s Disease using microwave techniques.
Acknowledgements
This work done by Anil Lonappan is the part of his Doctoral studies in Elec-tronic Engineering at the School of Electrical ElecElec-tronic and Computer Engi-neering, University of KwaZulu Natal. The work done by Ernest Remy Hervé Ebell’a Dallé is the part of his Honours degree in human physiology at the School of Laboratory Medicine and Medical Sciences, University of KwaZu-lu-Natal.
References
[1] Berchtold, N.C. and Cotman, C.W. (1998) Evolution in the Conceptualization of Dementia and Alzheimer’s Disease: Greco-Roman Period to the 1960s. Neurobiol-ogy of Aging, 19, 173-189.
DOI: 10.4236/jemaa.2017.911014 166 Journal of Electromagnetic Analysis and Applications
in the United States and the Public Health Impact of Delaying Disease Onset.
American Journal of Public Health, 88, 1337-1342.
https://doi.org/10.2105/AJPH.88.9.1337
[3] Brookmeyer, R., Johnson, E., Ziegler Graham, K. and Arrighi, H.M. (2007) Fore-casting the Global Burden of Alzheimer’s Disease. Alzheimer’s & Dementia, 3, 186-191. https://doi.org/10.1016/j.jalz.2007.04.381
[4] Rosen, A., Stuchly, M.A. and Vorst, A.V. (2002) Applications of RF/Microwaves in Medicine. IEEE Transactions on Microwave Theory and Techniques, 50.
[5] Gabriel, S., Lau, R.W. and Gabriel, C. (1996) The Dielectric Properties of Biological Tissues: II. Measurements on the Frequency Range 10 Hz to 20 GHz. Literature Survey. Physics Medicine Biology, 41, 2251-2269.
https://doi.org/10.1088/0031-9155/41/11/002
[6] Cook, H.F. (1951) Dielectric Behavior of Human Blood at Microwave Frequencies.
Nature, 168, 247-248. https://doi.org/10.1038/168247a0
[7] Cook, H.F. (1951) The Dielectric Behavior of Some Types of Human Tissues at Mi-crowave Frequencies. British Journal of Applied Physics, 2, 295-300.
https://doi.org/10.1088/0508-3443/2/10/304
[8] Ghodgaonkar, D.K., Varadan, V.V. and Varadan, V.K. (1990) Free Space Measure-ment of Complex Permittivity and Complex Permeability of Magnetic Materials at Microwave Frequencies. IEEE Transactions on Instrumentation and Measurement, 19, 387-394. https://doi.org/10.1109/19.52520
[9] Ghodgaonkar, D.K., Varadan, V.V. and Varadan, V.K. (1989) A Free Space Method for Measurement of Dielectric Constant and Loss Tangents at Microwave Frequen-cies. IEEE Transaction on Instrumentation and Measurement, 38, 789-793.
https://doi.org/10.1109/19.32194
[10] Barry, W. (1986) A Broadband, Automated, Stripline Technique for the Simultane-ous Measurement of Complex Permittivity and Complex Permeability. IEEE Transaction on Microwave Theory and Techniques, 34, 80-84.
https://doi.org/10.1109/TMTT.1986.1133283
[11] Abbas, Z., Pollard, R.D. and Kelsall, R.W. (1998) A Rectangular Dielectric Wave-guide Technique for Determination of Permittivity of Materials at W-Band. IEEE Transactions on Microwave Theory and Techniques, 46, 2011-2015.
https://doi.org/10.1109/22.739275
[12] Mathew, K.T. (2005) Perturbation Theory. In: Mathew, K.T., Ed., Encyclopedia of RF and Microwave Engineering, Vol. 4, Wiley-Interscience, USA, 3725-3735.
https://doi.org/10.1002/0471654507.eme309
[13] Sipos, E., Kurunczi, A., Kasza, Á., Horváth, J., Felszeghy, K., Laroche, S., Toldi, J., Párducz, Á., Penke, B. and Penke, Z. (2007) β-Amyloid Pathology in the Entorhinal Cortex of Rats Induces Memory Deficits: Implications for Alzheimer’s Disease.
Neuroscience, 147, 28-36.