Assessing Passing
Opportunities – Stage 3
Assessing Passing
Opportunities – Stage 3
G.F. Koorey & J. Gu,
Opus International Consultants Ltd
ISBN 0-048-025078-9 ISSN 1174-0574
© 2001, Transfund New Zealand
PO Box 2331, Lambton Quay, Wellington, New Zealand Telephone 64-4 473 0220; Facsimile 64-4 499 0733
Koorey, G.F., Gu, J. 2001. Assessing passing opportunities – Stage 3. Transfund New Zealand Research Report No. 220. 119 pp.
Glen Koorey & Jing Gu
Opus International Consultants Ltd, Opus Central Laboratories, PO Box 30 845, Lower Hutt, New Zealand
Keywords: highways, New Zealand, overtaking, passing lanes, project evaluation, roads,
An Important Note for the Reader
The research detailed in this report was commissioned by Transfund New Zealand.
Transfund New Zealand is a Crown entity established under the Transit New Zealand Amendment Act 1995. Its principal objective is to allocate resources to achieve a safe and efficient roading system. Each year, Transfund New Zealand invests a portion of its funds on research that contributes to this objective.
While this report is believed to be correct at the time of its preparation, Transfund New Zealand and its employees and agents involved in its preparation and publication cannot accept any liability for its contents or for any consequences arising from its use. People using the contents of the document, whether direct or indirect, should apply and rely on their own skill and judgement. They should not rely on its contents in isolation from other sources of advice and information. If necessary, they should seek appropriate legal or other expert advice in relation to their own circumstances, and to the use of this report.
Acknowledgments
Contents
Executive Summary ...9
Abstract ...12
1. Introduction ...13
1.1 Background ...13
1.2 Previous New Zealand Research ...14
1.3 Objectives ...15
1.3.1 Task 1: Driver Reaction to Changed No-overtaking Markings ...16
1.3.2 Task 2: Field Calibration of Simplified Procedures ...16
1.3.3 Task 3: Field Performance of Slow Vehicle Bays ...16
1.3.4 Task 4: Development of Framework for Detailed Modelling ...16
1.4 Report Outline ...17
2. Driver Reaction to Changed No-overtaking Markings ...18
2.1 Introduction ...18
2.2 Methodology ...19
2.2.1 Site Selection ...19
2.2.2 Site Surveys ...21
2.2.3 Analysis of Results ...22
2.2.4 Further Surveying ...26
2.3 Desktop Analysis of Effects of No-Overtaking Criteria ...27
2.3.1 Expected Lengths of No-Overtaking Markings ...27
2.3.2 Assessing the Effects on Safety & Efficiency ...29
2.3.3 Assessing the Effects on Driver Compliance ...33
2.4 Discussion ...34
3. Field Calibration of Simplified Procedures ...37
3.1 Background ...37
3.2 Highway Capacity Manual Analysis Procedures for Passing Lanes ...38
3.3 Driver Frustration v Willingness To Pay ...41
3.3.1 Existing WTP Derivation ...41
3.3.2 Analysis and Discussion of WTP ...42
3.3.3 Determination of PTSF using the Simplified Model ...45
3.4 Improvements to the Simplified Model ...47
3.4.1 Issues Requiring Investigation ...47
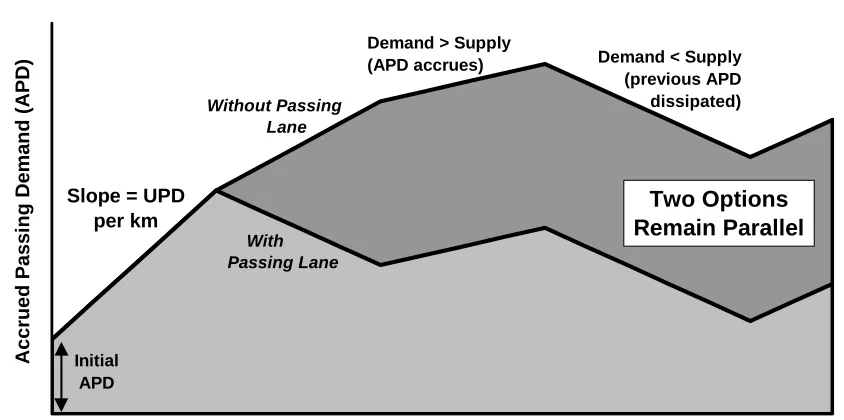
3.4.2 Accrued Passing Demand and Bunching ...48
3.4.3 Variations and Constraints on Passing Demand ...49
3.4.4 Maximum Passing Rates ...52
3.4.5 Other Potential Changes ...53
3.5 Local Survey of Maximum Passing Rates ...54
3.5.1 Method ...54
3.5.2 Results ...56
3.5.3 Comparison with TRARR Model ...58
3.5.4 Changes to Simplified Procedures ...59
3.6 Comparison of Improved Simplified Procedure with Field Data ...60
4. Field Performance of Slow Vehicle Bays ...64
4.1 Literature Review ...64
4.1.1 Operational Effectiveness ...65
4.1.2 Safety Effectiveness ...65
4.2 Field Surveys of Slow Vehicle Bays ...67
4.2.1 Methodology ...68
4.2.2 Results ...69
4.3 Analysis of Results ...72
4.3.1 Vehicle Types Using SVBs ...72
4.3.2 Vehicle Bunching Near SVBs ...73
4.3.3 Minimum Length for Slow Vehicle Bays ...75
4.4 TRARR Models ...78
4.5 Simplified Procedure in PEM ...80
4.6 Simplified Modelling of Frustration Benefits ...80
4.7 Discussion ...82
5. Development of Framework for Detailed Modelling ...85
5.1 Existing Features and Limitations of TRARR ...86
5.1.1 Handling Side Road Flows ...87
5.1.2 Restricted Speed Zones ...87
5.1.3 Highly Congested Situations ...88
5.1.4 Difficulty in Using Field Data for Calibration ...88
5.1.5 Software Operational Issues ...89
5.2 Alternative Two-Lane Simulation Packages and Tools ...90
5.2.1 TWOPAS ...90
5.2.2 Other Modelling Software ...91
5.3 Assessment of Relative Merits of Modelling Tools ...92
5.3.1 Prediction of Safety Benefits ...92
5.3.2 Interactive Highway Safety Design Model ...93
5.4 Discussion ...94
5.5 A Framework for Rural Simulation Modelling in New Zealand ...94
6. Conclusions ...97
6.1 Driver Reaction to Changed No-overtaking Markings ...97
6.2 Field Calibration of Simplified Procedures ...97
6.3 Field Performance of Slow Vehicle Bays ...98
6.4 Development of Framework for Detailed Modelling ...99
7. Recommendations ...101
7.1 Driver Reaction to Changed No-overtaking Markings ...101
7.2 Field Calibration of Simplified Procedures ...101
7.3 Field Performance of Slow Vehicle Bays ...101
7.4 Development of Framework for Detailed Modelling ...102
8. References ...103
APPENDICES ...107
1. Original Overtaking Survey Sites ...109
2. Sight Distance Plots of Selected Survey Sites ...111
3. Slow Vehicle Bay Sites Identified in New Zealand ...113
4. Slow vehicle Bay Observation Survey Instructions ...117
List of Figures
2.1 SH58 overtaking survey site, near Pauatahanui, Wellington...21
2.2 Layout of overtaking survey sites...22
2.3 Overtaking rates (southbound) at Site 2/116, SH2 north of Katikati...23
2.4 Overtaking rates (northbound) at Site 2/116, SH2 north of Katikati. ...23
2.5 Overtaking rates (eastbound) at Site 3/491, SH3 near Woodville. ...24
2.6 Overtaking rates (westbound) at Site 3/491, SH3 near Woodville. ...24
2.7 Overtaking rates (westbound) at Site 58/0, SH58 near Pauatahanui. ...25
2.8 Overtaking rates (eastbound) at Site 58/0, SH58 near Pauatahanui. ...25
2.9 Mean travel times with changing SD criteria. ...31
2.10 Average overtaking rate with changing SD criteria...31
2.11 Percent of time spent following (PTSF) with changing SD criteria. ...32
3.1 Example of the operational effect of a passing lane on percent time spent following (PTSF) from Harwood et al. 1999...38
3.2 Effect of a passing lane on percent time spent following (PTSF) as represented in the operational analysis methodology. ...39
3.3 Effect of a passing lane on average travel speed (ATS) as represented in the operational analysis methodology. ...39
3.4 PTSF relationship for Taupo-Turangi section of SH1...42
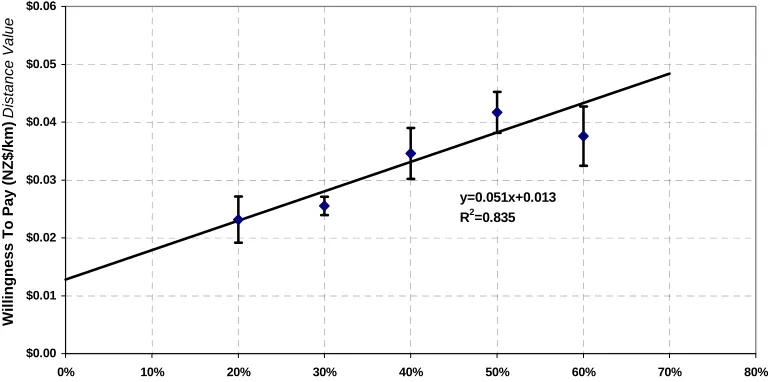
3.5 WTP (Time Values) for reduction in PTSF (% time spent following)...43
3.6 WTP (Distance Values) for reduction in PTSF (% time spent following). ...43
3.7 Grouped WTP (Time Values) for reduction in PTSF (% time spent following). . ...44
Grouped WTP (Distance Values) for reduction in PTSF (% time spent following). ...44
Derivation of PTSF from APD analysis. ...46
Ratio R(f) of APD (Average Passing Demand) per queued vehicle. ...49
Typical derivation of APD (Accrued Passing Demand). ...50
3.12 APD (Accrued Passing Demand) adjusted for bunching. ...52
3.13 Layout of Otaihanga passing lane survey. ...55
3.14 Number of passes observed on Otaihanga passing lane. ...55
3.15 Bunching levels on highway before Otaihanga passing lane. ...57
3.16 Overtakings from Otaihanga passing lane TRARR model. ...58
3.17 Maximum passing rates modelled by TRARR. ...59
3.18 TRARR and field bunching data for SH3 north of Wanganui. ...61
3.19 Accrued passing demand (APD) for SH3 north of Wanganui. ...61
4.1 SH2 Waikoau Hill slow vehicle bay. ...68
4.2 Layout of slow vehicle bay surveys. ...69
4.3 Bunching levels at Kaimai SVB sites. ...71
4.4 Distribution of vehicle bunch sizes related to proportion of vehicles following. ...74
4.5 Distribution of vehicle queue sizes to proportion of vehicles following. ...75
4.6 Minimum length of SVB, for one vehicle to overtake. ...76
4.7 Minimum length of SVB, for two vehicles to overtake. ...77
4.8 Theoretical improvements in %Following at SVBs. ...82
5.1 Data files used in TRARR. ...86
List of Tables
2.1 Locations of overtaking survey sites. ... 20
2.2 Sight distances (SD) (m) at the selected survey sites. ... 21
2.3 Breakdown of longer state highways into shorter lengths. ... 28
2.4 Effect of different SD criteria on no-overtaking marking requirements. ... 28
2.5 Effect of obstructions on no-overtaking marking requirements. ... 29
2.6 Intermediate sight distances (ISD) at different speeds. ... 35
3.1 Downstream length of roadway affected by passing lanes on directional segments in level and rolling terrain. ... 40
3.2 Estimation of relative change in PTSF and ATS within a passing lane. ... 40
3.3 Optimal lengths of passing lanes for different flow rates. ... 40
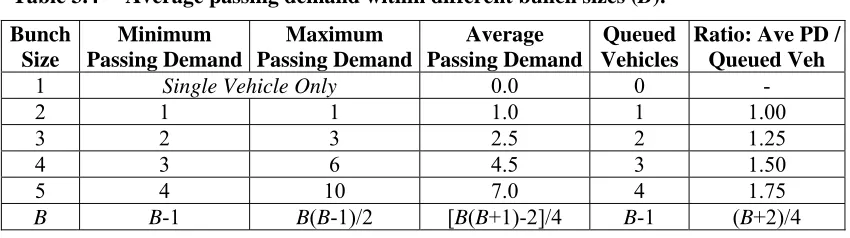
3.4 Average passing demand within different bunch sizes (B). ... 48
3.5 Comparison of travel time savings between TRARR and PEM models. ... 62
4.1 Current minimum lengths for slow vehicle bays. ... 65
4.2 Slow vehicle bay sites monitored in the field surveys. ... 67
4.3 Summary of survey results from slow vehicle bay sites. ... 69
4.4 Vehicle types of SVB users recorded at the survey sites. ... 72
4.5 Use of SVBs by platoon leaders related to length of queues. ... 73
4.6 Recommended minimum SVB lengths. ... 78
4.7 Comparison of Waikoau Hill SVB data with TRARR Model. ... 79
4.8 Comparison of Kilmog SVB data with TRARR Model. ... 79
4.9 Comparison of Waikoau Hill SVB data with simplified bunching formula. ... 81
Executive Summary
Introduction
This research continues recent work to investigate ways of analysing and providing for improved passing opportunities on rural highways in New Zealand. It was carried out during 1999-2001. The main objectives of this research were:
• To assess the effectiveness of no-overtaking delineation using modified (horizontal curve) warrant criteria.
• To improve the Transfund New Zealand simplified procedures for passing lane analysis using field surveys and TRARR1 modelling.
• To investigate the use and performance of slow vehicle bays using field surveys.
• To develop a framework for future development of detailed rural simulation modelling in New Zealand.
Driver reaction to changed no-overtaking markings
Field surveys and subsequent desktop analysis of three short overtaking sites in New Zealand, together with literature review, revealed:
• Small amounts of overtaking (averaging up to 2.5% of all traffic) do occur at sites with sub-standard horizontal sight distance (SD). The maximum potential amount of overtaking occurring is inversely proportional to the opposing traffic.
• Changing no-overtaking markings to include horizontal curve criteria would at least double the amount of marking required. It would also reduce overtaking rates by up to 50%, and increase time spent following by 20-30%. However travel times would increase by no more than 9%, and less where traffic is greater. Likely changes in driver compliance do not have a significant effect on the predicted changes.
• The predicted reduction in “dangerous” overtaking manoeuvres will be somewhat offset by the increase in driver frustration. However a net safety benefit is expected with the introduction of more restrictive no-overtaking criteria.
• Allowing no-overtaking lines to be marked on straight approaches to isolated horizontal curves, to inform drivers when suitable overtaking lengths are no longer available, may provide a suitable compromise between the existing vertical-only SD criteria and a full combined horizontal/vertical SD criteria.
Field calibration of simplified procedures
Field surveys, literature review, and various TRARR and simplified procedure analyses on passing lane situations showed:
• The recent updating of US Highway Capacity Manual (HCM) procedures provide a fairly straightforward means of assessing the effects of a passing lane on vehicle bunching and travel speeds. It may be reasonable to use them to assess passing lanes in New Zealand, either at a project-specific level or for strategic route studies.
• A revised Willingness-To-Pay (WTP) relationship has been derived that relates driver frustration to changes in Percent Time Spent Following (PTSF).
• A number of improvements to the existing simplified passing lane procedure were identified. These include reducing calculated passing demand as the Accrued Passing Demand (APD) increases, and revising maximum passing rates.
• Even with the suggested changes, the simplified procedures still tend to over-estimate increases and decreases in APD. What appears to be missing is some “equilibrium” value that a given road and traffic situation will gravitate towards.
• The relationship between APD and bunching is still not entirely certain, and maybe the simplified procedure should be re-presented in terms of %Bunching instead.
Field performance of slow vehicle bays
Field surveys and subsequent desktop analysis of eight slow vehicle bay (SVB) sites in New Zealand, together with a literature review, revealed:
• SVB use appears to be very dependent on the location and design of each site. The use of SVBs by platoon leaders generally ranges between 30-60%, a higher rate than that found in overseas studies.
• SVBs do not greatly reduce the proportion of bunched vehicles, particularly in winding alignments, with less than 10% (absolute) reductions observed. The short-term benefits however probably do provide some reduction in driver frustration.
• Trucks and recreational vehicles typically made up 70-90% of all vehicles using SVBs, with trucks in particular being high users. Some sites that looked more like passing lanes had higher car use.
• Evidently confusion by drivers exists over the use of some SVBs, as seen in the numbers of lone vehicles using them and in conflicts at SVB merges.
• The Borel-Tanner Distribution provided an excellent model of bunch sizes observed at SVBs. Using this model, queues of two or more vehicles-following play a significant part when considering the operation of SVBs.
• The current New Zealand guidelines for SVB lengths may be inappropriate, given the number of merge area conflicts and the likely number of multi-vehicle queues. For a short SVB with sufficient queuing, any travel time benefits gained by the passing vehicles may be negated by the delay placed on the overtaken vehicle.
• SVBs modelled by TRARR provide a realistic reduction in the proportion of platooned vehicles, but under-estimate the actual travel-time savings.
• A simplified formula has been developed that appears adequate for predicting bunching rates after an SVB, given initial on-site field surveys, and can be applied to the calculation of the frustration benefits from a proposed SVB.
• The safety benefits of SVBs are not entirely clear. Downstream crash savings beyond the site may be very limited, but savings are likely at the site if the new SVB provides a safer alternative to previous overtaking attempts at that site.
Development of framework for detailed modelling
Literature review and assessment of various highway simulation models identified a number of observations:
• There is a need to consider in a unified manner the overall impacts of changes to road alignments and cross-sections, for both safety and efficiency.
• Simulation would still appear to be necessary when evaluating realignments, multiple passing lanes, continuous four-laning, and when validating “simplified” methods.
• A US software tool, TWOPAS, holds some promise as a possible replacement for TRARR. However, work is needed to confirm its validity and practicality for its use in New Zealand.
• An alternative approach is to consider the feasibility of applying more recent micro-simulation tools that are being used for urban networks and inter-urban motorways overseas, to rural highways in New Zealand.
• A general framework has been developed in our research that provides an overview of what an ideal rural simulation model needs to take account of, in terms of how various road, traffic, vehicle and driver inputs interact to provide all the information required for project evaluation in New Zealand.
Recommendations
Key recommendations are:
Driver reaction to changed no-overtaking markings
• Further overtaking surveys or driving simulator studies should be used to assess revised no-overtaking marking criteria.
• The use of a speed-dependent measure for assessing no-overtaking areas should be considered in New Zealand.
• A modified criterion allowing no-overtaking lines to be marked on straight approaches to isolated horizontal curves should be investigated.
Field calibration of simplified procedures
• The revised US HCM procedures for passing lanes should be investigated further in New Zealand to confirm their appropriateness for evaluating passing lane projects.
• The revised driver frustration WTP procedure and suggested changes to Transfund’s simplified passing lane procedures should be adopted.
• Field performance of slow vehicle bays
• SVBs should be clearly marked distinctly from passing lanes, to prevent confusion by drivers. Driver education about SVBs should also be carried out.
• SVBs should be located only where the mean traffic speed is less than about 60km/hr, and even lower speeds where greater traffic volumes and longer queues are likely.
• SVB travel-time savings should only be considered where the site does not cause undue delay to those vehicles being overtaken that are waiting to re-enter the traffic stream. • An alternative simplified evaluation procedure should be used for SVBs based on these
research findings, instead of the existing simplified passing lane procedures. • Development of framework for detailed modelling
• The most recent versions of the TRARR and TWOPAS models should be compared in a range of New Zealand settings and scenarios with actual field data.
• Further work should incorporate safety assessments in rural simulation models used in New Zealand, including an investigation of the US IHSDM2 project.
Abstract
1. Introduction
This research continues recent work carried out to investigate ways of analysing and providing for improved passing opportunities on rural highways in New Zealand. In doing so, it must balance efficiency and safety demands. The project was carried out during 1999-2001. The specific objectives for this stage of the work are outlined in Section 1.3 of this report.
1.1 Background
New Zealand’s relatively rugged terrain and low traffic volumes have meant that virtually all its rural strategic routes have been built as two-lane highways. As traffic volumes have increased, increasing pressures have been placed on maintaining an adequate level of service. Passing opportunities, such as passing lanes and slow vehicle bays (SVBs), provide a means to relieve these pressures and their construction is greatly encouraged by the general public.
At the same time, two-lane road sections unsuitable for passing (because of their poor alignment) must be identified and marked accordingly to assist drivers in safe passing manoeuvres. No-overtaking lines have become widely accepted and important traffic control devices in many countries, including New Zealand.
Passing opportunities generate economic benefits by reducing travel times, as they release impeded vehicles from platoons1. Released drivers may then travel at their desired speed until they once again become trapped in slower moving platoons. The length of road over which passing opportunities are effective is, therefore, generally much greater than the physical length of the passing opportunity section. When drivers are unable to overtake a slower vehicle they are likely to become frustrated. This can lead to an increase in unsafe passing manoeuvres that can lead to crashes. Thus provision of passing opportunities allows for safe passing manoeuvres and a subsequent reduction in crashes.
Transfund New Zealand (Transfund) currently requires that all new roading projects be assessed using their standard economic evaluation procedures to produce a “Benefit-Cost Ratio” (BCR). BCRs assess the tangible benefits related to savings in travel-time, vehicle-operating costs, and crashes, against the construction and maintenance costs involved (Transfund 1999).
Some overseas national or state jurisdictions justify passing lane construction by means of warrant requirements, examples of which can be seen in AUSTROADS
(1993). However Transfund’s requirements mean that specific benefits must be calculated, usually by means of a rural road simulation model, such as ARRB Transport Research’s TRARR2 package (Shepherd 1994).
Nevertheless, as a modelling tool for passing opportunities, TRARR has proved to be an adequate package. In particular, the ability to import RGDAS3 (road geometry) data from New Zealand state highway network has been particularly effective. However a number of potential drawbacks have been identified, limiting TRARR’s use for all rural simulation work in New Zealand. It is a relatively specialised tool and, despite recent improvements in its data collection requirements, it is still fairly time consuming (and hence costly) to make use of. There is therefore scope to provide an improved rural simulation tool for use in New Zealand.
1.2 Previous New Zealand Research
Initial research in New Zealand (Tate 1995, Thrush 1996) investigated ways in which improved passing opportunities may be provided and analysed, and included a literature review of the methods available to assess the benefits of improved passing opportunities. The study, based on a series of desktop analyses, concluded that: • The analysis of the benefits of improved passing opportunities is a complex task
that requires consideration of a number of variables.
• Although simplified graphs of likely benefits were produced, the simplifications involved reduced the usefulness of these graphs.
• The use of simulation models such as TRARR was still the most appropriate tool in New Zealand for detailed passing lane analysis.
• Applying the simulation models with differing degrees of refinement can provide a staged assessment process. However, a more simplified means for at least preliminary assessment was still desired.
• The safety implications of improved passing opportunities were unclear. An investigation into the potential safety implications should be undertaken.
Stage 2 of the research project (Koorey et al. 1998) built on the initial work, and investigated the development of a simpler system to determine the need for, location of, and benefits to be derived from passing lanes. Other aspects of the research also looked at measures of driver frustration resulting from inadequate passing opportunities, the crash reduction potential of passing lane improvements, and optimum data requirements to calibrate TRARR. The key findings of the study were: • A tangible Willingness To Pay (WTP) for passing opportunities related to driver
frustration was determined. WTP was found to be significantly correlated with the easily measurable “Unsatisfied Passing Demand”, although further work was required to refine the relationship.
• A number of factors were found to have an effect on passing lane crash rates, including crash type, crash location, and passing lane length. Typical mid-block injury crash rates for three/four-lane rural highway sections in New Zealand were found to be on average 25% lower than the equivalent two-lane rates.
• A simplified model for assessing the optimum location of passing lanes was developed. The model is based on comparing the supply of and demand for
passing opportunities along a route and requires less input data and analysis time than TRARR.
• A comparison of both the simplified model and TRARR with “before and after” field data was made. Both analyses were found not to over-estimate actual travel time benefits derived from passing lanes.
The driver frustration WTP and methodology for the simplified model were incorporated in Transfund’s 1999 Project Evaluation Manual (PEM). However, a
number of problems requiring further work were identified. These included evaluation of other means of providing passing opportunities (such as SVBs), further development of a variable WTP, and confirmation (using field surveys) of theoretical values used in the simplified procedures.
At the same time, Transit New Zealand commissioned separate research investigating the existing warrants4 for no-overtaking lines in New Zealand (Thrush et al. 1998). Currently no-overtaking delineation in New Zealand is generally only used on sections of road where sight distance is restricted by vertical curvature. Concern has been expressed regarding the adequacy of current no-overtaking line criteria in New Zealand, particularly with regard to horizontal curves and higher speeds.
Thrush et al. recommended that a review of the sight distances used for marking no-overtaking lines be undertaken. In particular they suggested that a sight distance approach based on the “critical position”, a point at which the decision to complete the manoeuvre affords the same clearance as the decision to abort. They also recommended that no-overtaking warrants in New Zealand should take into account the actual operating speeds on the highway. Further work was required however to assess the impacts of changed criteria on road-marking costs and driver efficiency and safety.
1.3 Objectives
The main objectives of this research were:
• To assess the effectiveness of no-overtaking delineation using modified (horizontal curve) warrant criteria.
• To improve the Transfund simplified procedures for passing lane analysis using field surveys and TRARR modelling.
• To investigate the use and performance of slow vehicle bays using field surveys. • To develop a framework for future development of detailed rural simulation
modelling in New Zealand.
1.3.1 Task 1: Driver Reaction to Changed No-overtaking Markings A quantitative field survey was carried out to determine driver overtaking behaviour on short lengths of visible straight highways. The sites chosen display some level of overtaking despite a moderately curved alignment. A second stage to re-mark the sites for no-overtaking using the horizontal curve warrant criteria is discussed.
Additionally a desktop analysis was carried out on the effect of changed no-overtaking criteria on marking requirements, and safety and efficiency. The behavioural implications of these findings, in conjunction with previous driver overtaking research, are also assessed.
1.3.2 Task 2: Field Calibration of Simplified Procedures
The existing simplified passing lane procedure was reviewed, in conjunction with field data. In particular, two key components were examined:
• How the initial and subsequently accrued passing demand relates to corresponding bunching levels.
• The maximum possible overtaking rate available within passing lanes.
The field data were compared against the expected results calculated using the PEM simplified procedures, and TRARR simulation models. In addition, a review of the driver frustration Willingness-To-Pay (WTP) was made by approaching the original survey data from the perspective of Percent Time Spent Following (PTSF). Suggested modifications to the simplified procedure methodology are made.
1.3.3 Task 3: Field Performance of Slow Vehicle Bays
The typical use of slow vehicle bays either way to reduce passing demand has been established using field surveys. The implications with respect to SVB lengths and their safety performance are also investigated.
Analysis of the data attempted to relate the field performance to TRARR models and the previously prescribed simplified procedures for passing lane analysis. Suggested modifications for their application to SVBs are made.
1.3.4 Task 4: Development of Framework for Detailed Modelling
The existing features and deficiencies of TRARR, and of other common simulation tools world-wide, are summarised and compared. This aspect of the research is based on literature review, correspondence with relevant organisations, and the personal experience of the researchers.
1.4 Report Outline
Section 2 of this report examines the effects of no-overtaking delineation using modified (horizontal curve) warrant criteria.
Section 3 then details findings from field surveys and data analysis of passing lanes and suggests improvements to the Transfund simplified procedures for passing lane analysis.
Section 4 reports on field surveys looking at the use and performance of slow vehicle bays, and suggests changes to project evaluation procedures for them.
Section 5 discusses detailed rural simulation modelling in New Zealand and develops a framework for future development.
2. Driver Reaction to Changed No-overtaking Markings
2.1 Introduction
No-overtaking lines have become widely accepted and important traffic control devices in many countries. Their primary function is to prohibit overtaking manoeuvres where crossing into an opposing traffic lane is almost always above an acceptable risk threshold.
Over the years, research into warrants for no-overtaking lines has produced alternative criteria for line marking and questioned the basis for warrants that were developed some decades ago. Concern has been expressed regarding the adequacy of current no-overtaking line criteria in New Zealand. Specific concerns relate to the lack of marking for horizontal visibility criteria and the increase in speeds following the raising of the open road speed limit in 1985 (Goh & Barnes 1988).
The three basic types of visibility restriction on two-lane rural roads are those related to vertical curvature, horizontal curvature, or a combination of both horizontal and vertical curvature. However, in New Zealand, none of the no-overtaking lines are marked solely for restrictions in horizontal alignment (TNZ/LTSA 1997). Although some sites are marked because of an “unusual combination of vertical and horizontal curves”, this is a subjective criteria only. The main argument supporting the New Zealand system is that drivers are able to see that a horizontal curve will conceal oncoming traffic, whereas a driver cannot tell if a vertical curve will conceal oncoming traffic or not.
Research suggests however that, although a driver will be able to see that a horizontal curve will hide oncoming traffic, they will probably under-estimate the time and space required for overtaking (Gordon & Mast 1968). Also, as the driver’s speed increases, the difference between their estimated distance and the actual distance required increases. Although no-overtaking lines can provide this information, the question is whether drivers would accept and abide by additional markings.
Another study showed that, although drivers were able to take their own speed into account when deciding whether or not to overtake, they could not estimate oncoming vehicle speed (Faber et al. 1968). They too suggested a need for the sight distance (SD) criteria to become more conservative with increased speed, as the research showed that driver judgement worsens with increased speed.
These two studies strongly prove that no-overtaking lines are a necessary safety device on the highway. The evidence also points to the need to relate overtaking sight distance to vehicle speed.
lines. These crashes however accounted for 14% of the annual costs of overtaking crashes, underlining the seriousness of not judging overtaking distances correctly.
Another 15% of overtaking crashes occurred at locations with no-overtaking markings, accounting for 22% of the annual costs. This highlights the fact that non-compliance of no-overtaking markings will always be an issue. Increasing the level of enforcement of the regulations relating to the markings may improve their effectiveness.
2.2 Methodology
A quantitative field survey was undertaken to relate driver behaviour with changed no-overtaking delineation. Existing sites without no-overtaking lines would be observed as initial surveys. Subject to the results from these initial surveys, the sites would then be re-marked using the horizontal curve warrant criteria, increasing the amount of no-overtaking length delineated.
Sites on rural state highways were targeted for investigation. Ideally, the sites chosen should display a significant level of overtaking despite a moderately curved alignment. Suitable sites were selected using the following influencing variables: • Proportion of local traffic (i.e. who are familiar with the road),
• Level of existing overtaking,
• Amount of adjacent passing opportunities, • Traffic volumes (to obtain sufficient data), • Accessibility to surveyors.
2.2.1 Site Selection
Preparing a shortlist of potential sites was the first challenge. The approach taken was to identify short lengths of state highways with relatively high crash numbers for overtaking-related crashes. This would indicate sites with possible problems due to relatively high rates of overtaking despite the poor alignment.
Initial inspection of the crash data revealed 41 sites with at least four overtaking-related injury crashes per kilometre since 1980. While it is accepted that many of the sites may have significantly changed over that period, this approach helped us to identify a sufficiently large initial sample to start from. Appendix A1 lists the original sites. Local Opus offices in the vicinity of each site were contacted for comments on the suitability of the selected sections, based on the criteria given in Section 2.1. This eliminated, for example, those sites that already had no-overtaking markings or other complicating features such as passing lanes or side roads. From this feedback, a shortlist of nine sites was identified for further investigation.
allows users to import road geometry data into TRARR. (Previously, creating TRARR’s ROAD files had to be done manually.) RGTRA converts “RGDAS” format *.XYZ files into *.TRA files that can in turn be imported into TRARR. The *.TRA files include, among other things, a calculation of forward and backward sight distances. As such, RGTRA is a useful tool in its own right for obtaining sight distance data.
The original 1992 road geometry data collected in New Zealand was stored in the appropriate “RGDAS” format. However the current road geometry data that is stored in RAMM1 is not in the correct RGDAS format, so a conversion routine is needed to produce equivalent *.XYZ files. Some code developed in an MS Access database enabled this. Both sets of data record, at 10m intervals (in both directions), the horizontal curvature, cross-fall (superelevation), and gradient.
As well as specifying a road geometry file to analyse, RGTRA also requires input information on the distances to the left and right offsets. These determine how much of an effect obstructions on either side are to the calculated SDs. For vertical-only SDs, a nominally large offset was used (1000m) reflecting the lack of effect of horizontal curve obstructions (i.e. similar to driving on an open plain). For combined SDs, an offset of only 5m was used, suggesting that the road is contained within a narrow “corridor” (i.e. similar to driving in a cutting).
The resulting sight distances were plotted together for comparison. Visual inspection of the plots for these allowed us to narrow down to three sites for survey. These sites were confirmed by final local inspection and are listed in Table 2.1.
Table 2.1 Locations of overtaking survey sites.
SH RS/RP* Location AADT Description
SH2 RP99/15.2-116/0.0
North of Katikati, Bay of Plenty
8000 Tight curves but people pass when they can; 300m north of Stokes Road.
SH3
RP491/5.3-6.1
West of Woodville, Southern Hawkes Bay
6000 Straight just west of Old Cemetery Road, only passing opportunity between Woodville and Manawatu Gorge.
SH58
RP0/11.4-11.8
West of Pauatahanui, Wellington
6500 Short straight between tight curves. East of James Cook Drive.
SH – State Highway number; RS – Reference Station; RP – Route Position AADT – Annual Average Daily Traffic volume
Abbreviated site names used in text are: (SH/RS) 2/116; 3/491; 58/0.
These sites do not appear to meet the current criteria for indicating with no-overtaking lines (and are not marked as such), but would be marked if a more restrictive horizontal + vertical criteria were used. Table 2.2 summarises the calculated sight distances.
1 RAMM – Road Asset Maintenance and Management system: road inventory database maintained
Table 2.2 Sight distances (SD) (m) at the selected survey sites.
Increasing RP* Decreasing RP* Site
Vertical SD Only Horiz + Vert SD Vertical SD Only Horiz + Vert SD
(SH/RS) Min SD Ave SD Min SD Ave SD Min SD Ave SD Min SD Ave SD
2/116 199 786 159 230 150 632 159 225
3/491 449 932 130 305 429 931 130 307
58/0 219 790 79 175 200 734 79 207
* Increasing /Decreasing from RP, at start of highway
The average sight distance over the surrounding kilometre is seen to drop quite significantly when the combined horizontal/vertical criterion is applied, and falls below the current minimum requirement of 330m on rural roads. In most cases, the minimum sight distance at any point along the highway also drops significantly. Appendix A2 shows the sight distance plots for these three sites.
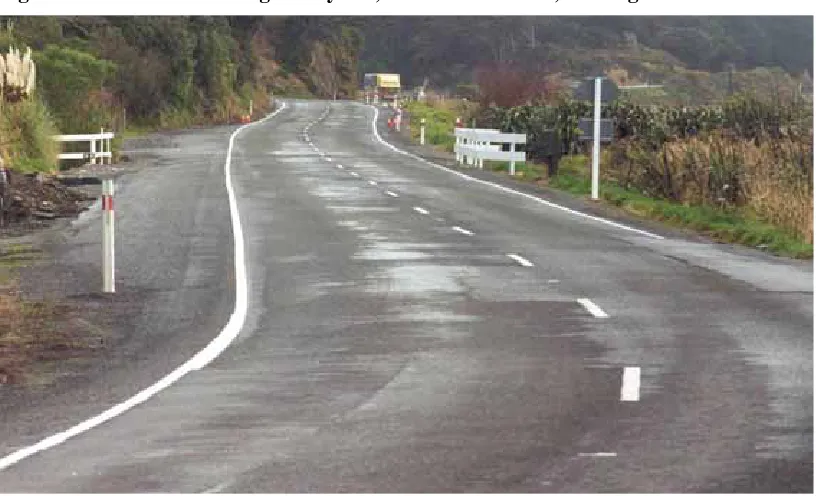
All three sites contain a relatively short straight, within tighter curves. Because of this, the sites also appear to be currently indeterminate for overtaking ability (i.e. some drivers will, some won’t). The SH58 site contains a notable amount of “local” traffic (i.e. commuting between Hutt Valley and Kapiti/Porirua), and the SH2 and SH3 sites are less affected. Figure 2.1 shows one of the sites on SH58 (note that the lens foreshortens the length of highway seen).
Figure 2.1 SH58 overtaking survey site, near Pauatahanui, Wellington.
2.2.2 Site Surveys
the main flow of a lane was deemed to be overtaking in the opposite direction. Figure 2.2 demonstrates the surveying procedure.
Figure 2.2 Layout of overtaking survey sites.
Tube Counters
Non-overtaking Vehs Overtaking Vehs
Overtaking Vehs Non-Overtaking Vehs
The tubes were placed in the middle of the identified overtaking section, so as to pick up as many overtaking manoeuvres as possible. A typical 10-second manoeuvre at 108km/hr (30m/s) equates to 300m of length required, so it was expected that most overtakings in the vicinity should cross the tubes. It was possible that a vehicle could straddle the centreline and cross over both tubes, thus triggering a double count. However a gap was left between the opposing tubes to minimise this occurrence.
The surveying was carried out for at least a week at each site (the SH3 site was surveyed for two weeks). Unfortunately the SH2 site had road works approximately 300m south of the site, which may have influenced typical overtaking rates. The resulting traffic data was then summarised into quarter-hourly blocks to determine the level of overtaking occurring with a given traffic volume.
2.2.3 Analysis of Results
The hypothesis is that traffic flows, both in the same direction and in the opposing direction, have significant effects on the incidence of vehicles overtaking. A greater traffic flow in the same direction is more likely to result in having to follow slower vehicles and thus increasing the amount of overtaking desired. However a greater traffic flow in the opposing direction will limit the opportunities for safe overtaking and reduce the amount of overtaking achieved. The other factor that will influence overtaking rates is the proportion of road with adequate overtaking sight distance, including the amount of previous opportunities for overtaking.
greater than 400 veh/hr (i.e. one vehicle on average every 9 seconds or less) is somewhat alarming. However vehicle platooning will also be occurring and this will often provide longer gaps in between bunches.
Figure 2.3 Overtaking rates (southbound) at Site 2/116, SH2 north of Katikati.
SH2 RP 116/0.0
0% 5% 10% 15% 20% 25% 30% 35% 40% 45% 50%
0 100 200 300 400 500 600
Northbound Hourly Volume
Southbound Overtaking Rate
Average Overtaking Rate: 0.3%
Figure 2.4 Overtaking rates (northbound) at Site 2/116, SH2 north of Katikati.
SH2 RP 116/0.0
0% 5% 10% 15% 20% 25% 30% 35% 40% 45% 50%
0 100 200 300 400 500 600
Southbound Hourly Volume
Northbound Overtaking Rate
The SH3 site (Figures 2.5, 2.6) illustrates quite significant differences in overtaking rates in each direction. The eastbound traffic exhibits by far the strongest overtaking rates of all sites, while westbound traffic has the lowest. This may be a consequence of the Manawatu Gorge being immediately before the site for eastbound traffic, causing a build-up in vehicle platooning and driver frustration.
A comparison of prior passing opportunities in the 5km before each site was made to see whether a correlation with overtaking rates could be identified. For the purpose of this exercise, the proportions of highway with sight distances greater than 450m or 330m were determined. Apart from the above-mentioned site however, no clear trend was discernible between average overtaking rates and passing demand.
Figure 2.5 Overtaking rates (eastbound) at Site 3/491, SH3 near Woodville.
SH3 RP 491/5.5
0% 5% 10% 15% 20% 25% 30% 35% 40% 45% 50%
0 50 100 150 200 250 300 350 400 450
Westbound Hourly Volume
Eastbound Overtaking Rate
Average Overtaking Rate: 2.5%
Figure 2.6 Overtaking rates (westbound) at Site 3/491, SH3 near Woodville.
SH3 RP 491/5.5
0% 5% 10% 15% 20% 25% 30% 35% 40% 45% 50%
0 50 100 150 200 250 300 350 400 450
Eastbound Hourly Volume
Westboound Overtaking Rate
Each of the plots indicates a generally decreasing relationship between overtaking rate and opposing traffic, similar to a 1/x or negative exponential function. This is a little deceptive because of the often-high number of 0% readings plotted on top of each other. However the results do tend to suggest that the maximum potential overtaking rates do indeed fall away with increasing volume.
Figure 2.7 Overtaking rates (westbound) at Site 58/0, SH58 near Pauatahanui.
SH58 RP 0/11.1
0% 5% 10% 15% 20% 25% 30% 35% 40% 45% 50%
0 100 200 300 400 500 600 700
Eastbound Hourly Volume
Westboound Overtaking Rate
[image:27.595.106.506.216.416.2]Average Overtaking Rate: 0.9%
Figure 2.8 Overtaking rates (eastbound) at Site 58/0, SH58 near Pauatahanui.
SH58 RP 0/11.1
0% 5% 10% 15% 20% 25% 30% 35% 40% 45% 50%
0 100 200 300 400 500 600 700
Westbound Hourly Volume
Eastbound Overtaking Rate
Average Overtaking Rate: 0.4%
The trends plotted are in line with the Percent Available Gaps (PAG) calculation currently used in the Transfund simplified passing lane evaluation, which is used to determine the supply of passing opportunities:
Although plots could also be derived for overtaking rate as a function of traffic flow in the same direction, these are not as informative. First, because there is a direct relationship between traffic flow and overtaking rate in the same direction, the plot at low volumes forms patterns of parallel curves (e.g. at 4 veh/hr, the only possible overtaking rates are 0%, 25%, 50%, or 75%). Second, as discussed above, traffic flow in the same direction directly affects the demand for overtaking but this is not always matched by the available supply of overtaking opportunities. It is the supply that ultimately determines the actual amount of overtaking that occurs, and the opposing flow and alignment determine this.
2.2.4 Further Surveying
Subject to the results from the initial surveys, it was hoped to re-survey the sites after they were re-marked using the alternative horizontal curve warrant criteria. At the sites chosen, this would have had the effect of introducing no-overtaking lines where currently there were none. On the basis that no other aspect of the site had been changed, this would have addressed the question of whether drivers complied with the stricter markings.
A number of concerns arose about the usefulness of this exercise. For example, two of the sites were affected by adjacent works during or after the initial surveys. As mentioned above, the SH2 site had roadworks nearby while it was being surveyed. Although it does not appear to have affected the general pattern of overtaking rates with volumes, it is likely to have affected the overall level of overtaking so as to render a comparison survey invalid. Similarly, the SH58 site was affected by subsequent road works at the Pauatahanui bridge. The associated road realignment extended further than expected, to the curve at the eastern end of the survey site. This had the effect of changing the approach sight distance and probably the level of bunching prior to the site.
The relatively low level of overtaking (0%-2.5% of all vehicles on average) also raises questions about whether a significant enough trend would be detected as a result of marking of no-overtaking lines. Although over 20,000 vehicles were recorded at each site in each direction (and twice that at the SH3 site, which had been surveyed for two weeks), initial analysis suggests that it would still be very difficult to get an adequate level of change. If it were assumed that the overtaking rate approximated a binomial distribution, then a relatively small reduction in overtaking overall would be statistically significant. For example, a 0.5% overtaking rate over 20,000 vehicles requires about a 0.1% (absolute) change to be statistically significant at the 95% level. However comparison of the SH3 site data on a day-to-day basis revealed standard deviations that were 3 to 5 times that of a binomial distribution, requiring correspondingly large changes to be significant. A discernible trend when compared with traffic volumes is even less likely to be evident, given the previous distributions.
The remaining SH3 site could still have been re-marked and re-surveyed. In having the highest and lowest recorded levels of overtaking in opposite directions at the same site, this site provides an interesting contrast. However it was felt that re-surveying only one site would not do justice to the purpose of the exercise.
2.3 Desktop Analysis of Effects of No-Overtaking Criteria
As an alternative investigation, a desktop analysis exercise was conducted to assess the implications of applying no-overtaking markings New Zealand-wide, using combined horizontal and vertical criteria. State Highway Road Geometry data was used to analyse the likely effects on:
• Lengths of road required to be marked with no-overtaking markings;
• Safety, as a result of changes in numbers of attempted passing manoeuvres; • Travel times, as a result of changed passing opportunities.
Note that, for this work, only the rural SD criteria were used, and major urban areas were excluded, while minor urban settlements along the road were analysed as part of the rural lengths.
2.3.1 Expected Lengths of No-Overtaking Markings
As with the previous work recorded in Section 2.1, RGTRA was used with the SH Road Geometry data to produce SD data. Because the full New Zealand road network is available on a single Opus database, the 1998 SH Road Geometry data was used for this work. Although some changes in road geometry have occurred since then (1998) as a result of realignments and shape corrections, the overall length involved is relatively minor.
Again, offsets of 1000m (vertical-only SD) and 5m (combined horizontal/vertical SD) were used. In practice there are often situations where visibility is possible across a horizontal curve in open (rural) country. Therefore the true effect of a horizontal/vertical criterion is likely to be overstated. Manually identifying and adjusting for the actual location of all obstructions would be very time-consuming. However, some data was available from another project where this was done over a small section of the highways studied in this project, and this is compared later.
Table 2.3 Breakdown of longer state highways into shorter lengths.
SH Sub-section From RS To RS Description
1N 1NY 1 303 (end 288) Kaitaia – Orewa 1NZ 478 969 (end 953) Cambridge – Paremata 2 02X 0 146 (end 130) Pokeno – Tauranga
02Y 164 638 (end 626) Mt Maunganui – Bay View 02Z 661 946 (end 931) Clive – Upper Hutt
1S 1SX 0 317 (end 311) Picton – Woodend 1SY 350 700 (end 683) Hornby – Dunedin 1SZ 729 920 (end 900) Mosgiel – Invercargill 6 06X 0 116 (end 99) Blenheim – Nelson
06Y 130 639 (end 626) Richmond – Fox Glacier 06Z 639 1168 (end 1157) Fox Glacier
After batch running of RGTRA analyses, the data was imported into an Access database for compilation. For each SD criteria, the total lengths of the network not meeting minimum SD levels were tabulated. Table 2.4 shows the results from both the existing (vertical SD only) requirement, and the alternative (both horizontal/vertical SD) requirement.
Table 2.4 Effect of different SD criteria on no-overtaking marking requirements.
SH
Total Lane Distance
(km)
No-OT Dist. (Vt Only) (km)
% Vt Only SD No-OT Dist. (Both Hz/Vt) (km) % Both Hz/Vt SD Relative Increase *
02X 290.1 77.3 26.6 189.5 65.3 2.45
02Y 937.3 194.3 20.7 696.2 74.3 3.58
02Z 503.4 76.9 15.3 300.2 59.6 3.91 06X 227.3 45.6 20.1 170.8 75.1 3.74
06Y 997.5 271.6 27.2 711.4 71.3 2.62
06Z 1055.2 256.4 24.3 727.9 69.0 2.84
1NY 593.2 169.1 28.5 470.7 79.3 2.78
1NZ 965.8 172.2 17.8 555.4 57.5 3.22
1SX 630.3 123.7 19.6 504.6 80.1 4.08
1SY 681.6 93.5 13.7 249.0 36.5 2.66 1SZ 381.4 82.2 21.5 221.3 58.0 2.69
Total 7263.0 1562.7 21.5 4796.9 66.0 3.07
No-OT Dist. – no-overtaking distance; Vt – Vertical; Hz – Horizontal * Increased length of markings relative to existing vert. SD-only criterion.
•
This table shows that a change to a criterion involving both horizontal and vertical SD restrictions would produce a significant increase in the amount of no-overtaking lines marked, being approximately three-fold. Conversely the figures can also be interpreted as a >50% reduction in lengths having adequate passing SD. At this broad scale, no discernible trend is evident that shows how routes in different terrain are affected by the change in criteria.
section of SH1S between Blenheim and Kaikoura. This section was recently the subject of a passing lane study undertaken by Opus, so data were available on obstructions along the route and sight distances had been calculated on this basis. An additional RGTRA run, using the slightly less restrictive offset of 10m each side, was also carried out and analysed. The table below compares these data with the data calculated above.
Table 2.5 Effect of obstructions on no-overtaking marking requirements.
Criteria No-OT Dist. (km)
% of SH Marked
Relative Increase*
All of SH1S Blenheim-Kaikoura 269.2 – –
Existing Vert SD Only (1000m offsets) 60.5 22.5 1.00 Combined Horiz/Vert SD (5m offsets) 214.5 79.7 3.54 Combined Horiz/Vert SD (10m offsets) 88.8 33.0 1.47 Adjusted Horiz/Vert SD (actual offsets) 120.0 44.6 1.98 * Increased length of line markings relative to existing vert. SD-only criterion.
It is apparent that the 5m offset used for assessing the combined horizontal/vertical criterion is rather extreme when compared with more realistic offset data. On the other hand, using a 10m offset instead would be too conservative. The picture is complicated by the fact that different highway sections will produce different comparisons. But the data above suggest that the expected increase in no-overtaking markings might be more like a two-fold increase, rather than the three-fold increase suggested previously using the 5m offsets.
A caveat on the above findings is that the tabulation involved a simple assessment of each 10m segment as to whether it met the minimum SD requirement. The actual criteria specify minimum continuous lengths of road that are required before lines are marked. Therefore isolated sub-standard segments would not be marked but would be recorded in the above tallies. In practice, sight distances are not erratic, tending to slowly fall as an obstruction is approached, so isolated sub-standard segments are rare. This is balanced a little by the sections of no-overtaking lines, near enough to each other to be marked continuously through, that would not be reflected in the above tallies.
Another point to remember is that this broad-based analysis does not consider any local effects of small towns, side roads, opposing passing lanes, or narrow bridges, on overtaking provisions. Irrespective of which SD criteria are used, all these features are likely to decrease the effective amount of reasonable overtaking areas.
2.3.2 Assessing the Effects on Safety & Efficiency
The scenarios were tested using ARRB Transport Research’s TRARR 4 modelling package. This software is designed to simulate vehicles travelling on rural roads and is generally used to test the effects of providing realignments and passing lanes. Key outputs include mean travel times and the number of overtakings completed.
In defining a road file for TRARR, the user can specify sections of road with no-overtaking (or “barrier”) lines. By basing these sections on the different marking criteria, different road files can be used to compare the effect of increased no-overtaking lines. TRARR’s standard no-no-overtaking line is designed so that no vehicle infringes on it. However, an “intermediate” level of no-overtaking line allows some vehicle types (e.g. “sporty cars”) to be allowed to overtake where other passing criteria are satisfied. This would reflect what in reality often happens on the road. Simple sensitivity testing of the effects of no-overtaking compliance rates on outputs was checked, and is discussed after Figure 2.11. Initially however, all vehicles were assumed to comply with the markings.
Typical “flat”, “rolling” and “mountainous” terrain road sections were created for modelling vehicle interactions using TRARR. The highway data selected was used in previous research into passing demand (Koorey & Tate 1997). Each of the three terrain types were defined by average values for gradient (in terms of total rises/falls per km, or “hilliness”) and curvature (in terms of degrees per km, or “bendiness”), using criteria specified by McLarin (1997) and based on the Project Evaluation Manual definitions (Transfund 1999). Highway sections that met these criteria were
taken from a database of New Zealand State Highway Road Geometry (Cenek et al. 1997). Road sections of 50km length were created for each terrain, comprising ten 5-km sections from various state highways that had the most appropriate levels of “bendiness” and “hilliness”. In each case the overall average gradient and curvature values were very close to the specified values. No-overtaking lines were inserted in the road files, based on sections that did not have at least 330m of clear sight distance, depending on the given criteria.
A range of traffic volumes (between 50 and 1000 veh/hr two-way) was simulated to determine outputs as a function of volume. A “typical” heavy vehicle composition of 10% was used throughout. Initial bunching levels (i.e. the proportion of vehicles following others) were set that increased with volume (based on findings from another part of this research project) ranging from 5% to 59%. Simulation times were adjusted for each volume so that approximately 2000 vehicles (two-way) were modelled and analysed in each case.
All up, 54 basic combinations were simulated using TRARR (9 volumes × 2 SD criteria × 3 terrains), plus some additional runs that were made to check the sensitivity of changing no-overtaking compliance. Batch routines were used to automate the running and compiling of the simulations, with the final results analysed in Excel.
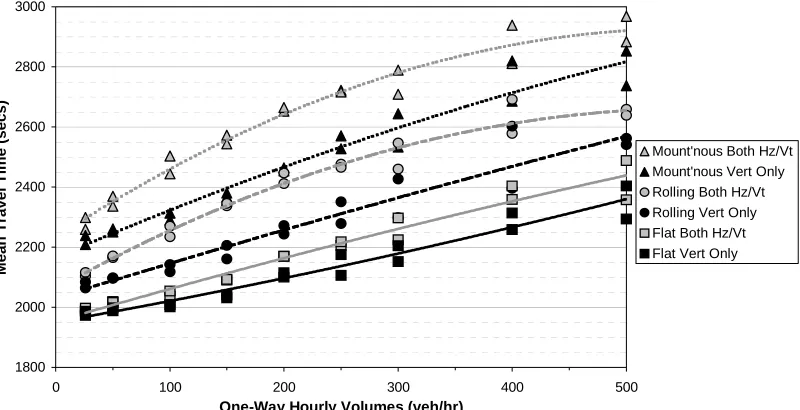
criteria increases mean travel times by up to 9%. For flat, rolling, and mountainous terrain the averages are 2.7%, 5.3% and 5.8% respectively. The greatest effects are found with traffic volumes of 150-300 veh/hr; higher volumes tend to be more constrained by other traffic irrespective of actual passing opportunities.
Figure 2.9 Mean travel times with changing SD criteria.
1800 2000 2200 2400 2600 2800 3000
0 100 200 300 400 500
One-Way Hourly Volumes (veh/hr)
Mean Travel Tim
e
(secs) Mount'nous Both Hz/Vt
Mount'nous Vert Only Rolling Both Hz/Vt Rolling Vert Only Flat Both Hz/Vt Flat Vert Only
Figure 2.10 (using same conventions as in Figure 2.9) shows the average overtaking rate for each situation. Overtaking rate is defined as the number of successful overtakings per vehicle per kilometre travelled. For example, with a rate of 0.10 along 3km of road, 200 vehicles/hr would be expected to complete 60 (= 0.1×3×200) overtakings per hour.
Figure 2.10 Average overtaking rate with changing SD criteria.
0.00 0.05 0.10 0.15 0.20 0.25
0 100 200 300 400 500
One-Way Hourly Volumes (veh/hr)
Overtaking Rate (O'takgs/veh/km
)
[image:33.595.103.508.511.736.2]The plots show that overtaking rates tend to initially increase with volume until opposing traffic limits the ability to overtake. Likewise, more rugged terrain limits overtaking opportunities, although it is interesting that little difference between results for rolling and mountainous terrains is shown. A change in SD criteria significantly reduces overtaking rates, particularly for the rolling and mountainous terrains. Flat terrain rates reduce by about 20%, while for other terrains the reduction is at least 50% and also it is more noticeable with increasing volumes.
Not directly evident from this is the effect that the reduction in overtaking has on safety. Intuitively however, the reductions above understate the improvement in overtaking safety. This is because many of the previous overtakings now not undertaken would have been of the more “dangerous” variety, i.e. those most likely to lead to crashes because they have occurred in unsuitable locations.
Another way to consider the effect on safety and efficiency is to look at driver frustration as a result of more time spent following other vehicles. Figure 2.11 (using the same conventions as in Figure 2.9) shows how the percent of time spent following (PTSF) changes for each situation. Note that, as TRARR does not always accurately model PTSF for low volumes with long simulation times, results below 100 veh/hr have been excluded.
Figure 2.11 Percent of time spent following (PTSF) with changing SD criteria.
0 20 40 60 80 100
0 100 200 300 400 500
One-Way Hourly Volumes (veh/hr)
%
of Tim
e
Spent Following (%
)
Mount'nous Both Hz/Vt Mount'nous Vert Only Rolling Both Hz/Vt Rolling Vert Only Flat Both Hz/Vt Flat Vert Only
As expected, PTSF generally increases with volume and more rugged terrain (although there is little distinction between rolling and mountainous terrain at high volumes). A change to a combined SD criterion results in an average 20-30% increase in PTSF, with greater effects at lower volumes. This will impact in terms of driver congestion benefits, as outlined in Transfund’s Project Evaluation Manual
Given the known proportions of the national roading network with each category of terrain and volume, the above findings could be scaled up to represent likely findings for the whole country. Although the changes in overtaking rates and, to a lesser extent, PTSF are significant with a move to a combined horizontal/vertical criteria, the impact on overall travel times is not as substantial.
2.3.3 Assessing the Effects on Driver Compliance
The above TRARR simulations are based on the assumption that all drivers obey the marked no-overtaking restrictions. In reality there is likely to be a minority of drivers who choose to ignore the markings and rely on their judgement, particularly if they feel they have a vehicle with greater-than-average acceleration. TRARR recognises this by means of a “compliance” parameter to specify which vehicle types modelled will obey the markings. Normally four vehicle sub-classes (representing different “types” of driver) making up 33% of the car stream are set to ignore markings by default in the simulations.
To assess the sensitivity of the above results to this scenario, a repeat run of TRARR simulations was done at 500 veh/hr (two-way) using the default TRARR compliance parameter values. In theory the effect of this should be to increase overtakings and reduce travel times. The net result however was not very significant: overtakings increased by no more than 9.8% and this only translated into mean travel time reductions of no more than 1.1%. In fact, in a couple of the simulations the results were slightly worse than previously. When looking at the effect of driver compliance on the change between vertical criteria and horizontal/vertical criteria, the resulting changes were very similar to the findings described in Sections 2.3.1 and 2.3.2.
A reasonable theory could be that driver compliance would get worse with the introduction of a stricter and more widespread no-overtaking criterion, especially without any equivalent increase in enforcement. However, even changing from a vertical SD criteria with strict compliance, to a combined SD criteria with moderate compliance, produces a very similar result to the previous plots (Figures 2.9-2.11). Therefore, unless actual driver compliance is in fact far worse than modelled, it is not a significant factor when considering alternative no-overtaking marking criteria.
For comparison, a review was made of overseas studies that have investigated driver compliance. Lyles (1982) tested different combinations of no-overtaking markings and signs (commonly used to denote no-passing zones in the US) for driver compliance. This was achieved by driving along selected lengths back and forth at a constant speed and observing overtaking vehicles. Lyles found that almost half of all passing manoeuvres started in no-passing zones when only pavement markings were present, although only 30% when unopposed by oncoming vehicles. Compliance improved noticeably when signs were also present, with 20%-40% not complying (10%-20% when unopposed).
no-Although these studies are not entirely comparable with New Zealand road conditions, given the differences in signing, marking and general availability of passing opportunities, they indicate that non-compliance of no-overtaking markings can be a significant effect. They also indicate that modelling with the TRARR default values probably provided more typical indications of the true effects.
2.4 Discussion
There is reluctance in New Zealand to mark every section of highway limited by poor horizontal SD for at least two reasons. First, drivers are assumed to be better able to identify that an oncoming horizontal curve will obstruct their sight distance, whereas many vertical curves are more subtle. Second, the concern is that in marking every technically required no-overtaking section, the net effect of the markings will be diluted and lead to poorer compliance overall. Both these arguments need further examination.
The fact that New Zealand policy makes the distinction between vertical and horizontal sight distances however, is evidently a cause for much concern nation-wide, as evidenced by the findings of a recent survey on no-overtaking line standards (LTSA 2000). As well as horizontal curves, Road Controlling Authorities interviewed in the survey had concerns about current eye and object heights used, consideration of different speed environments, and the level of discretion allowed for marking no-overtaking lines.
Recent sight distance theory has introduced the concept of “Intermediate Sight Distance” (ISD). This distance is less than the computed sight distance required for overtaking, but better reflects when drivers will consider overtaking. ISD is defined as twice the stopping sight distance, which thus allows a person attempting to overtake sufficient time to abort an overtaking manoeuvre should an oncoming vehicle appear. ISD varies with travel speed, and Table 2.6 lists rounded ISDs for various speeds, assuming a reaction time of 2.5 seconds and a level grade.
Table 2.6 Intermediate sight distances (ISD) at different speeds.
Travel Speed (km/h) Rounded ISD (m)
50 130 60 170 70 220 80 270 90 340 100 410 110 500 120 570
The overtaking rate surveys were carried out in areas where insufficient safe overtaking sight distances are available for most vehicles. (Although based on 330m criteria, the surrounding speed environments also gave similar ISDs.) The surveys did not identify whether the overtaking that was recorded was a result of poor or risky judgement by the drivers, more powerful overtaking vehicles, or slower than normal overtaken vehicles (as the latter two situations were likely to be safe in many cases). Certainly all three situations are likely to have occurred and will continue to do so even if markings are changed.
Situations, like the sites surveyed, highlight a need to distinguish between the isolated horizontal curve and the continuously curved, winding environment. The latter probably needs no markings to restrict overtaking because the sight distance never increases sufficiently for drivers to consider the possibility of overtaking. With isolated curves however, the approach section may provide an adequate opportunity to overtake. The critical information to convey to the driver is where along the approach does the remaining clear distance fall below the safe overtaking distance. Given the higher speeds likely on many approaches, the information is even more significant.
A short straight, such as those surveyed, may not meet the overtaking criteria at all but its appearance may suggest otherwise. If the straight is in the middle of an otherwise winding environment, drivers may also be more tempted to try to use it to overtake. This situation probably warrants marking no-overtaking lines where the length does not meet the ISD, yet does not fall far short. One possible criterion could be to mark sites where the available sight distance is between half the ISD (equivalent to the stopping sight distance) and the ISD. For example, a short 300m straight in a 90-km/hr speed environment would be marked fully with no-overtaking markings. If the straight was 600m long, only the last 340m would be marked and not necessarily right to the curve. If the straight was only 150m long, no marking would be deemed necessary.