University of Warwick institutional repository: http://go.warwick.ac.uk/wrap
A Thesis Submitted for the Degree of PhD at the University of Warwick
http://go.warwick.ac.uk/wrap/74459
This thesis is made available online and is protected by original copyright. Please scroll down to view the document itself.
THE USE OF PSEUDO-RANDOM BINARY SEQUENCES
IN GAS CHROMATOGRAPHY
by
GEOFFREY C. MOSS.
A Thesis presented for the degree of Doctor of Philosophy of th~ University of Warwick, Department of Engineering Science.
ACKNOWLEDGEMENTS
The author would like to express his sincere
thanks to all those who have been associated with the various sections of this research programme. In particular, K.C. Ng., B.Sc., Ph.D., is to be warmly thanked for his spirit of encouragement and helpful discussions. The cooperation of Hewlett Packard Ltd., SOl'~h Queensferry, has been sought at various times and the author is g~ateful for the facilities extended to him.
Thus the prospects open up for the construction of a new method of physical separation of various subGtanccs pre-sent in organic liquids. The method is based on the ability of soluble substance to mix with various solid mineral and organic substances to form physicul adsorption compounds ...•..
Similarly to light beams in the spectrum the
different components of a comDlex pigment are regularly dis-tributed one after another in the adsorption column and thus lend themselves to qualitatcve and quanti tati ve analys is. I have called such a multi-coloured preparation a CHROMATOGRAM
and the respective method of analysis a CHROMATOGRAPHIC METHOD •.••
Mikhail Semenovitch Tswett
ABSTRACT.
Techniques of conventional chromatography do not always give convenient results. Analyses are often
contaminated with detector noise and baseline drift. Ccn-tinuous analysis is not possible and anomalous detector response can occur. This repoI'"tproposes a method which
overcomes these difficulties to a certain degree. A pseudo-random sequence controls the injections into a conventional
INTRODUCTION
In conventional gas or liquid chromatography, a discrete injection gives rise to a sample analysis when one elution time has elapsed. Further analyses require further injections. To obtain the most frequent, separable analyses, one injects once per net settling time. The time separation of each analys is can cause stability problems in associ.o.ted closed loop control schemes,moreover, simple open loop monitoring
becomes difficult. In addition, sources external to the process can cause extraneous noise to appear in the detector outputs. (Industrial chromatographs a.l.'eparticularly prone to noise1). Noise can also result from imprecise carrier flow settings, and detector power supply variation. As the lower limit of detection is set by noise levels, this subject is of importance in laboratory work. Accurate analyses also require that the base-line have long term stability, and elabor-ate procedures are necess~~y to achieve the low drift rates
required2•
These problems may be somewhat allievated if the injecting sequenc,e is modir'ied. Chapter 2 of this thesis demonstrates that if the input is chosen to be a pseudo-random binary sequence, correlation between input and output yields the desired analysis to Nithin a constant factor.
Correlation being an averaging process, this approach has the power to reduce variance in the estimates of sample components. Thus if the detector output is =ontaminated with noise,
illustrates this with an analysis of an hydrocarbon sample.
The removal of the effects of base-line drift is discussed in Chapter 2 and requires a slight modificatjon of the basic technique. Chapter 2 also notes that some care is necessary when choosing the apparatus so that, the detector is not operated in a non-linear region. The drastic effects of non-linearitles in the correlation technique are illustrated wit:~1some practical examples. The effect of sample valve non-lineari·ty is also discussed.
Chapter 3 presents several methods of removing the effects of anomalous detector characteristics, first discussed
in
Chapter 1. The use of one of these methods, (Hadamard-modified sequences) is illustrated by application to analysisof hydrogen in helium, and acetylene in n~trogen. The Kathero-meter detector characteristic for these cases possesses a
turn-ing point, and conventional chromatography gives results which are difficult to interpret. The proposed method allows a use-ful analysis to be made fairly easily.
Chapter 3 also demonstrates how to extend the basic p.r.b.s. approach .so that simultaneous analysis of several inde-pendent sample streams may be made with one detector and one column. Another extension of the technique deals with the possibility of analysing samples with time varying concentra-tions.
capability of a small computer, but this 1S not in itself a disadvantage since the method can hanule several complete chromatograph systems simultaneously. The number of systems controlled is set only by the number of analogue inputs and the speed of analogue to digital conversion. Approximately 18K of store would be required to service 15 chromatographs and display 500 data points for each. It has been shown3,
that in conventional chromatography, a computer is financially viable when it controls 15-30 chromatography units.
REFERENCES
1.
2.
3.
Collyer, L.M., Hawkins,L.H.C., Thomson, G.H., Some Hardware Aspects of Computer Aided Gas Chromatography.
Paper given at Conf. on Lab.Automation, Middlesex
Hospital Nedical School, 10-12 November 1970, organised by I.E.R.E.
Knox, J.H., Gas Chromatography, pp 66- 68, ;·iethuen& Co., Ltd., London 19E~.
CONTENTS
ACKNOWLEDGEMENTS
ABSTRACT
INTRODUCTION
INDEX ,
,
CHAPTER 1 THE CONVENTIONAL GAS CHROMATOGRAPH
LIST OF PRINCIPAL SYMBOLS 1.1
1.5 1. INTRODUCTION
THE COMPONENTS OF A CHROMATOGRAPHY SYSTEM 2.1 DRYER AND FLOW REGULATOR
2.2 INJECTION DEVICE 2.3 THERMOSTATTED COLUMN
1.9 1.10
2. 1.8
1.8
2.4.1 DETECTORS 1.11
2.4.2 THE THERMAL CONDUCTIVITY CELL (KATHEROMETER) 1.13 2.4.3 ANOMALIES IN THE KATHEROMETER RESPONSE 1.16 2.4.4 THE FLAME IONIZATION DETECTOR (F.I.D.) 1.18 2.4.5 ANOMALIES IN THE F.I.D. RESPONSE 1.20
3. THE KINETICS OF GAS CHROMATOGRAPHY
3.1 THE EFFECT OF TEMPERATURE ON COLUMN PERFORMAN CE
3.2 THE EFFECT OF SO:'~UTECONCENTRATION ON ELUTION PEAKS
1.21
1. 23
4. APPENDICES 1.25 A.I GLOSSARY OF GAS CHROMATOGRAPH I C
TERMINOLOGY 1. 25
A.2 PROBABILITY OF A NOISE PEAK EXCEEDING
TWICE THE NOISE DETECTION BAND 1.28 A.3 SENSITIVITY AND LIMIT OF DETECTION OF
SOME DETECTORS 1.29
5. REFERENCES 1.30
6. ILLUSTRATIONS FOR CHAPTER 1 1.34
CHAPTER 2 THE USE OF CORRELATION TECHNIQUES
" LIST OF PRINCIPAL SYMBOLS 2.1
1. INTRODUCTION 2.4
2. IMPULSE RESPONSE ESTIMATION 2.6
3. CROSSCORRELATION APPLIED TO GAS CHROMATOGRAPHY 2.9 ~. BRIEF REVIEW OF EARLY EhPERIMENTS BY OTHER
WORKERS 2.13
S. BRIEF REVIEW OF INITIAL ANALYSES CONDUCTED
BY THE AUTHOR 2.15
6.
5.1 HYDROCARBON ANALYSIS
CONSIDERATION OF NON-LINEARITIES 6.1 SAMPLE VALVE NON-LINEARITY 6.2 COLUMN NON-LINEARITIES
6.3 DETECTOR NON-LINEARITIES 2.20
2.15 2.17 2.17 2.19
7.
8.
EXPERIMENTS USING MODIFIED APPARATUS 7.1 NITROGEN SAMPLES
7.2 HYDROCARBON SAMPLES
THE EFFECT OF EXPERIMENTAL CONDITIONS ON
COLUMN PERFORMANCE 2.27
B.l THE EFFECT OF FLOW RATE ON H.E.T.P. 2.2B B.2 THE EFFECT OF TEMPERATURE ON RETENTION 2.28
9. APPENDICES 2.31
B.l IMPULSE RESPONSE ESTIMATES FROM NOISY
DATA 2.31
B.2 THE EFFECT OF BASE-LINE DRIFT ON IMPULSE
RESPONSE ESTIMATES 2.35
B.3 THE ESTIMATION OF ERRORS CAUSE])BY UNEQUAL
DELAY TIMES IN THE INPUT TRANSDUCER 2.40
10. REFERENCES 2.46
11. ILLUSTRATIONS FOR CHAPTER 2 2.4~
CHAPTER 3 ADVANCED STUDIES IN CONTINUOUS GAS CHROMATOGRAPHY
"
LIST OF PRINCIPAL SYMBOLS 3.1
1. INTRODUCTION 3.3
2. IDENTIFICATION OF A CLASS OF NONLINEAR SYSTEMS USING
PSEUDO-RANDOM BINARY SEQUENCES 3.5
2.1 THE USE OF A LINEARISING NETWORK 3.6
2.2 THE USE OF INVE~SE REPEAT SEQUENCES 3.7 2.3 TECHNIQUE USING HADAMARD-MODIFIED SEQUENCES 3.3
2.3.1 THE USE OF HADAMARD-MODIFIED SEQUENCES
IN GAS CHROMATOGRAPHY 3.11
2.3.2 ESTIMAT:ON OF THE LINEAR IMPULSE
RESPONSE FROM SECOND ORDER WEIGHTS 3.12
2.3.3 THE TOTAL EXPERIMENT TIME 3.16
3. MULTI-STREAM ANALYSIS 3.18
4. ANALYSIS OF SAMPLES WITH T:ME VARYING
CONCENTRA-TIONS - 3.21
6. APPENDICES 3.27 APPENDIX C.l THE USE OF INVERSE REPEAT SEQUENCES
IN CROSSCORRELATION 3.27
APPENDIX C.2 THIRD ORDER AUTOCORRELATION FUNCTIONS OF INVERSE-REPEAT SEQUENCES 3.30 APPENDIX C.3 THE USE OF nADAMARD-MODIFIED
'rn'
SEQUENCES TO REMOVE THE EFFECTS OF NON-LINEARITIES ON PROCESS
CROSS-CORRELATIONS 3.39
APPENDIX C.4 ALTERNATIVE MODIFYING SEQUENCES 3.45 APPENDIX C.S CONTINU,)US UPDATING OF A TIME VARYING
SYSTEM USING P.R.B.S. 3.51
7. REFERENCES 3.57
8. ILLUSTRATIONS FOR CHAPTER 3 3.59
CHAPTER 4 CONCLUSI-ONS
1. CONCLUSIONS
SUGGESTIONS FOR FURTHER WORK
4.1
2. 4.2
3. REFERENCES 4.5
LIST OF PRINCIPAL SYMBOLS
SUBSCRIPTS
r
i
io
o
SYMBOLS S
R
Q
A C
D
1.1
DESIGNATION
denotes reference stream
denotes 1.th samp e ln samp el' 1 / carrier mixture
denotes mixture of ith sample and carrier
denotes carrier in sample/ carrier mixture
INTERPRETATION
detector sensitivity in mv/ Millimole/mI.
detector output in mv.
concentration of subscripted component in Millimoles/ml.
minimum detectable concentration in Millimoles/ml.
upper limit of concentration on linear portion of detector charac-teristics in Millimoles/ml.
peak area in cm2•
recorder sensitivity in mv/cm of chart.
f,E
flow rate of coLumn effluent in mIs/min. corrected to detector temperature and pressure.R .1vi.R • Relativ2 Molar Response
w total weight of sample
intro-duced into the column in mgms.
Rn peak to peak noise level in
detector output".
temperature of k~theromctcr ~ilament in subscripted gas stream.
q total katherometer cell heat
intake
internal cell radius filament wire radius cell length
molar heat capacity of sub-scripted component
dN
dt mole flow rate
y mole fraction of subscripted
component
b molecular collison diameter of
M
subscripted component
molecular weight of subscripted component
k thermal conductivity of
1.3
z
peak ordinateZ
IDA. X maximum peak ordinate
x displacement from centre of
peak
a standard deviation
peak width at 0.368 of peak height
peak width at half peak height base width of peak found by
ex-N
trapolating tangents at inflexion points
peak area/peak height
number of theoretical plates in W'
a column
H.E.T.P. height equivalent to a theoretical
plate
constant of the order of unity
y
average particle radius
con8tant of the order of unity
r
diffusion coefficient of \apour in gas phase diffusion coefficient of vapour
in liquid phase
K partition coefficient
p
average liquid film thickness true linear gas velocity at column temperature (oK) and
a
T
standard pressure
1.4
t co]umn temperature in
°c
ambient temperature a.n 0"
1'-pressure correction factor gas hold up
retention volume net reten~ion volume
specific retention volume density of liquid phase weight of liquid phase
p vapour pressure exerted J'Y
subscripted component o
p vapour pressu~e of pure
sub-scripted component at given temperature
v activity coefficient of pure
1.5
1. INTRODUCTION
The origins of chromatography are thought to be in the work of a Russian botanist Tswettl. His interest lay in examining green leaf pigments he had extracted by a process using petroleum ether. Pouring the petroleum ether-pigment solution into a vertical tube, (column) con-taining powdered calcium ~!urbonate,(fixed phase) resulted in adsorption of the pigments by the calcium at the top of the column. To wash them down, further petroleum ether was added, causing the components of the mixture to separate into coloured bands as they moved at different speeds down the column. The experiment became known as
'colour writing' generatin~ the title chromatography from the Greek 'chroma' for colour and 'graphein' to write.
The use of a solid fixed phase as adsorber gives the technique the title of 'adsorption chromatography'. The first significant advance was in 1942 when Martin and Synge2 formulated 'partition chromatography', wherein the
com-, C
.I-.u
ponents remain ln the fixed phase longer than others. Since only those molecules of sample in the mobile phase at any instant can move down the column, a gradual separ-atl0n of components occurs. Molecules aggregate into bands whose velocity is the average velocity of the mole-cules, and if the process continues for a sufficient time, complete separation occurs.
It is true to say that Fr~ction of molecules in
= rate of movement of band
mobile phase at any instant rate of movement of mobile phase
This fraction is 'determined only by the partition*coeffi-cient, and the weights 6f the different substances. Sub-stances with different partition coefficients move at differ-ent speeds and therefore separate.
The next advance in partition chromatography came in 1952 when James and Martin3studied the use, of gaseous mobile phases (carrier gas). They were able to separate fatty acids using nitrogen carrier and a column containing silicone oil supported on kieselguhr. However tney used automatic titration (an integrating device) for detection, a method which proved to have many practical disadvantages. In 1954 Ray4 introduced katherometric detection and fr~m then on gas chromatography became a common analytic tool.
1.7
KCltherometers measure the differential thermal conductivity of the colunm effluent and a reference slTeam. As a general detector this method is excellent but the low-er limit of detection (1 part in lOG of carrier),tended
to limit the power of the technique. Thus 1958 saw tl:c invention of two further detectors whose sensitivities are a factor of 103 greater. Th·~se were the Lovelock argon detectorS and the McWilliam flame ionization detector6, both of which ionize the sample gases. This ionization occurs more readily with organic molecules than tb.; us uaL carrier gases (helium, argon, hydrogen, and nitrogen). It is, therefore, possible to detect much smaller organic samples and use less stationary phase than was possible with earlier detection techniques.
Nowadays gas chromatography is sophisticated enough to handle satisfactorily samples ranging between
-8 -2
1.8
2. THE COMPONENTS OF A CHROMATOGRAPHY SYSTEM
Fig. 1.
A basic chromatography system is shown in
High pressure carrier gas flows through a drying tube and a regulator into an injection device where it collects the sample for analysiso The carrier and sample mixture then passes into the column which separates th~
~dmple components. The column effluent flows into a detector whose output is amplified and displayed. Ea~h system component is considered in more detail in the fol-lowing sections.
2.1
THE DRYING TUBE AND FLOW REGULATOR
The dryer is an essential piece of apparatus since water is a component far from inert, and all gas samples must be dry before they enter the column.
1.9
transient pressure spikes can result on injection. To ensure equalisation of flowrates Keulemans7 reconm~nds the use of a soap film meter for setting up.
2.2 INJECTION DEVICE
The elution peaks, which should be as narrow as possible,are sensitive to injection techniques. In theory there are two limiting ways in which sample vapour can reach the first plate* of the column
:-(a) As a 'plug' without dilution by the carrier which follows with a sharp interface.
(b) Due to mixing of vapour with carrier, ~3
a vapour-carrier mixture with an exponen-tially increasing sample concentration, which reaches a maximum and then decays
;'
exponentially.
It has been shown8 that column efficiency increases
for rising concentration and decreases with increasing sample size. Thus the narrowest elution bands (sharpest separa-tions) are obtained with ~mall, highly concentrated 'plug' injections. In practice the various methods of injection give flow profiles somewhere between the extremes, but one tries to achieve 'plug' flow. The general approach is to trap the sample in a loop which is then flushed through
with carrier. The sample tube must be narrow and the column dead space small.
1.10
The 'trapping' is achieved by microsyringe or multiport valve although syringes are most common for
9
liquid samples. Syringe volume is usually 1-50~1, the sample being rapidly vapourized in a preheater (50 to IOOoC hotter than the colu~~) before being flushed through by the carrier. Multiport valves operate on the principle shown in Fig.2, and as Dal Nogare9 points out,
it is essential to ensure that the valve materials used do not adsorb the sample gases,thereby exhibiting a memory effect, or introducing tr~ilin~ by desorption of sample components. One manufacturer (LOENCO) quotes the repro-ductivity of the sample volume as ± 0.5%.
2.3 THERMOSTATTED COLUMN
Columns are-constructed using either glass, copper, aluminium or p.v.c. and are I-2m. long with a q-6 mm. internal diameter. The tube is bent into a
u,W
or helix shape, having first been packed with a liquid stationary phase spread over an inert support. Since the aim of the column is to provide a liquid film with as l~ree an interface as possible, the support is chosen with a large specific surface. The liquid film is also required to have a low adsorptive activity so that it does not affect the elution peaks adversely by contributing10
to the partition process • Unless the sample is gaseous or a very volatile liquid, the column is not normally
1.11
rate of the carrier gas e.g for accurate measurements of re-tent ion volumes the column temperature must be uniform and steady to within 0.1 degree Cl~ In addition temperature gradients should be avoided, hence columns are placed In stirred air ovens whose set points are adjustable.
~.4.l DETECTORS
In order to evaluate the performance of a detp~tor tome discussion on the concepts of sensitivity and detection
12 13
limits is warranted. Young and Johnson and Stross hav2
treated these congepts extensively and the following embcdies their wor-k, Fig. 3 is a plot of detector response again~t sample concentration and gives the change 6R corresponding to the change 6Q in concentration.
the sensitivity is given by
Thus for any detector
s
= (1)Above a maximum solute concentration Ql' the global char-acteristic is non-linear. Qm is the minimum concentration capable of detection to within a particular confidence level.
14
Dimbat,Porter and Stross propose the alternative expression
s
=
ACDEw (2)15
which has been modified by Rosie and Robinson to incol'-porate relative molar response factors so that the expression
16
becomes less dependent on experimental conditions • Thus
1.12
Young12 describes a method of estimating the limit of detection based on the assumption that the noise ln the detector output record obeys a guassian distribution. By measurement of the mean square value of the noise, the standard deviation of the dis~ribution is obtained. We arbitrarily chose a detection band of a size greater than two sTandard deviations of the noise, and give this band size the symbol R. The ~eak to peak excursion of most
n
noise peaks will lie within this band size (i.e. within -xa/2 to xa/2 in Fig.4). Using the table of the probabil-ity integral, this is equivalent to saying that for 95% of the noise peaks
peak to peak value < 2 x 1.96 x a
Choosing R appropriately, the probability of a noise
n
#'
peak exceeding 2R on one side of the base line is very
n
small and thus such a peak can be said to be a solute peak to within a defined confidence level.
Then (4) which yields ~ t
whose value depends on the confidence with which Rn is chosen. Appendix A2 shows the variation of
Om
with the fraction of peaks covered by the 2R band.n
that the variation shown is quite acceptable for purposes Young12 notes
of detector comparison.
Using the term pQ (analogous to ph. measurement)
m
1.13
of Q, Appendix A3 (from Young12) shows values of pQ
m m
for various detectors according to
= (l/Q )
m :. 2 (S)
Many detectors have been developed for gas chromatography, but only two are of significant practical importance.
These are described in some detail in the ensuing sections.
2.4.2 THE THERMAL CONDUCTIVITY CELL('~o.therometer)
The thermal conductivity cell (Katherometer), is widely used in gas chromatography owing to its ease of construction, cheapness and general application. It con-sists of a detector element placed in the stream of column effluent,and a matching el~ment in a reference stream. Each element forms one arm of a. Wheatstone bridge, the other arms being dummy elements or J"'.a.tching.resistors.The heated detector element is cooled by the carrier stream until a
binary,or pseudo-binary mi~·ture of eluted solute and carrier, pass over it. The rate of heat loss by the detector element changes, which causes a change in its resistance. The
change of resistance is a function of the instantaneous con-centration of sample components in the gas stream.
16 Following the development of Novak et al ,the useful detector response is effectively the temperature dif-ference between the times when the detector element is in the pure carrier stream,and that of the chromatogra~hic fraction
i.e.
R.
=
T Tf1.14
=
1
+
9
N Cp. /2 dt 1.01
l
----~-;----.- I
2L k + ddN Cp /2 ..JI
o t 0
(6)
k. lO
If L\k
=
k.lO ko and ~Cp
=
Cp.lO - Cp0Then
Tf·lO
=
Tfo +f~ (:~~
+ :~~: ) Trio +h
lO lO
2
(ai\k + ~ ) T
akio aCPio fio
+
---Fur-ther- if we deal with low soLute conoen tr-ertLons var-yi.ng within narrow limits
and tlCp « Cp
o
then Tf·~o ::
_q log (rc)
e rf [ 21fL
o.. -
k ) + dN (CPiO-CPo)]10 0 dt 2
(7)
To simplify (7) we need to express kio and CPio as functions. of the concentrations of the components in the column effluent.
The problem of expressing the thermal conductivity of a gaseous mixture in terms of the thermal conductivities of
17-21
its components,has been dealt with by a number of authors.
t(j
Novak suggests the use of the expression given by Wassiljewa17
k .~o =
k.
a +
l'
+ A. (Y. /Y )~o ~ 0
(B)
1 + A • (Y IY.)
LIS
Aoi is found by interchanging subscripts. Expanding k. as a series
10
k
=
k + 1io 0
IT
d k.
10
d Y.
1
1
(O)Yi + 2T d Y. 2 1
(0) Y?
1 +
---Terminating after the first two terms
k .
=
k +10 0 [kif Aoi ko AioJ Yi
(9)
For CPio we write
=
Cp + (Cp.- Cp ) Y.'0 1 0 1 (10)
kO A.
~o;
\+
dNdt
(Cp.-Cp
>]
lOy
2 i
(11) (2nL k + dN Cp 12)2
o dt 0
Novak16 shows further that the R.M.R.* is given by R.M.R.
=
Cp. - CPo 2nL (k./A . - k A. ) + dN ( ~
2 )
~ 01 0 10 dt
2nL (krfAor;- k0 Aro) + dN (CPr - CPo)dt 2
Rosie and Grob22 used benzene as the reference substance
assigning it a relative value of 100. This practice is still followed with the result that the R.M.R. of a number of compounds (in Helium) are known. Within a homologous series there is a linear relationship between the R.M.R. and the molecular weight22• The empirical equation is
R.M.R.
=
A + B.M where A and B are constants. Hence members of a homologous series can be determined1.16
tively from area per cents without the use of response factors.
2.4.3 ANOMALIES IN THE KATHEROMETER RESPONSE
So~e authors16;24 have noted that for light
c~rrier gases (helium, hydrogen), the thermal conductivity of the sample-carrier mixture varies linearly with sample concentration. Van de Craats2S, using n-Butane sample
demonstrated this to be true over u concentration range 0-10 mole
t.
In the case of the heavier nitrogen carrier however, linearity was poor even below 0.5 molet.
Thusin cases such as the latter,equation (9) has restricted validity (if any). For (9) to hold, implying a linear detector characteristic, the literature23,2S,26 suggests
that sample and carrier must have widely differing thermal conductivities. The use of tailored carrier gas~3 has also been proposed27• These latter are a mixture of gases
so chosen that the overall molecular properties such as mass, collision diameter and intermolecular constants,match those of the sample. Such carrier gases give linear de-tector characteristics over the normal range concentrations used in chromatography.
Even assuming a linear detector characteristic, examination. of (11) shows that there is a possibility of peak polarity reversal, when operating over a range of
1.17
temperatures. If at onc temperature ki/Aoi > Aio ko, it may be that at another temperature ki/Aoi < Aio ko.
If in equation (11), the thermal conductivity and thermal capacity factors are comparable at one temperature, then at the second, the detector response changes sign. Peak reversal occurs without any distortion of the peak. Fur-ther:. if reversal occurs, then th'::!reexists a temperature at which the response of the given configuration is very small or ze'Y'o.
Bohemen and Purnel128 have noted that the inverted peaks· they ob"tained were dLs torvred, However, since they used nitrogen carrier, it is unlikely that operation within the detectors' linear regime was possible at any temperature, i.e. all peaks would be distorted. Novak2~ suggests that if a peak becomes distorted on inversion,distortion occurs because of a curtailing of the range of detector linearity by the temperature change. Harvey and Morgan30 show this
effect for a methanol vapour-nitrogen mixture.
For some mixtures the detector characteristic is seen to exhibit a turning point. Under such conditions(9) does not hold because the Wassiljewa equation (8) is not applicable. The literature contains many examples of such behaviour including
:-(i) (ii) (iii)
helium in hydrogen26~31 acetylene in nitrogen24
1.18
3~
(iv) carbon dioxide ln nitrogen
Operating in such a regime causes the chromatographic peaks to be partially inverted to give M or W
shap8s26,30,3~,35,30,37,which are analytically uninter-pretable27•
In the particular case (i), the turning point is at 8 mole % hydrogen in helium, so Purcell and Ettre35 have suggested the use of an helium/hydrogen mixture(9l.S% helium and 8.5% hydrogen) as carrier. A single negative peak results for a hydrogen in helium sample but the range of linearity is limited. Panson and Adams36 suggest the use of small samples,and other authors38 consider that extensive calibration surmounts the problem. None of these approaches are particularly convenient.
2.4.4 THE FLAME IONIZATION DETECTO~ (F.I.D.)
1.J.9
ionize much more readily than do those of the normal carrier gases, hence the detector is used generally in hydrocarbon analysis. The hydrogen and air streams are filtered to remove alkali sa:ts and carbon compounds, which produce ion avalanches as they pass through the flame,and result in detector noise.
The preferential response to organic substances results in an ionization efficiency of one ion in 105
organic molecules, whereas for hydrogen the figure is as low as one ion in 1012 molecules. Hence it is nor-mally said that the detector has no response to hydrogen. Purnel139 lists a number of substances to which there is little or no response, and this includes hydrogen.
In general the detector response is proportional to carbon content, but this is not so for oxygenated and nitrogen containing compounds. These give a lower res-ponse than expected; thus extensive calibration is necess-ary. It should also be neted that the F.I.D. responds not to concentration changes, but to quantity of sample per unit time ,since sample~ are actually consumed by the flame.
The detector reaction voluma is of the order
. _12
1.7.0
of 0.5% by volume. These figures give a dynamic range of the order 107 Vlhich is confirmed by a recent study40.
2.4.5 ANOMALIES IN F.I.D. RESPONSE
Peak inversions have been noticed for concentra-tions by volume of 0.65% propane dnd butane in nitrogen41,
and 0.03% carbon disulphide in nitrogen42• This latter is interesting since carbon disulphide is one of those gases to which the F.I.D. is said to be insensitive; un-fortunately this has not been explained. Some modes of F.I.D. construction use a cathode electrode other than the jet9• The position of this cathode was seen to in-fluence the propane and butane inversion41, and also to limit linearity in the range of small concentrations. McWilliam42 shows further that the upper electrode spac-ing can influence linearity for high concentrations.
1.21
3. THE KINETICS OF GAS CHROMATOGRAPHY
Any sharp band injected into a column spreads as it passes down the column, the extent of the spreading being a measure of the inefficiency of the chromatographic process. A real column can be considered to behave as a series of distinct units or plates joined together. Init-ially all plates are connected and a plug dv of carrier is added to the fi.rst plate. This causes the gas phase to move as a plug a short dis tance down the column, n'-lda.it
amount dv to emerge from the last plate. As this happens, a small fraction of the contents of each plate is trans-ferred to each succeeding one. The plates are then dis-connected long enough for equilibrium to be established in each plate, and then reconnected for the process to be repeated. If the sample vapour is added to the first plate, addition of further small quantities of carrier gas elutes the sample dONn the column until it emerges from the last plate. During this elution,the amount of band spreading which OCCllrd depends solely on the number
1. 22
z
Zmax (13)
The situation is illustrated by Fig.5. The process is characterised by the following relations.
Be
=
212 0B! = 2.36 0
W
=
40 (14)W'
=
012TfV V V
N
=
(....E)2=
8 (...£)2=
16 (-E.)2o ee W
V V
=
S.S4(Sr)2=
21T ( r) 21
wr
An alternative approach taking into considera-tion the contribuconsidera-tions of the several separate effects in elution gives,(for a packed column)
H.E.T.P.
=
I.f.).r + + (15)~lich is often written
+ Cp (16)
The first term represents the effects due to mixing
caused by unequal paths around the particles and is often call~d the eddy diffusion term. Longitudinal diffusion in the gas phase gives rise to the second term,and the third is due to the slowness of mass transfer between the liquid and gas phases.
1. 2 3
note that the optimum is generally quite flat. However, it is desirable to work as close to the optimum as possible since this gives the minimum H.E.T.P. and makes full use of the separating power of ·Lh~ column. For nitrogen or argon as carrier, the optimum is in the region of 3-6 cm/sec and 10-20 cm/sec for hydrogen or helium.
3.1 THE EFFECT OF TEMPERATURE ON COLUMN PERFORMANCE
As far as (16) is concerned the major a:::.iect of temperature is through the variation in partition
coefficient. As temperature increas~s, K decreases, causing an increase of C and thereby decreasing the column efficiency. However the specific retention volume* varies with temperature according tolO
=
D + t+GF (17)where D,F and G are constants. Rence although low temperatures give h~ghest column efficiencies, they also cause longer retention times, and some compromise must be made.
3.2 THE EFFECT OF SOLUTE CONCENTRATION ON ELUTION PEAKS
In section 3, the partition coefficient is assumed to be independent of concentration, however
1. 24
there are conditions under which such an assumption is not valid. A volatile component of a solution exerts a vapour pressure above the solution which is expressed by
PI (18)
the mole fraction Y1 referring to ~he solute in solvent.
If the activity coefficient is unity, (18) becomes Henrys' law. Thus for a binary mixture which obeys Raoult's law
Cv
=
constant).
,
=..
.
• • p
the total vapour pressure p then varies with mole fraction according to Fig. 7a. However most real solutions deviate from Raoult's law and as shown in Fig.7b and Fig.7c, these deviations can be positive or negative. The deviations for components of a binary mixture.are always of th~ same ~5gn, wiTh positive deviations the more common. Fig. 8 shows the situation for components in two solutions, one exhibiting a po~itive and the other a negative deviation. In the region of very dilute solution, the curve is well approximated by its tangent at the origin. In this region (18) holds with a constant activity coefficient, and this is the region of interest in gas-liquid chromatography. For a constant
4. APPENDICES
APPENDIX Al.
, "r
...L. /_v
GLOSSARY OF GAS CHROMATOGRAPHIC TERMINOLOGY
1. MOLE
2.
MOLE-FRACTION
3. PARTITION
COEFFICIENT
CK)
~.
PRESSURECORRECTION FACTOR
(j)
fav fo
5. GAS
HOLD-UP
A 'mole' of sample is the mass of sample numerically equal to itb molecular weight.
The 'mole fraction' of a compon-ent is the ~atio of the number of moles of that component to the number of moles of mixture.
The 'partition coeffic1ent' of a two phase system is the ratio of the concentrations of solute in the liqu1d phase and in the gas phase, in a theoretical plate. Owing to the compressibility of the carrier gas, the average flow rate of the carrier is not the
same as measured at the column exit, they are related by
=
2'
3[ (pi/po)2 -1
(pi/po)3 -1
=
Al.Cl) After injection at t1me 0 of
Fig.5, a substance not adsorbed
6 • RETENTION VOLUME
7 • NET
RETENT-ION
VOLUME
(V ') I'
8. SPECIFIC
RETENTION
VOLUME
(Vs)
1. 2 6
distance OA converted to the total volume of gas which has flowed in the time 1nterval, is known as the gas hold-up of the column. It is physically equal to the 'dead' volume of the column and connect1ng tubes.
The volume of gas eluted out of t.ne column between the a.njecti.on at
o
and the appearance of the sample maximum at B is the retentionvolume of the subctance.
V 'I'
=
Note that VI' and Vg in AI.(2) are not the raw experimental values which are calculated on the basis of an outlet flow rate measured at ambient temperature and pressure, thus
= .
T J Ta[vrexperi_Vgexperi_l
mental mental
J
AI.(3) The specific retention volume is the net retention volume dividedby the weight
0;
stationary phase reduced to 0°c
t
i.e. V
=
VI' 273s
wI T
9. PEAK WIDTH
10. HEIGHT EQUI-· VALENT TO A THEORETICAL PLATE
(H.E.T.P.)
11. R.N\.R.
1.27
The specific retention voLuu-e is reJated to the partitJ.on
coeffi-cient by
K
=
Al.(S)The peak wldth can be measured in three ways
(a) at the inflexion points (8 )
P-(b) at the half peak height(\>.~) • 'i
(c) by extrapolation of tan-gents at inflexion pOlnts(W) The H.E.T.P.
=
length of column
No. of Theoretical Plates for a partlcular elut~on
1. 28
APPENDIX A2.
PROBABILITY OF A NOISE PEAK EXCEEDING TVIICE THE NOISE DETECTION BAND
% of Noise Peaks Probabi:i.ity of Noise Relative
included in detect- exceeding 2xband width Qrn
ion band on one side of baseline Vi).:.ue
99.9 < 1 in 1015 .'.• 28
99.0 < 1 l.n 1011 1.00
95.0 < 1 in 109 0.76
L 29
APPENDIX A3.
SENSITIVITY AND LIMIT OF DETECTION OF SOME DETECTORS
DETECTOR S ~ Qm pQm
1. L
&
N therm. 40,000 0.001 5x10-s
7.3C('lTId.ce11
2. Hot wire 40,000 0.01 5xlO-7 6.3
therm.cond. cell
3. Thermistor 25,000 0.01 SxlO-7 6.1
4. Ionisation 2.5xl06 0.02 1.6xlO-S 7.S Gauge
5. Flame ion- 7.4x10¹⁰ 0.07 1.9x10-1211.7 isation
6. Electric Dis- 2xl01O 20 2x10⁻⁹ 8.7 charge
7. Beta ion- 55,000 0.0125 5xlO-7 6.3
1. 30
5. REFERENCES
1. Tswett,M., Ber.deut.botan.Ges., 24,316,384(1906) Martln,A.J.P., Synge,R.L.M., Blochem.J.(London), 35, 1358(1941)
James,A.T., Martln,A.J.P.,Analyst,77,915,(1952) Ray,N.H., J.Appl.Chem. 4,21,82.(1954)
Love1ock,J.E., J.of chromatog.1,35,(1958:' McWilliam,I.G., Dewc~,R.A., Gas Chromatography 1958, ed. Desty,D.H.,London (Proc.of 2nd Sympos-ium on Gas Chromatography, Amsterdam,J.iay1958). A.l.M., Keu1emans, Gas Chromatography, Reinhold pub.corp; New York (1959),(second edition). p.59. (Soap film meter)
Deemter,J.J.Van, ZUlderweg,F.J., Klinkenberg,A., Chem.Eng.Sci. 5,271,(1956).
Dal Nogare, S., Juvet,R.S., Gas Llquid Chroma-tography Theori and Practice, Interscience Pub.
(1963) (second edition). p.177 (Sample slze) 2.
3. 4. 5. 6.
7.
8.
9.
p.l77 p.21S
(Valve design) (F.l.D.Cathode)
10. Ambrose, D., Ambrose,B.A., Gas Chromatography, Geo.Newnes,(1963) (second edition)
p.109 (Asymmetrical peakS)
p.SS (Effect of Temperature on Elution) 11. Knox, J.H.,Gas Chromatography, Methuen, London,
1962(first edition>
1.31
12. Young,I.G., Gas Chromatography, ed. Noebe1s, H.J., Wall, R.F., Brenner,N., Academlc Pres~, New York,(196l)
13. Johnson, H.W., StlOSS, F.H., Gas and Liquid Elution Chromatography, Quantitative Detector Evaluation. Anal. Chern,3~,7, July 1959.
14. Dimbat,M., Porter, P.E., StroGo,F.H., Appara-tus Requirements For Quantitative Application of Gas-L~quid Partition Chromatography, Anal. Chern.28, 3, 1956.
15. Robinson, D.W., Rosie, D.M., Paper No.2 present-ed at the Pittsburgh Conference on Anal. Chern., March 1964.
16. Novak,J., Wicar,
..
"
S.,
Janak,~ J., Predict~on of the Katherometer Relative Molar Response I. Coll.Czech. chern.commun. Vol.33, 1968. 17. Wassiljewa,A., Pnysik Z., 5, 737, (1904)18. Hirschfelder, .;.0., Curtiss, C.F., Bird,R.B., Molecular Theory of Gases and Liquids, Wiley,
London (1954).
19. Srivastava, S.N., Saxena, S.C., Thermal Conduc-tivity of Binary and Ternary.Rare Gas Mixtures. Proc.Phys.Soc.(London) 70B (1957) pp.369-378. 20. Tsederberg, N.V., Thermal Conductiv~ty of Gases
and Liquids, M.I.T. Press, Cambridge, Mass. 1965, pp.144-165 inc.
1.32
22. Rosie, D.M., Grob, R.L., Thermal Conductivlty BehaVlour, Anal. chern. 29, 9, (1957)
23. Lawson, A.E., Miller, T.M., Thermal Conductlvity Detectors in Gas Chromatography, J. of G.e.
Aug.1966o pp273-284
24. Keulemans, A.I.M., Kwant8s, A., Rijnders, G.W.A., Quantitative Analysis with Th~rmal Conductivity Detectlon in Gas LiqUld Chromatography, Analyti-ca Chimlca Acta Vol 16, 29, 1957.
25. Van De Craats, F., Some Quantitative Ar.·.ectsOf The Chromatographic Analysis Of Gas Mixtures Using Thermal Conductlvity As Detection Method. Gas Chromatography 1958, ed. Desty, D.H., Ac~dem-ic Press, New York.
26. Schmauch, L.J., Dinnerstein, R.A., Response Of Thermal-Conductivity Cells In Gas Chromatography, Anal.Chem., 32, 3, (1960)
27. Jordan, J., Ke~bekus, .B.B., Mixed Carrier Gases for Quantitative Chromatography: .A. Net-lApproach For Linearizing Thermal Conduct~vity Based on Kinetic Theory. Anal.Chem. 37,12,(1965) 28. Sohemen, J., Pu~nell, J.H., The Behavlour Of
Katherometers For Gas Chromatography In Carrier Gases Of Low Thermal Conductivity, J. Appl. Chern. 8, 1958.
1.33
30. Harvey, D., Morgan, G.O., Factors Affecting Thermal Conductivity Detectors In Vapou:rPhaS2
Partition Chromatography, Vapour Phase Chroma-toeraphy, 1956, ed. Desty, D.H., Academic Press, New York.
31. Hansen, R.S., Frost, R.R., Murphy, J.A., The
Thermal Conducti vity Of Hydrogen Helium Mixtureb, Jour. Phys. Chern.,68,7 (1964).·
32. Bennet, L.A., Vines, R.G., Thermal Conductivities Of Organic Vapour M1xtures, Jour. Chern. ?hys., 23, 9, (1955).
33. Rothman, A.·J., Bromley, L.A., High Temperature Thermal Conductavi ty Of Gases, Ind. Eng. Chem.,4·7, 5, (1955).
34. Baker, W.J., Zinn, T.L., W1se, K.V., Wall, R.F., Observations On The Anomalous Chromatographic Behaviour Of Hydrogen. Nat.lnstr,Soc.Arn. Symposium on Instrumental Methods Of Analysis, Houston, Texas, May 1958, ISA Proc.4.
35. Purcell, J.E., Ettre,L.S., Analysis Of Hydrogen With Thermal ConductJ.vity Detectors, J.of G.C. 3, 69, (1965)
36. Panson, A.G., Adams, L.M., Complete Gas Chroma-tographic Analysis Of Hydrogen In Fixed Gases And Hydrocarbons Using One Detector And Helium As Gas Carrier, J. of G.C., May 1964.
1.34
38. Castello, G., Blagani,E., Munari,S., The Quantitatlve Determination of Hydrogen in Gases by Gas Chromatography with Helium. as the Carrier Gas. ~.Chromatog., 20, (1965). 39. Purnell, H., Gas Chromatography, Wlley, 1962~
p.306 (Gases to which F.~.D.insensltive) p.302 (large sample8 and F.I.D.)
40.
Oster, H., Opperman, F., Llnearity or Un-linearity of the F.I.D., Chromatographia, 2, 1969.41. Novak, J., Janak, J., The Non-linearity of Signal Response and the Inversion Effect in the F.I.D., J. Chromatg., 4, (1960).
42.
McWilliam, I.G., Linearlty and Response Charac-teristics of the F.I.D., J.Chromatog., 6,(1961)43.
Sternberg, J.C., Gas Chromatography, ed. Brener, N., Callen, J.E., Weiss, M.D., Proc. of Third Int. fymp. of.lnst. Soc. of America, Academic Press, New York. p.542.(contribution to discussion)Batt, L., Cruickshank, F.R., Irreproducibility
44.
6.
Fig.l Fig.2 Fig.3 Fig.4 Fig.S Fig.6 Fig.7 Fig.S
ILLUSTRATIONS FOR CHAPTER 1.
The Basic Conventional Chromatography System. Action of 'Loenco' Multiport Valve.
Typical Detector Characteristic.
Probability Distribution of Noise in Detector Output. Elution Curve.
The Dependence Of H.E.T.P. On Flow Rate.
---carrier in
"
~
c o r r
ier out
Ft G, 20
s qmp l e in
t
ou x. passages
»:
sam p le pick- up
po 5i til: n
s~ClI pods
l'
samp le
\
\volum e loop
ACT ION 0 F L OENCO MULTI PORT VALVE
F!G.2b
sumple inje ct
TYPICAL DETECTOR CHAF<ACTERISTiC
...
:Ja.
...
::Jo
FIG.3
m
T
component c on c e nt r at icn Q ~
Probability Distribution of
Noi se in Detector Output
X..A./2.
=.
j·96 0'for
95ob
conti d e n c e
z
FIG.4•
x
e(/2
"
va
OJ
>L
e
t:T
>
::J
C7\
~ II 0
L ::> > til U C L-0
L-2
"
't-o 0 E ~ :> v ~ c
-
"
I- 0 ~
II
....
::> >
"
0 _J L ILl C
"
0 ~._
"
e
..
c :J C"
: 0..
:.c: . >\()
o
u, 0 c.._a~
-"
....
In C Q" 0 U c c..+--
u
0~ .-ell
et :::I ~
"""
-._ et. "'0 -.. m LUCl' 0
t-c
if
-c.-
n:-~ :.l....
~ (n 0 ;:::-c
0 _JII
u,z
c 0 0....
0;., N a.:
....
t-'....
0"
>- .,:z:
LtJ"
.. "'0 u, til 0 UJ U0 ZUJ
z
o
f-~ Q: I-Z UJ U Zo
u:r
J-~w
~ ::> It) Cl) LlJ ~a..
C.k' ::>o
a..
-c>.
LLo
z
o
t--c
er -c>
LlJ:r
t-e,....
\ \ \ \ \\
\,
,
'L- 0 00._ 'a..'" flI >-II)...
.c. -"", ::1 '- 0 ~ t1 OJ! c QE '';; 0 ::II..-
..
-o !It iii 111 ~cS!
-0 0'';; WO ""-.- >'"
C"", o Cr
I
>-co .~ 0
Cs
... c...
:;;,-O~~
V\ C 0
FIG.B
,
Henr ys law
~
\
/
L.
::,l
\
In\11
e.o
L-o,
..
'-::J
0 a.. '0
>
CJ
.-
+I IHe nr ys low
L.
-r:1
-;;;
-o,
0 mol e fraction y
--partial vapour pr e s sure of on e
co mpo nent •
I, RQouits law o be yed
2, .,.ye dry i
a
tion s fro mRaoul t's law
3, -
v
«
de
vi Qtion s fro mRaoults law
..
•
DEVIATIONS FROM RAOUL T5 L,\W
FOR REAL SOLUTIONS
LIST OF PRINCIPAL SYMBOLS
SYMBOLS t,g
x(t)
*
yet) net)~(t)
T
p.r.b.s.
L
n
b
(Ht)
k
c(t)
h('t)
2.1
INTERPRETATION time variables
shift variables
system input before any level modi-fication
the transformation 0
=
-1, 1=
+1. linear system outputnoise at output measurable output
per-Led of input
pseudo-random binary sequence number of bits in p.r.b.s. number of register stages used to generate the p.r.b.s.
minimum time interval between changes of state of p.r.b.s., i.e. p.r.b.s. clock interval
amplitude of transducer output delta function
impulse strength actual system input system impulse response estimated impulse response estimated impulse response in presence of drift
1
? •2
~xy crosscorrelation function between
input and linear, noise free output autocorrelation function of x
crosscorrelation function between
x an0 measurable output z
autocorrelation function of noise at output
~ (f)
nn b
n
noise spectral density
bandwidth of output noise in c.p.s. ~Tand~rd deviation of output noise standard deviation of estimates obtain~d by correlation
standard deviation of estimates
obtained by impulse testing '!,
T
c
M.
J
M
P.
ti1 t(.r)
integrator time constant jth time moment of p.r.b.s. order of base line drift
ith component of base line drift error term due to presence of base line drift
w
weighting function.th . ht
1 wel.g
binomial coefficient
area over which opening air pressure acts
area over which closing air pressure acts
2 • 3
'off'delay expressed as a fraction of the p.r.b.s. bit interval
e(t) error sequence
q value of shift variable T at which
extra peaks are predicted for unequal 'on' and 'off' delays
N number of theoretical plates in
column
retention volume
peak width at 0.368 of peak height temperature of column in
°c
temperature of column in oK ambient temperature in oK
elution plus settling time of last eluted component
H.E.T.P.
Height equivalent to a theoreticalplate E,F,G
a.
1
constants
ith coefficient in detecto~ charac-teristic
filter bandwidth,(3dB) Laplace variable
2,4
1. INTRODUCTION
In conventional chromatography the injection device places a measured quantity of sample in the form of a single pulse onto the column, and at the detector output, a series of multiple pulses are observed. This type of analytic procedure is clci.nto using a pulse input to determine tinear system dynamics. If the pulse :Jidth is small it can be regarded as an +mpu Lse , and the output the impulse response. Generally this method cannot be apr-lied directly to most linear systems since the noise levels demand the test impulse to be so large as to he totally impracti-cable. Thus other methods of determining the impulse l'es-ponse have been developed. The particular approach of in-terest in this chapter uses a continuous injection sequence of defined form instead of single pulses. Data analysis of the detector output yields the required chromatogram.
Inherent in this technique is considerable ncise rejection. The desirability of this in realistic sample analysis is illustrated with practical examples. Several other advantages of using this approach are enumerated. Early experiments with the technique were not particularly conclusive since the system is easily forced into a non-linear regime. This can have drastic and unfortunate consequences with the approach proposed here. Examples of such behaviour are given. Fortunately it is possible to overcom~ such difficulties~ by careful choice of
---~-~---2.5
2. 6
2. IMPULSE RESPONSE ESTIMATION
The use of impulses has been mentioned in 1. An indirect and more practical method for determining the
impulse response function is available and is now briefly described.
Consider a 'white noise' input applied ti. a
linear, time invariant system, ~nd the resultant output. We can define a cross correlation function between input and output as
:-=
T ....Lim00 12T
T
I
x(t-Tly(tldt-T
(1)
By the convolution integral
yet)
=
00
Jh(
T 1'X(t-T 1)dTl (2)00
•
•
• ,xy(.r)=
f
·xx(T-T1lh(TlldTl_00
(3)
=
T+ooLim 12TT
IX(tlX(t-Tldt
-T
is the autocorrelation function of the input~ Since the the autocorrelation function of 'white noise' is impulsive
2. 7
where k is the strength of the impulse. Thus by var-yi.ng
T in (5), the impulse response is estimated to within a
constant.
Although this technique is simple in concept) certain practical difficulties make it less attractive than appears at first sight. These difficulties are::"
(i) The statistics of 'white noise' al'S defined over an infinite length of record
(ii) 'White noise' is difficult to generate and delay
(iii) The stationarity of a 'white noise' generator is difficult to ensure
(iv) In many instances it would not be
pos sIbLe to find a transducer suited to a 'white noise' input
2.8
delayed versions are easily generated from a set of inter-connected feed-back shift-register stages, the r-esu It.ant
output being a chain of pulses with a period equal to L\,
where
The autocorrelation func~ion of such a sequence lS
given by the relations,
=
- IL forIt
I
> A,and is illustrated by Fig.l. Note th3t since the sequences are binary, a suitable input transducer is not difficult to find.
A fuller discussion of these sequences and their
123
generation is given in the literature " Using these pseudo-random binary sequences (p.r.b.s.) the integration
inherent in the crosscorrelation process need only be carrier out over one period. Howe~er, the system itself must be in the steady state before crosscorrelation begins.
is discussed further in (vi) of the next section.
2.9
3. CROSSCORRELATION APPLIED TO GAS CHROMATOGRAPHY
The application o~ the technique of cross-correlation to gas chromatography is now clear. Samples are introduced into the column duri!1g the "1" state of a p.r.b.s., carrier alone beiT'9_;injected in the "0" state. The sequence length must be greater than the longest elution time and the bit interval chosen to give the r-equire d reso-lution. Fig. 2 shows the mechanisation of the
r
o• -ocess inblock diagram form together with a typical input p.r.b.s. and the resultant detector output.
There are two alternative methods of introducing samples onto the column
:-(i) Direct injection into the carrier stream for the whole or part of the "1" bits of the p.r.'t).s.
(ii) Trapping t.he sample in a bypass loop of known volume and sweeping the loop out with carr-ier during each "1" bit.
Conventional analysis techniques use method (ii) only,since (i) does not give the reproducibility required. Thus, in the work described in this thesis, injection method (ii) is used except when stated otherwise.
:-?lO
(i) If each sample injection is the same size as a single injection in the con-ventional approach, greater accuracy
may be achieved. Howeve'r, column flood-ing could occur as the total sample size is now (L+l)/2 as large as a single
injection.
(ii) The detector output is no longer a chroma-togram but of the form shown in Fig.2. The detector operates on one range only as widely differing peak hcightG will not
occur. (This also means that range changing is not applied so that all com-ponents are detected with the same sensi-tivity).
(iii) The cross correlation process would
necessarily be carried out by a computen and a series of ordinates would result, which when plotted give the chromatogram. This will aid peak area evaluation if the resolution has been correctly cho~en.
(iv) If the detector output is contaminated with random noise, the variance in the
estimates of the ordinates of the chroma-togram is reduced by correlation so
2.11
[Signal/Noise]
by correlation technigue (6)
[Signal/Noise]
by conventional technique
For a proof of this result see Appendix El. If the variance in the estimates is
still too high, correlation can be averaged over several periods of the sequence so that the variance is reduced by a factor INumber of averaging periods
Cv) Base line drift during the experiment can be represented as a further polynomial noise term at the output. Appendix B2 shows that the effects of such baseline drift on impulse response estimates can be removed by correlating over two periods and weighting the estimates according to the rules given there.
2.12
a reliable sample analysis after a fur-ther L bit intervals have elapsed. Thus for a minimum period p.r.b.s., the first useful analysis is not available before two sequence periods have elapsed. Th~~ analysis is also one period out of date
If the sample composition remains
con-stant, the analysis is recomputed ~very bit interval, and it is to be noted t~at
If the sample composition varies, a further two sequence periods after the change are normally required before a new quantitative analysis is obtained. However, the input-output crosscorrelation function heralds the change aR soon as it is recorded at the out-put. Applying the techniques outlined in Chapter 3 section 4 quantitative analysis would also be possible at the same instant. Moreover ~ continuously varying sample con-. cent rat ion can be trackedcon-. Thus using
2.13
4. BRIEF REVIEW OF EARLY EXPERIMENTS BY OTHER WORKERS
The correlation technique has been applied by other authors4~5, but with limited success in all cases.
4
Early work by Izawa and Furuta in 1967 was directed at analysing a mixture of oxygen and nitrogen with helium
carrier on a molecular sieve colurnn(adsorption chromatography). Their results obtained using katherometer detectors showed -t:!letwo components fairly well separated. Also in evidence however were several supplementary peaks of heights up to
4% of the major peak height. The presence of these extra peaks was not explained. If they do not correspond to trace components, it is doubtful if such a correlogr2m would be acceptable to an analyst. Since lit~le was known with regard to the performance of the technique, two further investigations were initiateds,s.
5
Godfrey and Devenish attempted to analyse a sample of air using argon carrier with a 30011l samp Le valve, and a thermal conductivity detector. The major components of the air sample were discernible but again, many ~upple-mentary peaks of' up to ±25% of the major peak height appeared. Changing to helium carrier gave similar results. The
uase-2.14
2.15
5. BRIEF REVIEW OF INITIAL ANALYSES CONDUCTED BY THE AUTHOR
Concurrently but independently of Godfrey and Devenish5, the author began wor~ain the field which was
sub-sequently submitted as an M.Sc. thesis in 19686• Some of
the results of that work are described in this section.
5.1 HYDROCARBON ANALYSIS
Using conventional techniques and injection method Ci), a sample of 5% hydrocarbon mixtureCb)in helium yields the chromatogram of Fig.3. Helium carrier and a 20% weight by weight methoxy-ethyl adipate on 6' by
1"
o.d. 60-80 mesh chromasorb P, column operated at room temperature, were used. Detection was by a Servomex Mk. 158 microkatherometer.that this is an example of gas-liquid chromatography.
Note
The corresponding chromatogram using the p.r.b.s. approach and injection method Ci) is shown in Fig.4. This shows supplementary peaks up to 13% of the major peak height. Reducing the hydrocarbon concentration to 1% in helium re-du~es the magnitude of these supplementary peaks to 3.5% as seen in Fig. 5. In common with the observations of Godfrey and Devenishs, this behaviour suggests that one or more por-tions of the system were non-linear. The non-linearity could have been in either the sample valve, the column or
Ca) This work was carried out with the cooperation of Hewlett Packard Ltd. at their South Queensferry research and devel-opment section.
(b) Hydrocarbon mixture by volume: 90% Propylene,8% Propane,
2. 16
the detector, or even a combination of these.
2.17
6. CONSIDERATION OF NON-LINEARITIES
In order to isolate the nonlinearity each of
the system components was examined separately in the follow-ing order.
6.1 SAMPLE VALVE NON-LIN:ARITY
The sample valve (I.~.I.patent number 800,212) was designed so that the gas supply to the column could be derived either from carrier or sample reservoirs depending on the position of a piston. Attached to this piston is a flange, over an area Al of which pressurized air acts, so that the piston is in such a position that carrier gas nor-ma11y flows into the column. To inject samples, a second stream of air at the same pressure is directed onto an area
A2 on the opposite side of the same flange. Providing the ratio A1.:A2 = ~: 1, then the net force to move the piston to
the inject position, equals the net force to return when the second air stream is removed and hence the 'ON' and 'OFF' time constants would be equal.
1
By measurement however Al/A2
=
2.48
suggesting that the 'ON' and 'OFF' time constants of the valve would be different, and in the ratio(AlIA)
actufl/A.Z.)
desired'ON' TIME CONSTANT 'OFF' TIME CONSTANT
=
=
2.18
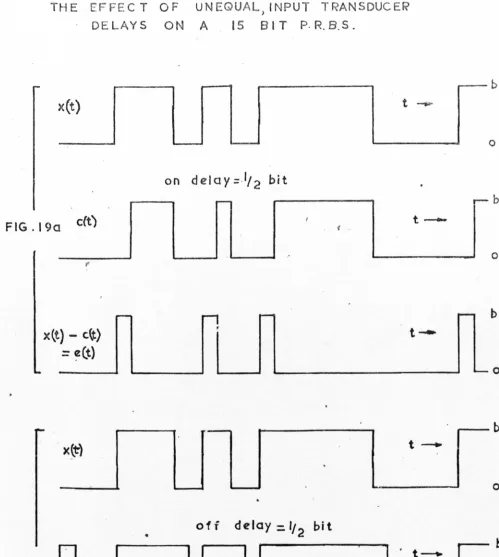
To check this, a step response of the form Fig.6*was obtained by injecting pure nitrogen directly through the sample valve into the detector.(i.e. the column was omitted) At the flow rate used (10 ml/min), the effects of diffusion in the katherometer would be negligible, since the cell volume WaS only 2~1. Thus Fig.6 is effectively the respon~e of the sample valve above.
Approximating the behaviour
of
Fig.6 to The step response of a first order system then'ON'TIME CONSTANT
'OFF'TIME CONSTANT
=
0.799
1.052 0.8
Godfrey et al 789
, ,
have made a study of the effects of such non-linearities. They show that with such a non-linearity in the system, each peak in the true impulse response will giv(! rise to a single extra peak in the resultant correlation function. The location of these extra peaks with respect to their 'parent' peaks is known,and their areas depend on the difference in the time constants. Furthermore the 'parent' peaks are themselves distorted.
In the case of Figs. 4 and 5, bit intervals of one second were used, but Fig.S suggests that the minimum transport time was two seconds. The results of Godfrey et al78' ,9 therefore, may not be directly applied to interpret Figs. 4 and 5, since they considered only the case of a transducer
2.19
reaching its final valve within the bit interval.
The present practical case is better studied by a digital simulation of a non-linear fi1ter,(time ~on-stante equal to those of the sampling valve) applied to a p.r.b.s. of length 127 and A
=
one second. The output of the simulated filter for this sequence and the corres-ponding autocorrelation function are shown in rig.7 andFig. 8 The general results are the same as those of Godfrey e~ a17,B,9with the extra peak in the same region, but wlth an increased baseline ripple.
The effects of the unequal 'ON' and 'OFF' delay times (see Fig.6) are similar to those of unequal t;m~ con-stant (see Appendix B3). In particular the extra peaks for the two cases appear within one bit of each other. Since the extra peaks predicted from Fig. 8 do not coincide with those of Figs. 4 and 5, sample valve non-linearity does not appear to have been the dominant source of trouble.
6.2 COLUMN NON-LINEARITIES
In Chapter 1, section 3.2, it is noted that gas-liquid chromatography is normally used with low sample con-centrations for which Raoult's law is obeyed during elution. If gross samples are loaded onto a column, the partition co-efficient varies with concentration and Raoult's law no longer holds. Using p.r.b.s. to estimate the chromatogram, the effect would be similar to that of a distributed non-linearity down the
2.20
a sample gas was chosen from the range of gases not ad-sorbed by the stationary phase. Such gases pass throuGh the ~olumn without partition. The column serves only as a volume to flow through.
The particular column used in section 5, Chapter 2, behaves in this way with nitrogen sample. Injecting pure nitrogen in the conve~tional manner, a single peak results with a flat base line. Veing p.r.b.s. Fig.9a is obtained. Subsidiary peaks of up to ±7% of the nitrogen peak are again present. The bypass volume is 40~1 and at a flow rate of 1/6 ml./sec.,the concentration of nitrogen in helium at the column input is 23 mole%, for each 1 second injection.
6.3
DETECTOR NON-LINEARITIES
Since the column could not have contributed significantly to the non-linear effects in Fig.9a, it appears that the dominant source of non-linearity lay in the detector. Equation (8), section 2.4.2,Chapter 1, relates the thermal conductivity of a mixture of gases to their concentration in the mixture. This equation shows that at high concentrations, the relationship is non-linear. A figure of 23.mole% nitrogen in helium would be considered high, and thus the detector output under such conditions would be related to nitrogen concentration by
z(t)
=
• • • (7)2.21
concentration at the detector input. In a correlation scheme the presence of indices greater than unity in (7) cause errors in the estimated impulse response and give rise to supplementary peaks. If the input sequence is modified so that it is inverse-repeat*, then the effect of even power indices on the impulse response is removed. Performing such an experiment yields Fig.9b where the supple-mentary peaks have been redl~ced to ±2% of the maj or peak
height. A reduction of supplementary peak height using inverse repeat sequences was also noted by Godfrey and Devenish 5.
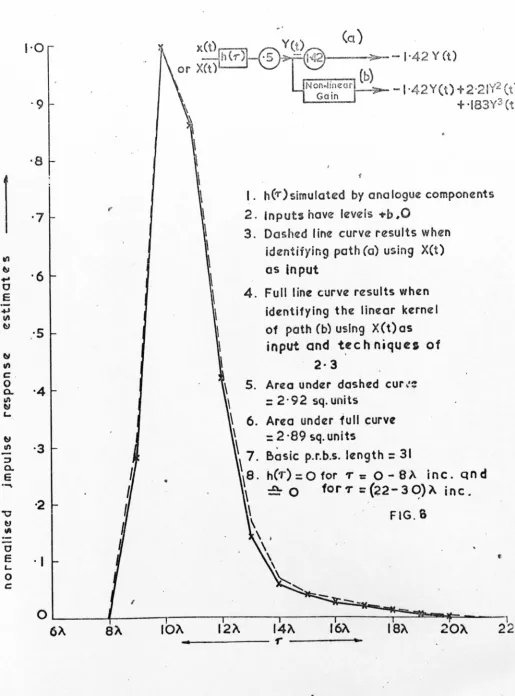
To demonstrate conclusively that the distribution of supplementary peaks in Fig.9a could be explained by a detector characteristic such as (7), the chromatography system was simulated by analogue and digital components. For the purposes of this simulation it was meaningful to lump the sample valve non-linearity as an overall delay in
'ON' time, (see Appendix B3). The transport lag in the column was simulated by an artificial delay in the input perturbations, and the flow dynamics by five identical first order lags in cascade and a high pass filter. (The purpose of the filter was to improve the symmetry of the response peak). Approximating. the detector characteristic to a cubic polynomial following the dynamics, the system model is then as shown in Fig.IO. On this model an
un-Ie A fuller discussion of the effects of non-linearities on
2.22
modified p.r.b.s. input gives the crosscorrelation of Fig. 11.
The degree of sample valve non-linearity controls the area under the negative excu~sion immediately prior to the major peak, and the order of the polynomial detector characteristic the position of the supplementary peaks. Although the model correlog~~m does not exactly fit the
chromatograph response (Fig.9a), they are sufficiently alike to suggest that the model 1S a valid representation of the
system.
If the detector is assumed to be non-linear, the behaviour of the results of section 5 when analysing hydro-carbons, as well as the effects noted by Godfrey and Devenishs, can be explained. It might also be noted from Chapter 1,