ORIGINAL RESEARCH
ADULT BRAIN
Ensemble of Convolutional Neural Networks Improves
Automated Segmentation of Acute Ischemic Lesions Using
Multiparametric Diffusion-Weighted MRI
XS. Winzeck,XS.J.T. Mocking,XR. Bezerra,XM.J.R.J. Bouts,XE.C. McIntosh,XI. Diwan,XP. Garg,XA. Chutinet,XW.T. Kimberly, XW.A. Copen,XP.W. Schaefer,XH. Ay,XA.B. Singhal,XK. Kamnitsas,XB. Glocker,XA.G. Sorensen, andXO. Wu
ABSTRACT
BACKGROUND AND PURPOSE: Accurate automated infarct segmentation is needed for acute ischemic stroke studies relying on infarct volumes as an imaging phenotype or biomarker that require large numbers of subjects. This study investigated whether an ensemble of convolutional neural networks trained on multiparametric DWI maps outperforms single networks trained on solo DWI parametric maps.
MATERIALS AND METHODS: Convolutional neural networks were trained on combinations of DWI, ADC, and low b-value-weighted images from 116 subjects. The performances of the networks (measured by the Dice score, sensitivity, and precision) were compared with one another and with ensembles of 5 networks. To assess the generalizability of the approach, we applied the best-performing model to an independent Evaluation Cohort of 151 subjects. Agreement between manual and automated segmentations for identifying patients with large lesion volumes was calculated across multiple thresholds (21, 31, 51, and 70 cm3).
RESULTS:An ensemble of convolutional neural networks trained on DWI, ADC, and low b-value-weighted images produced the most accurate acute infarct segmentation over individual networks (P⬍.001). Automated volumes correlated with manually measured volumes (Spearman⫽0.91,P⬍.001) for the independent cohort. For the task of identifying patients with large lesion volumes, agreement between manual outlines and automated outlines was high (Cohen, 0.86 – 0.90;P⬍.001).
CONCLUSIONS: Acute infarcts are more accurately segmented using ensembles of convolutional neural networks trained with multipa-rametric maps than by using a single model trained with a solo map. Automated lesion segmentation has high agreement with manual techniques for identifying patients with large lesion volumes.
ABBREVIATIONS:ALV⫽automatically segmented lesion volume; CNN⫽convolutional neural network; E2⫽ensemble of CNNs using DWI and ADC; E3⫽ ensemble of CNNs using DWI, ADC, and LOWB; IQR⫽interquartile range; LKW⫽last known to be well; LOWB⫽low b-value diffusion-weighted image (b0); MLV⫽ manually segmented lesion volume
A
ccurate acute infarct segmentation on DWI is important for many aspects of the management of patients with ischemic stroke such as deciding whether to triage the patient to aninten-sive care unit, monitoring brain swelling, aiding prognosis, assess-ing the risk of complications, and predictassess-ing functional outcome. Robust automated segmentation of acute infarcts also has great potential for use in clinical trials in which precise volume mea-surements are needed to assess differences between groups or to monitor lesion growth. Various automated algorithms for seg-menting tissue have been presented.1-3However, many of these methods focus only on using a solo diffusion parametric map, such as isotropic high-b-value DWI1or an ADC image.2There have been studies that combined DWI and ADC maps,4-6but these did not include the non-diffusion-weighted low-b-value images (b⫽0 s/mm2, LOWB), which can potentially be used to measure early vasogenic edema. Another study has proposed us-Received October 1, 2018; accepted after revision April 19, 2019.
From the Department of Radiology (S.W., S.J.T.M., R.B., M.J.R.J.B., E.C.M., I.D., P.G., H.A., A.G.S., O.W.), Athinoula A. Martinos Center for Biomedical Imaging, Massa-chusetts General Hospital, Charlestown, MassaMassa-chusetts; Division of Anaesthesia (S.W.), Department of Medicine, University of Cambridge, Cambridge, UK; Depart-ments of Neurology (A.C., W.T.K., H.A., A.B.S.) and Radiology (W.A.C., P.W.S.), Mas-sachusetts General Hospital, Boston, MasMas-sachusetts; Department of Medicine (A.C.), Faculty of Medicine, Chulalongkorn University, King Chulalongkorn Memo-rial Hospital, Thai Red Cross Society, Bangkok, Thailand; and Department of Com-puting (K.K., B.G.), Imperial College London, London, UK.
This work was supported by the National Institutes of Health-National Institute of Neurological Disorders and Stroke R01NS059775, R01NS063925, R01NS082285, P50NS051343, R01NS086905, R01NS051412, R21NS077442, R21NS085574, U01 NS069208, U10NS086729, 1U01NS095869; and the National Institutes of Health-National Institute of Biomedical Imaging and Bioengineering, P41EB015896, and 1S10RR019307.
Please address correspondence to Ona Wu, PhD, Athinoula A Martinos Center for Biomedical Imaging, 149 13th St, CNY 2301, Charlestown, MA 02129; e-mail: [email protected]
Indicates open access to non-subscribers at www.ajnr.org
Indicates article with supplemental on-line appendix and tables.
Indicates article with supplemental on-line photos.
ing multiple b-values, up to 2000 s/mm2(which are typically not acquired in the acute setting), but whether the data were acquired in the acute or subacute stage was not reported, and the effects of using combinations of parameters were not investigated.7
We hypothesize that a multimodal approach can improve the performance of automated segmentation algorithms. Indeed, most radiologists use other sequences in addition to DWI when assessing the extent of acute infarction. We tested this hypothesis by comparing the accuracy of fully automated acute infarct seg-mentation algorithms that use solo diffusion parametric maps with the performance of algorithms that combine multiple para-metric maps. We also posit that ensemble models that aggregate segmentation results from multiple algorithms will surpass single algorithms. The superior accuracy of ensemble algorithms has been shown for tumor applications,8but not yet for acute infarct segmentation. Finally, we assessed the generalizability of our ap-proach by evaluating its performance on an independent cohort. We also tested the clinical utility of automated approaches for triaging patients with large infarct volumes who might not benefit from endovascular treatment.9,10
MATERIALS AND METHODS
Subjects
All analyses were performed retrospectively under Partners Human Research Committee review board approval. MR imaging from pa-tients with acute ischemic stroke admitted at a single academic med-ical center between 2005 and 2007, imaged within 12 hours of when the patient was last known to be well (LKW), and who did not receive either thrombolysis before MR imaging or experimental therapy were used for training the convolutional neural networks (CNNs).11 An independent cohort12,13consisting of nonoverlapping patients admitted to the same center between 1996 and 2012 for whom im-aging was performed within 24 hours of LKW and for whom fol-low-up MR imaging datasets were available was used for the evalua-tion group. Both cohorts were drawn from separate repositories for which manual outlines were available that had been drawn several years ago for a study of early-stage stroke patterns11or for studies predicting lesion expansion.12,13
MR Imaging
Diffusion-weighted MR imaging was acquired on 1.5T scanners (GE Genesis SIGNA, SIGNA Excite, SIGNA HDx, SIGNA HDxt; GE Healthcare, Milwaukee, Wisconsin) with the following parameters for most subjects: b-value⫽1000 s/mm2, TR⫽5000 ms, TE⫽88.9 ms, FOV⫽220 mm, 23 5-mm thick-slices and 1-mm gap, and 6 diffusion directions (see the On-line Appendix and On-line Table 1 for details). Diffusion-weighted MR imaging were corrected for eddy current distortions before calculation of isotropic trace DWI maps (geometric mean of the high-b-value acquisitions) and ADC maps (slope of the linear regression fit of the log of the DWI and LOWB images using techniques described previously).14Manual outlines had been drawn for prior studies11-13using the program Display (McConnell Brain Imaging Centre, Montreal, Canada) by a neuro-scientist with 15 years of experience (reader 1: O.W., Training Co-hort) and a neuroradiology fellow with 4 years of experience (reader 2: R.B., Evaluation Cohort) interpreting stroke MR imaging. The readers were blinded to the results of the automated segmentation
algorithm. No a priori thresholds were used for manual segmenta-tion, but concomitant ADC and LOWB maps were referenced to avoid inclusion of susceptibility artifacts and chronic lesions with elevated ADC values. Tissue was considered an acute infarct if it ex-hibited hyperintensity on DWI, with hypointensity on the ADC or abnormal T2 prolongation on LOWB. To assess interrater agree-ment, we randomly selected 10 subjects from the Evaluation Cohort and outlines drawn by reader 1, and 2-way intraclass correlation was calculated.
A neuroradiologist with 12 years of experience (W.A.C.) as-signed each patient to 1 of the following categories based on lesion location: brain stem, cerebellum, supratentorial/cortical, or su-pratentorial/subcortical. The “supratentorial/cortical” designa-tion was used if any pordesigna-tion ofⱖ1 infarct involved the cortex. Patients with both supra- and infratentorial lesions or lesions in-volving both the brain stem and cerebellum were assigned to a fifth category, “multiple.”
Image Preprocessing
DWI, ADC, and LOWB images were resampled to an isotropic voxel size of 1 mm3. The LOWB brain mask was computed using the Brain Extraction Tool (FSL, Version 5.0.9; (http://fsl. fmrib.ox.ac.uk/fsl/fslwiki/BET).15,16Mean and SD were calcu-lated from intensities within the brain mask limited to the 1 to 99 percentile range to normalize values to a mean of 0 and SD of 1.0.
CNN Training
CNNs were trained to classify voxels as lesion or non-lesion on a NVIDIA Tesla K40 GPU (NVIDIA, Santa Clara, California) using the DeepMedic (Version 0.7.0; https://biomedia.doc.ic.ac.uk/ software/deepmedic/) framework with 2 pathways (see the origi-nal publication17and the On-line Appendix). On-line Fig 1 shows the architecture. DeepMedic is a 3D-CNN that operates on mul-tiresolution pathways to allow efficient and accurate supervised segmentation. This framework was chosen over other approaches because it performed best in the Ischemic Stroke Lesion Segmen-tation Challenge (ISLES) 2015 study.18Additional studies have also shown that DeepMedic had better or comparable perfor-mance compared with other neural network architectures (On-line Appendix). Separate CNNs were trained on single or different combinations of diffusion parametric maps (DWI, ADC, and LOWB individually, and DWI⫹ADC, ADC⫹LOWB, DWI⫹LOWB, DWI⫹ADC⫹LOWB). To generate ensemble seg-mentations, we averaged voxelwise the class posteriors from the softmax layers of 5 independent CNNs.
Performance Evaluation
Binarized segmentation performances were assessed with the Dice score (measure of overlap between automated and manual lesion segmentations), precision, and sensitivity metrics. Dice score, preci-sion, and sensitivity were computed as follows: Dice⫽2TP / (2⫻ TP⫹FP⫹FN); Precision ⫽ TP / (TP⫹FP); Sensitivity ⫽ TP / (TP⫹FN) for which TP⫽true-positive, FP⫽false-positive, and FN⫽false-negative. All metrics range from 0% to 100%, with higher values indicating better performances.
To evaluate the generalizability of the approach, we retrained the best performing network on the full Training Cohort and applied it to the independent cohort. The Evaluation Cohort was also segmented with an approach that has been used in clinical trials.19In brief, the technique combined thresholding of ADC (⬍615⫻10⫺6mm2/s), DWI, and exponential attenuation maps with morphologic operations (opening with a 2-voxel structural element). ADC images were first masked with a LOWB brain mask before thresholding. We evaluated the algorithm on images that had been resampled to 1-mm resolution for processing and on images that were segmented at their original resolution. Seg-mented outputs from all algorithms were evaluated at 1-mm res-olution to reduce potential confounds from different MR imaging acquisition resolutions. Effects of lesion volume and location on performance were investigated using univariable and multivari-able regression analysis as a function of the manually segmented lesion volumes (MLVs). We also compared algorithm accuracy between very small MLVs of⬍1 cm3 (group I-A) and larger MLVsⱖ1 cm3(group I-B).
To assess the accuracy of using automatically segmented lesion volumes (ALVs) in place of MLVs for identifying patients who have lesion volumes that are too large to likely benefit from endo-vascular treatment, we explored the agreement between ALV and MLV for MLV⬍21 cm3(group II-A) versusⱖ21 cm3(group II-B), MLV⬍31 cm3(group III-A) versusⱖ31 cm3(group III-B), MLV⬍51 cm3(group IV-A) versusⱖ51 cm3(group IV-B), and MLV⬍70 cm3(group V-A) versusⱖ70 cm3(group V-B) to de-termine potential misclassification rates of patients with large le-sions using automated algorithms compared with manual vol-umes. The thresholds (21, 31, 51, and 70 cm3) were selected on the basis of values that had been used for enrollment in prospective endovascular clinical trials of expanded-window interven-tions.9,10To be eligible for endovascular treatment using the DWI or CTP Assessment with Clinical Mismatch in the Triage of Wake-Up and Late Presenting Strokes Undergoing Neurointer-vention With Trevo (DAWN) trial criteria,10patients had to meet the inclusion and exclusion criteria of 1 of the following 3 groups: group A, 80 years of age or older, NIHSS scoreⱖ10, and infarct volume of⬍21 cm3; group B, younger than 80 years of age, NIHSS scoreⱖ10, and infarct volume of⬍31 cm3; group C, younger than 80 years of age, NIHSS scoreⱖ20, and infarct volume of 31 to⬍51 cm3. For the MR imaging cohort, the infarct volume was measured on DWI. Similarly, to be eligible for late window endo-vascular treatment using the Endoendo-vascular Therapy Following Imaging Evaluation for Ischemic Stroke 3(DEFUSE) 3 MR imag-ing criteria,9patients had to exhibit an infarct volume on DWI of
⬍70 cm3. Although there may be other volume thresholds that
might be useful for patient selection,20we focused on thresholds that were used in positive prospective clinical trials.
Statistical Analysis. Differences between model performance metrics were tested by 2-way ANOVA followed by post hoc paired Wilcoxon signed rank tests. Correlations were assessed via the Spearman correlation coefficient (). Univariate analysis was per-formed with the Wilcoxon 2-sample rank sum test for continuous variables or the 2-sided Fisher exact test for categoric variables. Cohenassessed agreement between MLV, and ALV statistical tests were conducted with JMP Pro 14.0 (SAS Institute, Cary, North Carolina).Pvalues⬍.05 were considered significant. Fig-ures of MR imaging data were generated using FSLeyes (Version 0.27; https://fsl.fmrib.ox.ac.uk/fsl/fslwiki/FSLeyes).
RESULTS
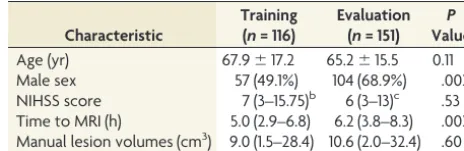
Subject demographics for training (n⫽116) and Evaluation Cohort (n⫽151) are shown in Table 1. Although there were imbalances in sex and time to MR imaging likely due to different inclusion and exclusion criteria of the 2 cohorts (ie, patients for whom follow-up MR imaging is ordered clinically who made up the Evaluation Co-hort tend to have more severe conditions), there was no statistical difference in the distribution of MLVs. The median volume of the 10 subjects randomly selected from the Evaluation Cohort for intraclass correlation coefficient analysis was 9.7 cm3 (interquartile range [IQR]⫽2.7–32.6 cm3), ranging from 1.2 to 94.4 cm3. The intraclass correlation coefficient for the 2 readers was excellent (intraclass cor-relation coefficient⫽1.00,P⬍.001).
Effect of Selection of Diffusion Parametric Maps on CNN Performance
Significant differences (P⬍.001) were found among all perfor-mance metrics (Dice, precision, sensitivity) across all models (Ta-ble 2). Precision could not be calculated for cases in which models could not detect a lesion.
Individual Diffusion Maps
The CNN trained on DWI yielded significantly higher Dice scores compared with the CNN trained on ADC (P⬍.001) or LOWB (P⬍
[image:3.594.301.533.56.131.2].001) maps (On-line Fig 2 and Table 2). Findings for the CNN pre-cision (DWI versus ADC,P⬍.001, versus LOWB,P⬍.001) and sensitivity (DWI versus ADC,P⬍.001, versus LOWB,P⬍.001) were analogous to those for the Dice score. Of the networks trained with a single parametric map, the CNN models that used the DWI parametric map performed best, followed by the model based on the ADC map, with the LOWB-based model having the worst scores.
Table 1: Demographics for training and Evaluation Cohortsa
Characteristic
Training (n= 116)
Evaluation (n= 151)
P
Value
Age (yr) 67.9⫾17.2 65.2⫾15.5 0.11
Male sex 57 (49.1%) 104 (68.9%) .002
NIHSS score 7 (3–15.75)b 6 (3–13)c .53
Time to MRI (h) 5.0 (2.9–6.8) 6.2 (3.8–8.3) .002 Manual lesion volumes (cm3) 9.0 (1.5–28.4) 10.6 (2.0–32.4) .60
a
Differences as a factor of the Training Cohort are shown. Data are shown as median (IQR), mean⫾SD, or No. (%).
b
n⫽112.
c
Combinations of 2 Diffusion Maps
Including additional diffusion parametric maps as training data improved segmentation results. When we trained CNNs on 2 parametric maps (On-line Fig 2Band Table 2), all 3 CNNs that used combinations of 2 maps yielded higher Dice scores than all single-map CNNs (DWI⫹ADC versus LOWB, versus ADC, ver-sus DWI,P⬍.001; DWI⫹LOWB versus LOWB, versus ADC, versus DWI,P⬍.001; ADC⫹LOWB versus LOWB, versus ADC, versus DWI,P⬍.001). DWI⫹ADC had the highest Dice score compared with the other combinations (ADC⫹LOWB,P⬍.001; DWI⫹LOWB,P⫽.03). Similarly, all CNNs trained with combi-nations of 2 parametric maps had higher precision than CNNs trained with 1 map (DWI⫹ADC versus LOWB, versus ADC, ver-sus DWI,P⬍.001; DWI⫹LOWB versus LOWB, versus ADC, versus DWI,P⬍.001; ADC⫹LOWB versus LOWB, versus ADC, versus DWI,P⬍.001). However, there was no significant differ-ence in precision between the combinations (DWI⫹ADC versus DWI⫹LOWB,P⫽.67; DWI⫹LOWB versus ADC⫹LOWB,P⫽
.28), except for DWI⫹ADC versus ADC⫹LOWB, P ⫽ .03. DWI⫹ADC similarly outperformed the individual parametric
maps (LOWB,P⬍.001; ADC,P⬍.001) except for DWI (P⫽.28) in terms of sensitivity. ADC⫹LOWB outperformed the individual LOWB (P ⬍ .001) and ADC (P⬍.001) models, but not DWI (P⫽.24). Similar results were found for the DWI⫹LOWB model compared with the individual parametric maps (LOWB,
P⬍.001; ADC,P⬍.001; DWI,P⫽.83). DWI⫹ADC was comparable sensitivity with that of DWI⫹LOWB (P⫽.11) and had improved sensitivity with respect to ADC⫹LOWB (P ⬍ .001). DWI⫹ LOWB and ADC⫹LOWB were equally sensitive (P⫽.06).
Combination of 3 Diffusion Maps The CNN model that combined all 3 parametric maps had a significantly greater Dice score (versus the LOWB, ADC, DWI,P ⬍ .001; DWI⫹LOWB,
P⫽.01; ADC⫹LOWB,P⬍.001) com-pared with all other combinations with the exception of DWI⫹ADC (P⫽.49). Precision results showed improvement against models using individual maps (versus LOWB, ADC, DWI,P⬍.001) but not against the other combinations (DWI⫹ADC,P ⫽ .47; DWI⫹LOWB,
P⫽.69; ADC⫹LOWB,P⫽.19). Similar results were found for sensitivity (versus LOWB, ADC,P⬍.001; DWI,P⫽.008; DWI⫹ADC, P ⫽ .10; DWI⫹LOWB,
P⫽.007; ADC⫹LOWB,P⬍.001).
Ensemble of CNNs
Five CNNs were trained, each using either DWI⫹ADC or DWI⫹ADC⫹LOWB, the 2 best-performing models. The Dice performances of each of the 5 individual CNNs were slightly different using DWI⫹ADC (On-line Table 2 and On-(On-line Fig 3, ANOVAP⫽.02, with differences between CNN 2 and CNN 3,P⫽.04; and CNN 4 and CNN 5,P⫽
.04) but were similar to one another using DWI⫹ADC⫹LOWB (On-line Table 3 and On-line Fig 4, ANOVAP⫽.60). Aggregat-ing results of the individual CNNs to create ensembles (E2: DWI⫹ADC CNNs, E3: DWI⫹ADC⫹LOWB CNNs) signifi-cantly improved the Dice performance over individual CNNs (P⬍.001). Both ensembles yielded results similar to one another in terms of Dice (P⫽ .66) and precision (P⫽.62), but both surpassed the other CNNs (Table 2,P⬍.001). E3 and E2 had similar sensitivity to one another (P ⫽ .46) and to the DWI⫹ADC⫹LOWB model (versus E2,P⫽.58; versus E3,P⫽
.12), but outperformed the others (P⬍.01, Table 2).
Validation on the Independent Cohort
E3 was used for the evaluation studies to assess the generalizability of the approach because E3 tended to perform better than E2.
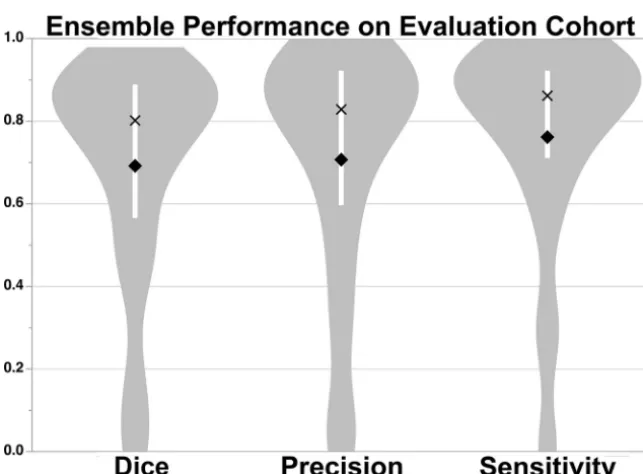
[image:4.594.54.377.55.160.2]FIG 1. Median Dice (80.2% [IQR, 56.6%– 88.9%]), precision (82.9% [IQR, 59.7%–92.2%]), and sensitivity (86.2% [IQR, 71.1%–92.3%]) scores of the DWI⫹ADC⫹LOWB ensemble on the Evaluation Cohort. The white barwithin the violin plot shows the IQR, mean is adiamond, and median is anX.
Table 2: Comparison of performance metrics of segmentations for different CNN modelsa
Model Dice Precision Sensitivity
LOWB 6.5 (0.3–20.9) 5.7 (0.3–32.7) 8.5 (0.3–28.5)
ADCb 56.4 (27.1–75.4) 59.4 (22.3–78.4) 58.2 (32.7–78.9)
DWI 72.3 (46.2–82.5) 73.0 (38.3–88.1) 84.0 (62.4–90.8)
ADC⫹LOWB 76.5 (51.9–86.1) 78.1 (47.2–88.8) 79.2 (66.6–89.7) DWI⫹LOWB 76.7 (58.4–85.4) 79.4 (52.0–89.8) 83.0 (64.8–90.6) DWI⫹ADC 79.0 (57.1–86.4) 79.0 (62.1–90.5) 82.6 (68.4–91.4) DWI⫹ADC⫹LOWB 78.9 (56.2–86.2) 77.4 (55.0–89.8) 83.4 (71.3–91.8) E2 (DWI⫹ADC) 82.0 (62.9–88.1) 82.0 (65.1–92.6)b 84.1 (71.0–92.6) E3 (DWI⫹ADC⫹LOWB) 82.2 (64.9–88.9) 83.2 (67.7–93.3) 83.9 (71.9–92.4)
a
All metrics are denoted in percentages as median (IQR). Of the nonensemble models, significant differences in Dice, precision, and sensitivity were found (P⬍.001). The ensemble models, E2 and E3, were superior to all other models (P⬍
.001).
b
[image:4.594.54.376.214.451.2]Figure 1shows the results of applying the E3 to the Evaluation Cohort. Dice (P⫽.59), precision (P⫽.35), and sensitivity (P⫽
.66) were not significantly different from the results for the Train-ing Cohort. In contrast, the thresholdTrain-ing approach performed significantly worse compared with E3 across all measures (P⬍
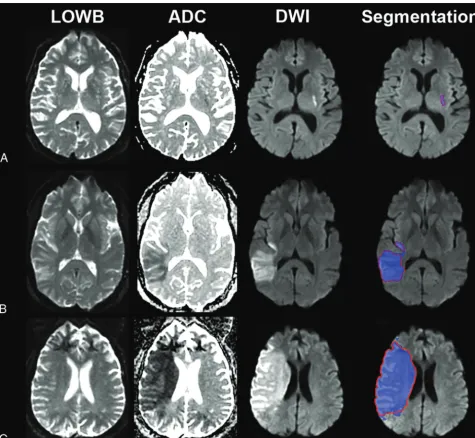
.001), achieving only a Dice score of 13.3 (2.3– 41.6), precision of 7.5 (1.2–34.2), and sensitivity of 60.7 (39.5–72.2) for data ana-lyzed in the original resolution and for data anaana-lyzed at 1-mm isotropic resolution (Dice: 11.6 [2.2–34.7], precision: 6.5 [1.1– 28.0], sensitivity: 59.4 [37.6 –72.2]). We therefore focused the re-mainder of our analyses on E3 results. Examples of segmentation on subjects from the Evaluation Cohort using E3 are provided in
Fig 2(see On-line Fig 5 for probability maps). Regression analysis showed that Dice scores (P⬍.001), precision (P⬍.001), and sensitivity (P⫽.01) improved with larger lesion volumes. The
independent Evaluation Cohort consisted of strokes involving primarily supratentorial/cortical (n⫽104, 69%) locations and supratentorial/subcortical (n⫽30, 20%) regions. There were sig-nificant differences in MLV, ALV, Dice, precision, and sensitivity as a function of location (On-line Table 4). Univariable regression showed that lesion location affected Dice scores (P⫽.002), pre-cision (P⫽.01), and sensitivity (P⬍.001). However, multivari-able analysis including lesion volume (P⬍.001), showed that lesion location was no longer significantly associated with the Dice score (P⫽.06) or precision (P⫽.17). Notably, sensitivity was still associated with location (P⬍.001) but not volume (P⫽
.09) in multivariable analysis.
ALV correlated significantly with MLV (⫽0.91,P⬍.001) and NIHSS score (⫽0.55,P⬍.001), comparable with MLV correlation with NIHSS score (⫽0.46,P⬍.001). Subgroup
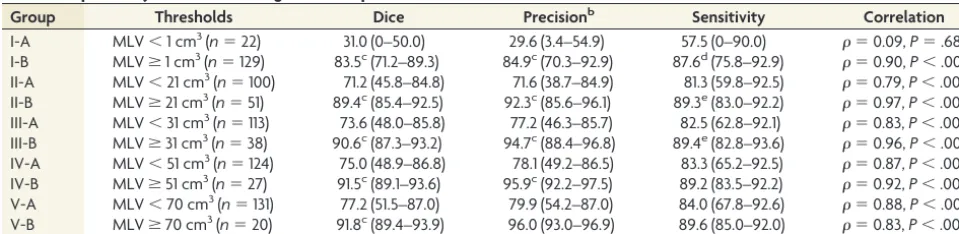
[image:5.594.56.532.46.484.2]analysis based on MLV (Table 3) showed that the automated method performed significantly worse on small volumes (⬍1 cm3) compared with large volumes for all metrics (group I-A versus group I-B, P ⬍ .01). Misclassification rates across all thresholds were low—21 cm3: 9/151 (6.0%),⫽0.87,P⬍.001; 31 cm3: 6/151 (4.0%),⫽0.90,P⬍.001; 51 cm3: 6/151 (4.0%), ⫽0.86,P⬍.001; and 70 cm3: 4/151 (2.6%),⫽0.89,P⬍.001. There were 3 subjects for whom the differences in ALV and MLV were⬎50 cm3; these cases had poor skull stripping as a result of scanner inhomogeneities (On-line Fig 6). If we excluded these 3 subjects, the median (IQR) differences in the misclassified cases for each threshold were the following—21 cm3: 18.7 cm3(8.9 – 25.2 cm3); 31 cm3: 7.4 cm3(1.7–16.8 cm3); 51 cm3: 8.8 cm3(8.0 – 14.6 cm3); 70 cm3: 5.3 cm3(3.7– 6.9 cm3).
DISCUSSION
We have shown that an ensemble of CNNs trained with multipa-rametric diffusion maps improves automated segmentation of acute infarcts over methods that use solo maps. Among the indi-vidual parameter models, CNNs trained on DWI performed best. However, a model trained on only DWI may incorrectly classify regions with susceptibility artifacts that appear as DWI hyperin-tensities or wrongly include subacute T2-shinethrough regions.21 Networks trained on only ADC images provided a fair perfor-mance because reduced ADC values represent cytotoxic edema that manifests in hyperacute stroke,22but may undersegment lat-er-stage strokes when ADC pseudonormalizes.21CNNs exclu-sively trained on LOWB performed poorly, likely because our data consisted of mainly patients with early-phase stroke (me-dian, 6 hours from LKW) before vasogenic edema is evident on LOWB.23
Combining DWI and ADC improved segmentation, consis-tent with “standard practice” by expert outliners who typically refer to the ADC image to confirm that the DWI hyperintensity coincides with reduced diffusivity to minimize inclusion of arti-facts. Combining LOWB with either ADC or DWI increased the Dice score, suggesting that LOWB provides complementary in-formation. Although inclusion of LOWB with DWI⫹ADC did not result in statistically significant improved performance, a ten-dency toward more accurate segmentation was observed in the ensemble models.
We have also shown that our model performs comparably with
humans as reflected by both high Dice scores and correlation be-tween ALV and MLV. Indeed, the Dice scores of the E3 algorithm results were comparable with the Dice scores between human readers in our subcohort of 10 patients with outlines from both readers. The time for automated segmentation currently is approximately 5 min-utes, which may be similar to times required by an experienced hu-man reader, but we expect that with optimization and faster GPUs, the time for segmentation can be further reduced. Furthermore, the primary benefits of our automated approach are that the results will be reproducible, unbiased, and scalable (eg, clinical trials that com-pare lesion volumes for thousands of subjects).
ALV and MLV were closely correlated, but segmentation of small lesion volumes was overestimated. Accurate estimation of small lesion volumes (⬍1 cm3) is more difficult because they are harder to detect and small variation from the ground truth leads to greater aberrations of performance metrics. Small-lesion seg-mentation could possibly be improved by customizing specific CNNs tailored to detecting lesions by volume size. Nevertheless, we have shown that our automated approach performed compa-rably with manual lesions delineated by our human experts with regard to patient-selection tasks. The cases of disagreement typi-cally occurred when there were image artifacts that led to poor brain extraction, which, in turn, might have led to poor normal-ization, resulting in oversegmentation. A second reason for this failure might be that the networks have not previously seen con-text outside the brain during training because it is excluded in most cases in which the masks are correctly computed. We did not manually fix the brain masks because we wanted to evaluate a fully-automated approach. Refining the automated brain extrac-tion step will likely further improve our algorithms.
There were several limitations to this study. One is the retro-spective nature of our analysis, which resulted in variable MR imaging acquisition protocols that changed across the years with clinical practice. However, this is also a strength because our ap-proach will likely be more generalizable to real-world clinical sit-uations and not dependent on a specific MR imaging protocol, which is often used in clinical trials. This may also explain why the thresholding approach performed poorly on our data compared with other studies for which MR imaging acquisition was harmo-nized as part of a trial.19Another potential limitation is that a different reader created the manual outlines used for the
Evalua-Table 3: Dependency of automated segmentation performance on MLVa
Group Thresholds Dice Precisionb Sensitivity Correlation
I-A MLV⬍1 cm3(n⫽22) 31.0 (0–50.0) 29.6 (3.4–54.9) 57.5 (0–90.0) ⫽0.09,P⫽.68
I-B MLVⱖ1 cm3(n⫽129) 83.5c(71.2–89.3) 84.9c(70.3–92.9) 87.6d(75.8–92.9) ⫽0.90,P⬍.001 II-A MLV⬍21 cm3(n⫽100) 71.2 (45.8–84.8) 71.6 (38.7–84.9) 81.3 (59.8–92.5) ⫽0.79,P⬍.001 II-B MLVⱖ21 cm3(n⫽51) 89.4c(85.4–92.5) 92.3c(85.6–96.1) 89.3e(83.0–92.2) ⫽0.97,P⬍.001 III-A MLV⬍31 cm3(n⫽113) 73.6 (48.0–85.8) 77.2 (46.3–85.7) 82.5 (62.8–92.1) ⫽0.83,P⬍.001 III-B MLVⱖ31 cm3(n⫽38) 90.6c(87.3–93.2) 94.7c(88.4–96.8) 89.4e(82.8–93.6) ⫽0.96,P⬍.001 IV-A MLV⬍51 cm3(n⫽124) 75.0 (48.9–86.8) 78.1 (49.2–86.5) 83.3 (65.2–92.5) ⫽0.87,P⬍.001 IV-B MLVⱖ51 cm3(n⫽27) 91.5c(89.1–93.6) 95.9c(92.2–97.5) 89.2 (83.5–92.2) ⫽0.92,P⬍.001 V-A MLV⬍70 cm3(n⫽131) 77.2 (51.5–87.0) 79.9 (54.2–87.0) 84.0 (67.8–92.6) ⫽0.88,P⬍.001 V-B MLVⱖ70 cm3(n⫽20) 91.8c(89.4–93.9) 96.0 (93.0–96.9) 89.6 (85.0–92.0) ⫽0.83,P⬍.001
a
Performance metrics are in median (IQR) and percentages. Results of E3 applied to the Evaluation Cohort are shown as a function of different volume thresholds.
b
Excludes 2 subjects in group A with automatically segmented lesion volumes of zero because precision is undefined in this circumstance.
c
P⬍.001.
d
P⬍.01.
e
[image:6.594.53.533.55.172.2]tion Cohort from the Training Cohort. However, the accurate segmentation results in both cohorts suggest that the model is not overfitted to 1 particular reader. Another benefit of an automated approach is that it is reproducible and not dependent on the ex-pertise of the reader.
To evaluate the impact of different diffusion maps on segmen-tation performance, we kept the CNN architecture constant throughout all experiments. In addition to changing the combi-nations of inputs, we chose to build an ensemble from several CNNs because ensemble learning is known to boost the perfor-mances of single-classifier algorithms.8,24DeepMedic samples randomly from the Training Cohort (ie, both the selected subjects and extracted samples differ in each training epoch). Although DeepMedic is very robust in its performance, the variation in sampling inherently results in slightly different models, even when trained with the same architecture. Merging the segmenta-tions of several models reduces false-positives and improves over-all performance. Although strong single networks are desired and necessary to create a high-performing ensemble, our CNNs may come with bias specific to DeepMedic. Building an ensemble of different CNN architectures might further enhance the perfor-mance. Future investigation will need to analyze the benefits of merging more diverse networks to cancel out each other’s inher-ent biases.8This diversity of models could be achieved by chang-ing the hyperparameters of DeepMedic uschang-ing completely different architectures or training on a different dataset.
CONCLUSIONS
Ensembles of CNNs trained on multiparametric diffusion MR imaging improved automated segmentation of acute infarcts in comparison with individual CNNs trained on solo diffusion maps, producing results that are comparable with manual lesions drawn by experts.
ACKNOWLEDGMENTS
We gratefully acknowledge the support of NVIDIA Corporation with the donation of the NVIDIA Tesla K40 GPU used for this research.
Disclosures: Steven Mocking—RELATED:Grant: National Institutes of Health, Com-ments: R01NS059775, R01NS063925;UNRELATED: Employment:Alphabet (Google);
Stock/Stock Options: NVIDIA,Comments: as part of index funds only. Mark Bouts—
RELATED:Grant: National Institutes of Health,Comments: grant No: R01NS059775.* Elissa McIntosh—RELATED: Grant: National Institutes of Health, Comments: R01NS059775, R01NS063925.* Hakan Ay—UNRELATED:Royalties: UpToDate, Com-ments: authorship royalties. Konstantinos Kamnitsas—UNRELATED:Consultancy: Kheiron Medical,Comments: I consulted for them in the summer of 2017; Employ-ment: Microsoft Research Cambridge,Comments: I interned there in 2017 and 2018. Ben Glocker—UNRELATED:Consultancy: Kheiron Medical Technologies;Grants/ Grants Pending: European Research Council.* Ona Wu—RELATED:Grant: National Institutes of Health, Comments: R01NS38477, R01NS059775, R01NS063925, R01NS082285, P50NS051343, R01NS086905, U01 NS069208; National Institutes of Health–National Institute of Biomedical Imaging and Bioengineering, P41EB015896, 1S10RR019307*;Provision of Writing Assistance, Medicines, Equipment, or Adminis-trative Support: NVIDIA,Comments: NVIDIA Corporation donated a NVIDIA Tesla K40 GPU used for this research and a Titan XP (which was not used for the current study)*;UNRELATED:Consultancy: Penumbra,Comments: consultant on unrelated topics;Royalties: delay-compensated calculation of tissue blood flow, US Patent 7,512,435, March 31, 2009,Comments: We received royalties and licensing fees from the following companies: GE Healthcare, Siemens, Olea Medical, Imaging Biometrics Ltd.* Aneesh Singhal—UNRELATED:Consultancy: Biogen, Omniox, Boston Clinical Research Institute,Comments: Advisory Board;Expert Testimony: various law firms,
Comments: individual cases;Grants/Grants Pending: Dana Foundation and National
Institutes of Health,Comments: Clinical trial of VNS in stroke and U10 NS086729, 1U01NS095869, 1R01NS105875, U01 NS109028, 1R01DC012584*;Royalties: UpToDate,
Comments: book chapters;Other: American Academy of Neurology and MedLink,
Comments: educational programs and book chapters. W. Taylor Kimberly— UNRE-LATED:Board Membership: Biogen,Comments: Scientific Advisory Board*;Grants/ Grants Pending: Biogen (CHARM trial), National Institutes of Health, American Heart Association, Remedy Pharmaceuticals (GAMES-RP trial)*;Travel/Accommodations/ Meeting Expenses Unrelated to Activities Listed: Biogen,Comments: travel to CHARM trial investigator meeting to give training presentations to site Principal Investigators. A. Gregory Sorensen—RELATED: Grant: National Institutes of Health,
Comments: R01NS38477;UNRELATED: Board membership: Siemens Healthineers.
*Money paid to the institution.
REFERENCES
1. Chen L, Bentley P, Rueckert D.Fully automatic acute ischemic le-sion segmentation in DWI using convolutional neural networks.
Neuroimage Clin2017;15:633– 43CrossRef Medline
2. Straka M, Albers GW, Bammer R.Real-time diffusion-perfusion mismatch analysis in acute stroke.J Magn Reson Imaging2010;32: 1024 –37CrossRef Medline
3. Jacobs MA, Mitsias P, Soltanian-Zadeh H, et al.Multiparametric MRI tissue characterization in clinical stroke with correlation to clinical outcome: Part 2.Stroke2001;32:950 –57CrossRef Medline
4. Hevia-Montiel N, Jimenez-Alaniz JR, Medina-Banuelos V, et al. Ro-bust nonparametric segmentation of infarct lesion from diffusion-weighted MR images.Conf Proc IEEE Eng Med Biol Soc2007;2007: 2102– 05Medline
5. Tsai JZ, Peng SJ, Chen YW, et al.Automatic detection and quantifi-cation of acute cerebral infarct by fuzzy clustering and histographic characterization on diffusion weighted MR imaging and apparent diffusion coefficient map. Biomed Res Int 2014;2014:963032
CrossRef Medline
6. Zhang R, Zhao L, Lou W, et al.Automatic segmentation of acute isch-emic stroke from DWI using 3-D fully convolutional DenseNets.IEEE Trans Med Imaging.2018;37:2149 – 60CrossRef Medline
7. Mujumdar S, Varma R, Kishore LT.A novel framework for segmen-tation of stroke lesions in diffusion weighted MRI using multiple b-value data.In:Proceedings of the Conference of the International Association for Pattern Recognition,Tsukuba, Japan.November 11– 15, 2012:3762– 65
8. Kamnitsas K, Bai W, Ferrante E, et al.Ensembles of multiple models and architectures for robust brain tumour segmentation.In: Cri-mini A, Bakas S, Kuijf H, et al, eds.Brainlesion: Glioma, Multiple Sclerosis, Stroke and Traumatic Brain Injuries. Cham: Springer-Verlag; 2018:450 – 62
9. Albers GW, Marks MP, Kemp S, et al; DEFUSE 3 Investigators.
Thrombectomy for stroke at 6 to 16 hours with selection by perfu-sion imaging.N Engl J Med2018;378:708 –18CrossRef Medline
10. Nogueira RG, Jadhav AP, Haussen DC, et al; DAWN Trial Investigators.
Thrombectomy 6 to 24 hours after stroke with a mismatch between deficit and infarct.N Engl J Med2018;378:11–21CrossRef Medline
11. Wu O, Schwamm LH, Garg P, et al.Using MRI as the witness: mul-timodal MRI-based determination of acute stroke onset.Stroke 2010;41:E273
12. Wu O, McIntosh E, Bezerra R, et al.Prediction of lesion expansion in patients using acute MRI.Stroke2012;43:A3319
13. Wu O, Koroshetz WJ, Ostergaard L, et al.Predicting tissue outcome in acute human cerebral ischemia using combined diffusion- and perfu-sion-weighted MR imaging.Stroke2001;32:933– 42CrossRef Medline
14. Sorensen AG, Wu O, Copen WA, et al.Human acute cerebral ischemia: detection of changes in water diffusion anisotropy by using MR imaging.Radiology1999;212:785–92CrossRef Medline
15. Smith SM.Fast robust automated brain extraction.Hum Brain Mapp2002;17:143–55CrossRef Medline
16. Jenkinson M, Beckmann CF, Behrens TE, et al.FSL.Neuroimage 2012;62:782–90CrossRef Medline
18. Maier O, Menze BH, von der Gablentz J, et al.ISLES 2015: a public evaluation benchmark for ischemic stroke lesion segmentation from multispectral MRI.Med Image Anal2017;35:250 – 69CrossRef Medline
19. Lansberg MG, Lee J, Christensen S, et al.RAPID automated pa-tient selection for reperfusion therapy: a pooled analysis of the Echoplanar Imaging Thrombolytic Evaluation Trial (EPITHET) and the Diffusion and Perfusion Imaging Evaluation for Under-standing Stroke Evolution (DEFUSE) study. Stroke 2011;42: 1608 –14CrossRef Medline
20. Leslie-Mazwi TM, Hirsch JA, Falcone GJ, et al.Endovascular stroke treatment outcomes after patient selection based on magnetic res-onance imaging and clinical criteria.JAMA Neurol2016;73:43– 49
CrossRef Medline
21. Dijkhuizen RM, Knollema S, van der Worp HB, et al.Dynamics of cerebral tissue injury and perfusion after temporary hypoxia-isch-emia in the rat: evidence for region-specific sensitivity and delayed damage.Stroke1998;29:695–704CrossRef Medline
22. Jiang Q, Chopp M, Zhang ZG, et al.The temporal evolution of MRI tissue signatures after transient middle cerebral artery occlusion in rat.J Neurol Sci1997;145:15–23CrossRef Medline
23. Schwamm LH, Wu O, Song SS, et al; MR WITNESS Investigators.
Intravenous thrombolysis in unwitnessed stroke onset: MR WITNESS trial results. Ann Neurol 2018;83:980 –93 CrossRef Medline