January 2014
Life on point youth development program outcomes
Life on point youth development program outcomes
Christopher S. Horne
University of Tennessee at Chattanooga, [email protected]
Follow this and additional works at: https://scholar.utc.edu/jafh
Part of the Family, Life Course, and Society Commons, and the Social Work Commons
Recommended Citation Recommended Citation
Horne, Christopher S. (2014) "Life on point youth development program outcomes," Journal of Adolescent and Family Health: Vol. 6 : Iss. 1 , Article 2.
Available at: https://scholar.utc.edu/jafh/vol6/iss1/2
The Life On Point youth development program has the goal of equipping youths with life skills and personal assets that promote their positive development and help them avoid risk behaviors. The program is one of several widely used Positive Youth Development programs, with the program implemented by over 80 schools and community groups in 15 states. While the program has been evaluated routinely by collecting pre- and post-program data from the youth participants, the study reported here is based on the program’s first external evaluation following an experimental design. This experimental evaluation found significant positive differences among program participants in comparison to control group participants on measures of the program’s targeted outcomes, both in terms of statistical significance and substantial effect sizes.
The original version of the Life On Point curriculum, Road to Excellence Leadership Development Program, was developed in 1998, a time when asset-based approaches to youth development programming were supplanting deficit-based approaches (Catalano, Berglund, Ryan, Lonczak, and Hawkins, 2004). In 2009, the curriculum was revised based on findings from a decade of ongoing evaluation, renamed Life On Point, and is now in its second edition (Pearson, 2012). Life On Point targets five asset domains for development in youth participants: (1) Healthy choices: Positive attitudes and intentions about abstaining from sex, alcohol and drug use, and violence; (2) Academic attachment: Commitment to working hard and staying in school; (3) Self-efficacy in resisting negative peer pressure: Confidence in being able to say “no” if friends exert pressure to participate in sexual activity, alcohol and drug use, and violence; (4) Positive social support: Perception of positive support from peers and adults for working toward positive life goals; and (5) Positive life vision: Having a positive attitude about one’s future and the ability to make decisions that will have a positive effect on one’s future.
The approach of the program is cognitive, experiential, and social; trained adult facilitators help youth learn, practice, and apply skills for self-reflection, goal setting, and behavior regulation, and the youths’ activities are embedded in social interactions that establish and reinforce positive behavioral and attitudinal norms. Youths in the program are enrolled in small groups that meet once or twice per week for about 15 weeks. The curriculum is differentiated for high school and middle school youth; the focus of this evaluation is the middle school program. The Life On Point
the youth participants to develop their own positive answers to four questions: Who am I becoming, why am I here, where am I going in life, and what is my purpose on earth? Pedagogical strategies include lessons taught by On Point facilitators, role-playing activities, small-group discussions, individual exercises, self-reflection homework assignments, and service projects.
Method
Participants
Seventy-seven students at an urban public middle school participated in the evaluation during the 2011 – 2012 academic year. The school faces challenges typical of many urban middle schools; most of the students come from low-income households, with 99% of the approximately 450 students eligible for the federal free and reduced lunch program and about 78% of the students’ standardized reading and math test scores below the proficient level. Participation in Life On Point is voluntary. Students were recruited for participation by program staff during orientation meetings and through conversations with students during the school lunch hour. Students were considered recruited for the evaluation only after returning consent forms signed by their parents and themselves. Of the students recruited, 71% were female; 91% were black, 9% were white, and 1% were another race; 40% were 8th graders, 52% were 7th graders, and 8% were 6th graders; and the
mean age was 12.7 years and ranged from 11 to 14 years.
Procedure
The evaluation followed a classic experimental design, with students in both groups completing pretest and posttest questionnaires measuring outcomes targeted by the Life On Point program. The pretest questionnaire was administered to all the students before they knew whether they had been assigned to participate in Life On Point during the fall or spring semester. The posttest questionnaire was administered to all students after the treatment group had completed the 15-week program. The questionnaires were administered by program staff. Students were encouraged to provide honest responses to help understand and improve the program. They were assured their responses would remain anonymous, and they were able to place their completed questionnaires directly in envelopes.
The pretest and posttest questionnaires include the same set of 20 items used to construct scales measuring the five targeted outcomes: Healthy life choices (with subscales for resisting alcohol use, drug use, violence, and sexual activity), academic attachment, sense of self-efficacy in resisting negative peer pressure, positive life vision, and positive social support. Five additional items included only on the treatment group’s posttest questionnaire measure their perceptions of the quality of the Life On Point
program. All of these items are constructed as statements that the students respond to using a 7-point agreement scale (completely agree, mostly agree, slightly agree, neither agree nor disagree, slightly disagree, mostly disagree, completely disagree). Scales for each outcome are calculated by assigning scores of 0 – 6 to the response categories (with higher scores always meaning “better” in terms of outcomes) and averaging across the scales’ items. The validity of these scales has been tested following a criterion validity approach by comparing them to similar scales on the widely used Search Institute’s Developmental Assets Profile in a sample of 62 middle school students. Moderate-to-strong correlations between each of the Life On Point Youth Questionnaire scales and the related Development Assets Profile
scales provide empirical support for the scales’ validity. In a separate sample of 302 students from three middle schools, the instrument's scales all demonstrated reliability at Cronbach's alpha > .7. (See details about validity and reliability testing in the appendix.)
Examples of the items measuring attitudes toward making healthy choices include:
“Getting drunk every once in a while fits with the kind of person I want to be.”
“Having sex every once in a while fits with the kind of person I want to be.”
“I do my best on all my school assignments.”
“I want to drop out of school as soon as I can.”
Examples of items measuring self-efficacy in resisting negative peer pressure include:
“If my best friend offered me an illegal drug and I did not want it, I am sure I could say ‘no.’”
“If my friends wanted to skip class with me and I did not want to, I am sure I could say ‘no.’”
Examples of items measuring positive life vision include:
“I can make choices that will have a positive impact on my future.”
“Planning for the future is a waste of time for me.”
Examples of items measuring positive social support include:
“I have close friends who want me to do well in school.”
“I have close friends who encourage me to make decisions that are good for me.”
Examples of items measuring perception of program quality include:
“The adult leader in this group had a good relationship with me.”
“This group has given me information to help me make smart choices for myself.”
While this evaluation’s experimental design is ideal for determining the effectiveness of Life On Point in a particular context, additional research is needed to assess its generalizability, a limitation of most experimental evaluations. Additional research is also needed to investigate the links between short-term, self-reported changes in attitudes and perceptions and the longer-term behavioral changes assumed to follow. Finally, a longitudinal approach would more fully evaluate Life On Point, which often serves youths over the course of several years.
Results and Discussion
The treatment group met after school 21 times over 15 weeks. The students’ mean number of sessions attended was 16; the median was 18. Three students were dropped from the evaluation due to not attending any sessions, leaving 36 participants in the treatment group. Five control group students were unavailable to complete the posttest, leaving 33 participants in the control group.
in the group (92%) and with the group leader (92%), that they developed supportive friendships in the group (86%), and that the group gave them information to help them make smart choices (95%).
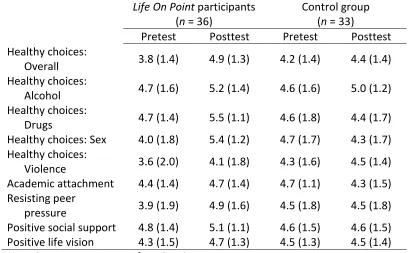
To get a sense of the overall effects of the program, changes in outcome measures were compared at the group level. Table 1 reports the mean pretest and posttest outcome scale scores for the Life On Point
[image:7.612.101.512.280.533.2]participants and control
Table 1. Mean scores (and standard deviations) on scales measuring Life On Point outcomes, before and after the program, for Life On Point participants and control group youths
Life On Point participants (n = 36)
Control group (n = 33)
Pretest Posttest Pretest Posttest Healthy choices:
Overall 3.8 (1.4) 4.9 (1.3) 4.2 (1.4) 4.4 (1.4) Healthy choices:
Alcohol 4.7 (1.6) 5.2 (1.4) 4.6 (1.6) 5.0 (1.2) Healthy choices:
Drugs 4.7 (1.4) 5.5 (1.1) 4.6 (1.8) 4.4 (1.7) Healthy choices: Sex 4.0 (1.8) 5.4 (1.2) 4.7 (1.7) 4.3 (1.7) Healthy choices:
Violence 3.6 (2.0) 4.1 (1.8) 4.3 (1.6) 4.5 (1.4) Academic attachment 4.4 (1.4) 4.7 (1.4) 4.7 (1.1) 4.3 (1.5) Resisting peer
pressure 3.9 (1.9) 4.9 (1.6) 4.5 (1.8) 4.5 (1.8) Positive social support 4.8 (1.4) 5.1 (1.1) 4.6 (1.5) 4.6 (1.5) Positive life vision 4.3 (1.5) 4.7 (1.3) 4.5 (1.3) 4.5 (1.4)
Note. Outcome scores range from 0 to 6.
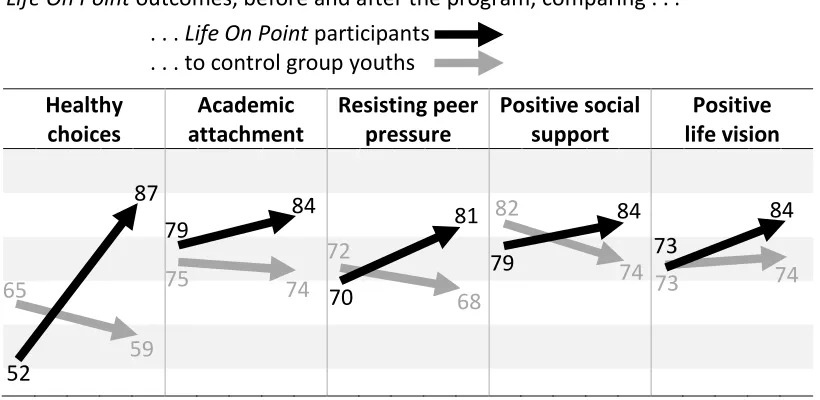
and violence showed the largest increase, with the percentage of Life On Point participants with average positive responses increasing from 52% to 87%, while the control group percentage decreased from 65% to 59%. The treatment group percentage increased 5 points for the academic attachment and positive social support outcome measures, 11 points for the resisting peer pressure outcome measure, and 11 points for the positive life vision outcome measure.
Figure 1. Percentage of youths with average positive scores on scales measuring Life On Point outcomes, before and after the program, comparing . . .
. . . Life On Point participants . . . to control group youths
Healthy choices
Academic attachment
Resisting peer pressure
Positive social support
Positive life vision
While intuitive, these analyses do not compare change at the level of the individual participant or control for the differences in pretest scores (see Table 1). ANCOVA analyses were conducted to achieve a more nuanced understanding of changes in outcome measures for the treatment and control groups over the course of the treatment group’s program participation. Each ANCOVA included one of the posttest outcome measure scales as the dependent variable, the associated pretest outcome measure scale as a covariate, and group membership (treatment or control) as a fixed factor. With multiple dependent variables, an alternative approach would be MANOVA to limit the risk of making a Type I error. This evaluation’s sample size, however, does not permit MANOVA. To evaluate the risk of Type I error, ANCOVAs for the five outcome measures were first conducted at an a priori alpha level of 0.01; these models had significant F-tests for the same outcomes as those reported below, which were calculated at the 52
87
84 79
70
81
79
84 73
84
65
59
75 74
72
68 82
conventional 0.05 alpha level. Further, ANCOVA analyses for the four healthy choices subscales were conducted only after the ANCOVA analysis for the overall healthy choices scale was found to achieve a statistically significant F -test and a substantively significant treatment effect estimate. All ANCOVA analyses reported below met the homogeneity of variances assumption with nonsignificant (p > .05) Levene’s tests.
[image:9.612.105.508.288.615.2]Results of the ANCOVA analyses are summarized in Table 2. Life On Point’s positive effects are statistically significant at the conventional p < .05 level on the overall healthy choices scale, the subscales for healthy attitudes
Table 2. Results of Analysis of Covariance (ANCOVA) for Life On Point and control group participants’ posttest outcome scores, controlling for pretest scores
Outcome F(df) p
Adjusted score, treatment
group
Adjusted score, control
group
Effect size (Hedges’s g*)
Healthy choices:
Overall 4.93 (1, 58) .03 5.1 4.4 0.62
Healthy choices:
Alcohol 1.85 (1, 67) .18 5.4 4.9 0.35
Healthy choices:
Drugs 14.86 (1, 66) <.001 5.7 4.4 1.00 Healthy choices:
Sex 15.89 (1, 67) <.001 5.6 4.3 1.03 Healthy choices:
Violence 0.03 (1, 67) .85 4.3 4.4 -0.05 Academic
attachment 1.55 (1,58) .22 5.8 5.4 0.35 Resisting peer
pressure 1.32 (1, 64) .25 5.0 4.5 0.31
Positive social
support 4.85 (1, 64) .03 5.3 4.6 0.60
Positive life
vision 2.81 (1, 60) .10 4.9 4.4 0.47
toward drugs and sex, the positive social support scale, and, at the less strict
p < .10 significance level, on the positive life vision scale. More important than the statistical significance is the substantive significance of the differences observed between the Life On Point participants and the control group. For the statistically significant results, effect sizes range from a small (following the conventions suggested by Cohen, 1988) effect size of 0.47 on the positive life vision scale and a medium effect size of 0.60 on the positive social support scale to large effect sizes of 1.00 and 1.03 on the drugs and sex attitude subscales, respectively.
Conclusion
In addition to the challenges of raising funds, recruiting participants, and finding time in school schedules, Positive Youth Development programs face a challenge that seems, itself, a function of typical youth development: The decreases in measures of positive development observed in this study’s control group are consistent with previous research that reports a tendency for the values and self-perceptions that protect adolescents from choosing risky behaviors to weaken, particularly during the middle school years (Scales, Benson, Roehlkepartain, Sesma, and Van Dulmen, 2006). This study’s findings provide evidence that Positive Youth Development approaches, in general, and Life On Point, specifically, can help reverse this tendency and promote youths’ adoption of pro-social norms, social support, and resistance to risky behaviors. The program’s substantial, positive effects on indicators of positive development support broader implementation and evaluation of
Appendix: Empirical assessments of the reliability and validity of the Life On Point Youth Questionnaire
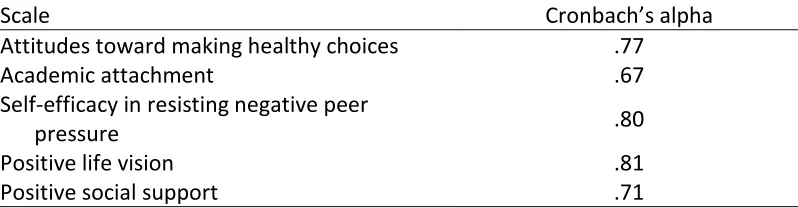
[image:11.612.108.507.306.410.2]The reliability of the Life On Point Youth Questionnaire was originally evaluated based on questionnaires completed by a larger sample of 302 students from three middle schools who participated in Life On Point. Four of the instrument’s scales demonstrated an acceptable-to-good level of reliability at the conventional standard of Cronbach’s alpha > .7, with the academic attachment scale just below the .7 cutoff at .67 (Table A1). For the sample in the current study, the scales demonstrated alpha coefficients between .70 and .82.
Table A1. Reliability estimates for outcome scales
Scale Cronbach’s alpha
Attitudes toward making healthy choices .77
Academic attachment .67
Self-efficacy in resisting negative peer
pressure .80
Positive life vision .81
Positive social support .71
The validity of the scales was tested empirically following a concurrent criterion validity testing approach. The Life On Point Youth Questionnaire scale scores of 62 students at a racially and economically diverse suburban middle school were compared to their scores on related scales from the Search Institute’s Developmental Assets Profile (DAP). These students took the Life questionnaire and the DAP after participating in the semester-long Life On Point program. The DAP is a widely used standardized instrument developed by Search Institute that measures the extent to which youths possess key developmental assets. Search Institute defines “developmental assets” as “positive experiences and qualities that help influence choices young people make and help them become caring, responsible adults” (www.search-institute.org). The DAP has, itself, been found to demonstrate strong reliability and validity in measuring concepts similar to those measured by the Life On Point Youth Questionnaire (for example, Oman, Vesely, and McLeroy, 2002; Taylor et al, 2002; Vesely et al, 2004).
The DAP can also be used to calculate an overall internal assets score, which combines scores from the commitment to learning, positive values, social competencies, and positive identity scales. From the scales’ descriptions, it is clear that the concepts measured by the two instruments are related, but they are not directly analogous. If the Life questionnaire measures what it purports to measure, then, its scales should have positive, moderate-to-strong correlations with the related DAP scales.
Table A2. Comparison of Life On Point Youth Questionnaire and Developmental Assets Profile scales
Life scales Developmental Assets Profile scalesa
Healthy choices: Positive attitudes and
intentions about abstaining from sex, alcohol and drug use, and violence (with subscales for attitudes and
intentions toward sex, alcohol use, drug use, and violence)
Boundaries and expectations: Whether a
child feels he or she must abide by
boundaries and expectations set at home, in school, and in their neighborhoods
Positive values: Seeks to understand if
children value taking responsibility for their actions and helping others, are honest, and have respect for others and their community
Academic attachment: Commitment to
working hard and staying in school
Commitment to learning: Whether
children care about school and
completing their homework, as well as appreciate learning new things
Self-efficacy in resisting negative peer
pressure: Confidence in being able to
say “no” if friends exert pressure to participate in sexual activity, alcohol and drug use, and violence
Social competencies: A child’s willingness
to express his or her feelings, establish relationships with others, say no to activities or suggestions that are
dangerous, and can find positive ways to deal with hardships
Positive social support: Perception of
positive support from peers and adults for working toward positive life goals
Support: Whether children have caring
adults in their lives, which may include parents, neighbors, and/or teachers
Empowerment: How safe children feel at
school and at home, as well as their perception of being valued and appreciated
Positive life vision: Having a positive
attitude about one’s future and the ability to make decisions that will have a positive effect on one’s future
Positive identity: Measures a child’s
self-worth
Positive values (see description above)
a
Table A3. Correlations between Life On Point Youth Questionnaire scales and related Developmental Assets Profile scales
Life scales DAP scales Pearson’s r (p-value)
Healthy choices: Overall Boundaries and expectations Positive values Internal assets .50 (<.001) .52 (<.001) .58 (<.001)
Healthy choices: Alcohol Boundaries and expectations Positive values Internal assets .44 (.001) .44 (.001) .51 (<.001)
Healthy choices: Drugs Boundaries and expectations Positive values Internal assets .36 (.006) .39 (.003) .37 (.006)
Healthy choices: Sex Boundaries and expectations Positive values Internal assets .30 (.030) .39 (.003) .40 (.002) Healthy choices: Violence Boundaries and expectations Positive values Internal assets .40 (.002) .39 (.003) .48 (<.001)
Academic attachment Commitment to learning Internal assets
.63 (<.001) .60 (<.001)
Self-efficacy in resisting negative peer pressure
Social competencies Internal assets
.42 (.001) .53 (<.001)
Positive social support Support Empowerment Internal assets
.47 (<.001) .61 (<.001) .44 (.001)
Positive life vision Positive identity Positive values Internal assets
References
Catalano, R. F., Berglund, M. L., Ryan, J. A. M., Lonczak, H. S., & Hawkins, J. D. (2004). Positive Youth Development in the United States: Research findings on evaluations of Positive Youth Development programs.
Annals of the American Academy of Political and Social Science, 591, 98–124.
Cohen, J. (1988). Statistical Power Analysis for the Behavioral Sciences (2nd
edition). Hillsdale, New Jersey: Lawrence Erlbaum Associates.
Hedges, L. V. (1981). Distribution theory for Glass’s estimator of effect size and related estimators. Journal of Educational and Behavioral Statistics, 6(2), 107–128.
Hemphill, J. F. (2003). Interpreting the magnitudes of correlation coefficients.
American Psychologist, 58(1), 78-80.
Oman, R. F., Vesely, S. K., McLeroy, K. R. (2002). Reliability and validity of the Youth Asset Survey (YAS). Journal of Adolescent Health, 31(3), 247-255.
Pearson, A. E. (2012). Life On Point Leadership Development Program: Middle School Core Series (2nd edition). Hixson, Tennessee: On Point.
Scales, P. C., Benson, P. L., Roehlkepartain, E. C., Sesma, A., & Van Dulmen, M. (2006). The role of developmental assets in predicting academic achievement: A longitudinal study. Journal of Adolescence, 29, 691– 708.
Taylor, C. S., Lerner, R. M., von Eye, A., Bobeck, D. L., Balsano, A. B., Dowling, E., and Anderson, P. M. (2003). Positive individual and social behavior among gang and non-gang African American male adolescents. Journal of Adolescent Research, 18, 496-522.