Proceedings of the 12th International Workshop on Semantic Evaluation (SemEval-2018), pages 853–857
SciREL at SemEval-2018 Task 7: A System for Semantic Relation
Extraction and Classification
Darshini Mahendran Chathurika S. Wickramasinghe Bridget T. McInnes Virginia Commonwealth University, Richmond, Virginia
{mahendrand, brahmanacsw, btmcinnes}@vcu.edu
Abstract
This paper describes our system, SciREL (Sci-entific abstract RELation extraction system), developed for the SemEval 2018 Task 7: Se-mantic Relation Extraction and Classification in Scientific Papers. We present a feature-vector based system to extract explicit se-mantic relation and classify them. Our sys-tem is trained in the ACL corpus (Bird et al., 2008) that contains annotated abstracts given by the task organizers. When an abstract with annotated entities is given as the input into our system, it extracts the semantic relations through a set of defined features and classi-fies them into one of the given six categories of relations through feature engineering and a learned model. For the best combination of features our system SciREL obtained an F-measure of 20.03 on the official test corpus in the relation classification Subtask 1.1. In this paper, we provide an in-depth error analysis of our results to prevent duplication of research efforts in the development of future systems.
1 Introduction
Automatic detection and extraction of semantic relations among the entities from unstructured text has received growing attention in the recent years (Konstantinova, 2014), (Augenstein et al.,
2017), (Fundel et al., 2006), (Luo et al., 2016). Text mining is the process of automatically ex-tracting knowledge from unstructured text docu-ments and this idea of text mining is to link ex-tracted information together which possibly re-sults in new facts or hypothesis to be explored fur-ther through conventional scientific experimenta-tions (Delen and Crossland, 2008), (Fleuren and Alkema,2015).
SemEval 2018 Task 7 (G´abor et al.,2018) aims to extract and classify semantic relations to im-prove the access to scientific literature. Their tasks
focus on identifying pairs of entities that are in-stances of six semantic relation types and classi-fying those instances into one of the six seman-tic relation types. To address this challenge, we implemented a supervised machine learning based approach in order to extract explicit semantic rela-tions from the ACL anthology corpus (Bird et al.,
2008) for Subtask 1.1.
2 Methodology
In this section, we describe our relation extraction system (SciREL) which classifies the semantic re-lations into one of the given six categories of rela-tions. The main steps of our approach can be sum-marized as follows. First, an abstract with anno-tated entities is given as the input into our system and all the sentences in the abstract are segmented, preprocessed, and the entity pairs are identified. Second, a set of features are defined and are com-bined into a feature vector which is used to train a machine learning model. This is the most cru-cial part of our system, as the idea is to decrease the size of the effective vocabulary which would in turn increase the classification accuracy by elimi-nating the noise in the features (GuoDong et al.,
2005). Relations between entities are extracted and classified into one of the six relations through this learned model. Each step of our approach is discussed in detail in the following subsections.
2.1 Preprocessing Steps
All sentences in the abstracts are preprocessed to normalize the text so that the input text is guaranteed to be consistent and feature extrac-tion/classification is simplified. Some of the exist-ing NLP techniques and tools are used for prepro-cessing. Preprocessing is performed as follows1: 1Natural Language Toolkit’s (NLTK) Tokenizers, part-of-speech (POS) tagger and Porter Stemmer are used in text pre-processing.
1) tokenization; 2) convert text to lower case; 3) removal of special characters; and 4) lemmatiza-tion.
2.2 Feature selection
The most challenging part of our system is the feature selection and the feature vector generation (Sammons et al., 2016). After preprocessing the input text, a subset of words which contain the respective entity pair are selected from each sen-tences, a set of features are computed and a fea-ture vector is created by combining the computed features.
After the initial text processing, a separate set of steps are followed where each feature is com-puted. Some features are extracted in two differ-ent scenarios: before removing the stop words and after removing the stop words. Stop words are the most common words of the language that do not contribute to the semantics of the documents or contain any significance but has a high frequency. Filtering out such words prevents from returning vast amount of unnecessary information.
Bigram is a sequence of words formed from two adjacent words, and bigram frequency of the word pairs between entities is calculated in some fea-tures. Collocations2are words that appear
succes-sively and the frequencies of such words appearing in the the context of other words are calculated in some features and the highest value of the bigram collocations is considered during the feature selec-tion. The bag-of-words model which represents a text as the bag of its words, ignoring its grammar and word order is used in some features to group the words from the sentence for further processing (Peng et al.,2016).
Part-of-speech tagging (POS tagging) is applied on words in some features which assigns parts of speech to those words (Fundel et al., 2006). This helps in disambiguating homonyms and im-proving the efficiency of feature selection. Term frequency-inverse document frequency (TF-IDF) values are calculated for a set of selected words in some features to distinguish important words based on how frequently they appear across multi-ple documents (GuoDong et al.,2005). During the feature selection, a representative set of features is computed for each entity pair. Features used in building our system are listed below; E1 refers to
2Natural Language Toolkit’s (NLTK) bigramcollocation-finder is used.
the first entity and E2 refers to the second entity.
1. Number of words before E1 with / without stop words
2. Number of words after E2 with / without stop words
3. Word before E1 4. Word after E2
5. POS of the words before E1 with / without stop words
6. POS of the words after E1 with / without stop words
7. POS of the words before E2 with / without stop words
8. POS of the words after E2 with / without stop words
9. Bigram of the first word before E1 with / without stop words
10. Bigram of the first word after E2 with / with-out stop words
11. Bigram of E1 12. Bigram of E2
13. Highest bigram value of words in between entities with / without stop words
14. Number of unique POS types in between the entities with / without stop words
15. Number of unique POS types before E1 with / without stop words
16. Number of unique POS types after E2 with / without stop words
17. POS type of the word with highest tf-idf score in between the entities
18. POS type of the word with highest tf-idf score in before E1
19. POS type of the word with highest tf-idf score in after E2
2.3 Multi-class classification
In the final step of our approach, a feature vector is generated for each sentence by incorporating the extracted features in the previous step. The gener-ated feature vector is then used to train a classi-fier which classifies the relation into the given six categories. The following classifiers which repre-sent three main classification algorithms are used to train and evaluate the data set in our approach:3
Decision Trees, Naive Bayes, and Support Vector Machines (SVMs). The resulting model is then used to classify the extracted semantic relations into one of the six categories below: Usage, Re-sult, Model-feature, Part-whole, Topic, Compare.
3 Dataset
We evaluated our system on the dataset provided by the SemEval 2018 - Task 7. The dataset con-tains abstracts from the ACL Anthology Corpus (Bird et al.,2008) with pre-annotated entities that represent concepts. The dataset provided for the evaluation is divided into two subsets: training set and test set. The training set includes 350 abstracts containing 5259 entities and 1228 annotated types of relations between entities. The test set includes 150 abstracts containing 2246 entities and 355 an-notated types of relations between entities. During the development, the training set is split into 60/40 and k-fold cross validation was used to evaluate the performance.
4 Results
Our system was evaluated on both the develop-ment corpus and the official test corpus and the set of features are extracted for each entity pair from the training corpus which was used to compute the feature vector. The feature set of our model in-cluded 37 features in total which resulted in 237
combinations of features. We conducted an abla-tion study to determine the efficacy of the ent combinations of features when run with differ-ent classifiers and selected the feature combination that resulted in high performance. Consequently, it was found that the following features produce the best performance:
1. Lexical information
• Bigram of the first word after E1 with
stop words
• Bigram of the first word before E2 with-out stop words
• Highest bigram value of words in
be-tween entities with stop words
• Highest bigram value of words in be-tween entities without stop words 2. Syntactic information
• POS of the word before E2 with stop words
• Number of unique POS types in be-tween the entities with stop words
• Number of unique POS types in
be-tween the entities without stop words
Validation was performed using 60/40 split evaluation. Performance of each classifier was
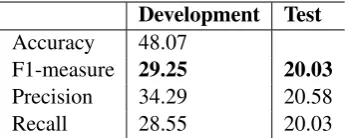
Development Test
Accuracy 48.07
F1-measure 29.25 20.03
Precision 34.29 20.58 Recall 28.55 20.03
Table 1: Performance of our model on the develop-ment and official test corpus.
U MF PW R C T
USAGE (U) 119 5 24 18 2 7
MODEL-FEATURE (MF) 12 1 5 1 0 1
PART-WHOLE (PW) 29 1 17 18 0 1
RESULT (R) 48 0 13 5 0 4
COMPARE (C) 2 0 1 0 0 0
TOPIC (T) 15 1 2 0 0 3
Table 2: Confusion matrix of the model trained on the official test corpus where the predicted tags are hori-zontal and the actual tags are vertical.
measured by the following commonly used eval-uation metrics: Accuracy, F-measure, Precision, Recall. Our model was evaluated using three clas-sifiers and it was found that SVMs is the most suit-able classifier for our approach through a set of experiments. The results for our development cor-pus and the official test corcor-pus are presented in the Table1.
From the Table 1 we can see that our system (SciREL) achieves the accuracy of 48.07 and the F-measure of 29.25 on the development corpus which includes 350 abstracts and the F-measure of 20.03 on the official test corpus which includes 150 abstracts.
5 Error analysis
The performance of our system is quite low there-fore, we performed an error analysis to identify some of the mistakes from our system output and find ways to improve it. Our classification model was trained to distinguish between six semantic lations and the confusion matrix displays the re-sults of testing the model for further inspection. Table2 shows the confusion matrix based on the performance of our classification model trained on the test corpus. We identified three main areas which affected the performance of our system: 1) feature selection; 2) vector representation; and 3) class imbalance.
[image:3.595.330.504.62.131.2]for the lexical information, we are only incorpo-rating the word prior to each of the entities and a single bigram that exists between them. This misses information such as if there is only a sin-gle word in between the entities, and in the case were there are more than two words, we miss ad-ditional contextual information describing the re-lationship. Second the syntactic information does not contain an explicit representation of what was seen between the two entities. We focused on the number of unique types of POS tags rather than what type of tags were actually present. In conclu-sion, we believe that our feature set does contain enough contextual information from between the two entities.
Vector representation. Another major reason for the poor performance of our system is the way the feature vectors are representing the relation-ship. We generated a feature vector for each en-tity pair and for all the proposed features which resulted in a feature vector with only 37 features initially. Then, we selected the best set of features that gave the best performance with the model and eliminated the rest, which reduced the size of the feature vector further and we ended up with the feature vector that contained only 7 features. Each feature was represented numerically, therefore if there were more than one bigram, or POS tag se-quence between the entities, we were not able to incorporate it into our representation. In addition, analysis of the test instances show that for 100 of the 355 instances, we do not have any contextual or syntactic information due to the stop word re-moval for three of the features. In conclusion, we believe that this feature vector representation is too compact and does not hold sufficient contextual information to identify patterns between the rela-tionships.
Class Imbalance. From Table 2, we can see most of the instances of the USAGE class are cor-rectly classified and most of the misclassified in-stances are classified under PART-WHOLE and RESULT. Most of the instances that should have been classified under PART-WHOLE are classi-fied under USAGE and RESULT. None of the in-stances of the class COMPARE are classified cor-rect and again most of them are classified un-der the class USAGE. A similar behavior is ob-served with TOPIC where almost all instances are classified under USAGE. Reason for this ob-servation is mainly due to the imbalanced
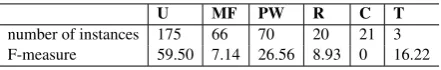
na-U MF PW R C T
number of instances 175 66 70 20 21 3 F-measure 59.50 7.14 26.56 8.93 0 16.22
Table 3: Number of instances and the F-measure of the given six classes on the official test corpus where U - USAGE, MF- MODEL-FEATURE, PW- PART-WHOLE, R- RESULT, C- COMPARE, T- TOPIC.
ture of the dataset used to train our system. The number of instances belonging to the classes US-AGE, MODEL-FEATURE and PART-WHOLE is approximately five times larger than the number of instances of the rest of the classes. For com-parison purposes, we have provided the number of instances of each class and their individual F-measures in the Table 3. From the results, we can clearly see that USAGE which is the majority class shows high performance compared to other categories. In conclusion, we can say most of the misclassified instances belong to the category of USAGE indicating that the machine learning al-gorithm was unable to identify discriminating fea-tures between the classes and defaulted to the ma-jority class.
6 Conclusions
[image:4.595.310.531.62.97.2]References
Isabelle Augenstein, Mrinal Das, Sebastian Riedel, Lakshmi Vikraman, and Andrew McCallum. 2017. Semeval 2017 task 10: Scienceie-extracting keyphrases and relations from scientific publica-tions. arXiv preprint arXiv:1704.02853.
Steven Bird, Robert Dale, Bonnie J Dorr, Bryan Gib-son, Mark Thomas Joseph, Min-Yen Kan, Dongwon Lee, Brett Powley, Dragomir R Radev, and Yee Fan Tan. 2008. The ACL anthology reference corpus: A reference dataset for bibliographic research in com-putational linguistics. pages 1755–1759.
Dursun Delen and Martin D Crossland. 2008. Seed-ing the survey and analysis of research literature with text mining. Expert Systems with Applications, 34(3):1707–1720.
Wilco WM Fleuren and Wynand Alkema. 2015. Ap-plication of text mining in the biomedical domain.
Methods, 74:97–106.
Katrin Fundel, Robert K¨uffner, and Ralf Zimmer. 2006. Relexrelation extraction using dependency parse trees. Bioinformatics, 23(3):365–371.
Kata G´abor, Davide Buscaldi, Anne-Kathrin Schu-mann, Behrang QasemiZadeh, Ha¨ıfa Zargayouna, and Thierry Charnois. 2018. Semeval-2018 Task 7: Semantic relation extraction and classification in scientific papers. In Proceedings of International Workshop on Semantic Evaluation (SemEval-2018), New Orleans, LA, USA.
Zhou GuoDong, Su Jian, Zhang Jie, and Zhang Min. 2005. Exploring various knowledge in relation ex-traction. InProceedings of the 43rd annual meeting on association for computational linguistics, pages 427–434. Association for Computational Linguis-tics.
Natalia Konstantinova. 2014. Review of relation ex-traction methods: What is new out there? In Inter-national Conference on Analysis of Images, Social Networks and Texts, pages 15–28. Springer.
Yuan Luo, ¨Ozlem Uzuner, and Peter Szolovits. 2016. Bridging semantics and syntax with graph algorithmsstate-of-the-art of extracting biomedical relations. Briefings in bioinformatics, 18(1):160– 178.
Yifan Peng, Chih-Hsuan Wei, and Zhiyong Lu. 2016. Improving chemical disease relation extraction with rich features and weakly labeled data. Journal of Cheminformatics, 8(1):53.