Impacts of dynamic managerial capability and international
opportunity identification on firm performance
MOSTAFIZ, Md Imtiaz, SAMBASIVAN, M and GOH, SK
Available from Sheffield Hallam University Research Archive (SHURA) at:
http://shura.shu.ac.uk/25047/
This document is the author deposited version. You are advised to consult the
publisher's version if you wish to cite from it.
Published version
MOSTAFIZ, Md Imtiaz, SAMBASIVAN, M and GOH, SK (2019). Impacts of dynamic
managerial capability and international opportunity identification on firm
performance. Multinational Business Review.
Copyright and re-use policy
See
http://shura.shu.ac.uk/information.html
Sheffield Hallam University Research Archive
List of Table
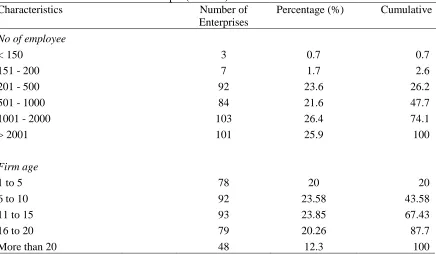
Table 1
Data characteristics of the sample (
N
= 390)
Characteristics
Number of
Enterprises
Percentage (%)
Cumulative
No of employee
< 150
3
0.7
0.7
151 - 200
7
1.7
2.6
201 - 500
92
23.6
26.2
501 - 1000
84
21.6
47.7
1001 - 2000
103
26.4
74.1
> 2001
101
25.9
100
Firm age
1 to 5
78
20
20
6 to 10
92
23.58
43.58
11 to 15
93
23.85
67.43
16 to 20
79
20.26
87.7
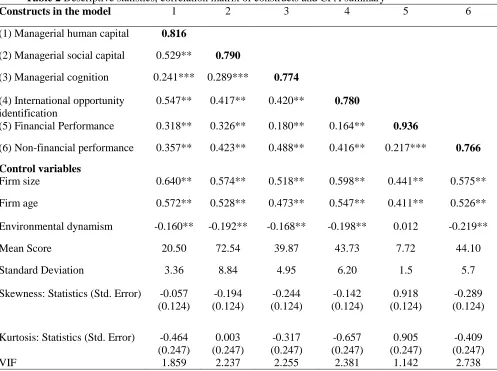
Table 2
Descriptive statistics, correlation matrix of constructs and CFA summary
Constructs in the model
1
2
3
4
5
6
(1) Managerial human capital
0.816
(2) Managerial social capital
0.529**
0.790
(3) Managerial cognition
0.241***
0.289***
0.774
(4) International opportunity
identification
0.547**
0.417**
0.420**
0.780
(5) Financial Performance
0.318**
0.326**
0.180**
0.164**
0.936
(6) Non-financial performance
0.357**
0.423**
0.488**
0.416**
0.217***
0.766
Control variables
Firm size
0.640**
0.574**
0.518**
0.598**
0.441**
0.575**
Firm age
0.572**
0.528**
0.473**
0.547**
0.411**
0.526**
Environmental dynamism
-0.160**
-0.192**
-0.168**
-0.198**
0.012
-0.219**
Mean Score
20.50
72.54
39.87
43.73
7.72
44.10
Standard Deviation
3.36
8.84
4.95
6.20
1.5
5.7
Skewness: Statistics (Std. Error)
-0.057
(0.124)
-0.194
(0.124)
-0.244
(0.124)
-0.142
(0.124)
0.918
(0.124)
-0.289
(0.124)
Kurtosis: Statistics (Std. Error)
-0.464
(0.247)
0.003
(0.247)
-0.317
(0.247)
-0.657
(0.247)
0.905
(0.247)
-0.409
(0.247)
VIF
1.859
2.237
2.255
2.381
1.142
2.738
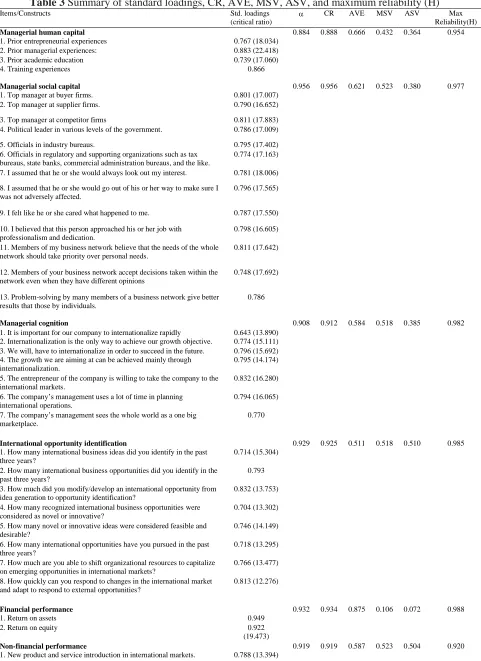
Table 3
Summary of standard loadings, CR, AVE, MSV, ASV, and maximum reliability (H)
Items/Constructs Std. loadings
(critical ratio)
CR AVE MSV ASV Max Reliability(H)
Managerial human capital 0.884 0.888 0.666 0.432 0.364 0.954 1. Prior entrepreneurial experiences 0.767 (18.034)
2. Prior managerial experiences: 0.883 (22.418) 3. Prior academic education 0.739 (17.060)
4. Training experiences 0.866
Managerial social capital 0.956 0.956 0.621 0.523 0.380 0.977 1. Top manager at buyer firms. 0.801 (17.007)
2. Top manager at supplier firms. 0.790 (16.652) 3. Top manager at competitor firms 0.811 (17.883) 4. Political leader in various levels of the government. 0.786 (17.009) 5. Officials in industry bureaus. 0.795 (17.402) 6. Officials in regulatory and supporting organizations such as tax
bureaus, state banks, commercial administration bureaus, and the like.
0.774 (17.163) 7. I assumed that he or she would always look out my interest. 0.781 (18.006) 8. I assumed that he or she would go out of his or her way to make sure I
was not adversely affected.
0.796 (17.565)
9. I felt like he or she cared what happened to me. 0.787 (17.550) 10. I believed that this person approached his or her job with
professionalism and dedication.
0.798 (16.605) 11. Members of my business network believe that the needs of the whole
network should take priority over personal needs.
0.811 (17.642)
12. Members of your business network accept decisions taken within the network even when they have different opinions
0.748 (17.692)
13. Problem-solving by many members of a business network give better results that those by individuals.
0.786
Managerial cognition 0.908 0.912 0.584 0.518 0.385 0.982 1. It is important for our company to internationalize rapidly 0.643 (13.890)
2. Internationalization is the only way to achieve our growth objective. 0.774 (15.111) 3. We will, have to internationalize in order to succeed in the future. 0.796 (15.692) 4. The growth we are aiming at can be achieved mainly through
internationalization.
0.795 (14.174) 5. The entrepreneur of the company is willing to take the company to the
international markets.
0.832 (16.280) 6. The company’s management uses a lot of time in planning
international operations.
0.794 (16.065) 7. The company’s management sees the whole world as a one big
marketplace.
0.770
International opportunity identification 0.929 0.925 0.511 0.518 0.510 0.985 1. How many international business ideas did you identify in the past
three years?
0.714 (15.304) 2. How many international business opportunities did you identify in the
past three years?
0.793 3. How much did you modify/develop an international opportunity from
idea generation to opportunity identification?
0.832 (13.753) 4. How many recognized international business opportunities were
considered as novel or innovative?
0.704 (13.302) 5. How many novel or innovative ideas were considered feasible and
desirable?
0.746 (14.149) 6. How many international opportunities have you pursued in the past
three years?
0.718 (13.295) 7. How much are you able to shift organizational resources to capitalize
on emerging opportunities in international markets?
0.766 (13.477) 8. How quickly can you respond to changes in the international market
and adapt to respond to external opportunities?
0.813 (12.276)
Financial performance 0.932 0.934 0.875 0.106 0.072 0.988
1. Return on assets 0.949
2. Return on equity 0.922
(19.473)
2. Time to market for new product and service internationally. 0.755 (12.380) 3. Number of successful new product and service in international
markets.
0.798 (12.916) 4. Global reach (i.e., presence in strategically located countries
worldwide).
0.758 (12.162) 5. International reputation of the firm. 0.744 (12.732) 6. Gaining a foothold in international markets. 0.763 (11.821) 7. Success of main international business. 0.791 (12.762) 8. Success of main international business from competitor perspective. 0.731
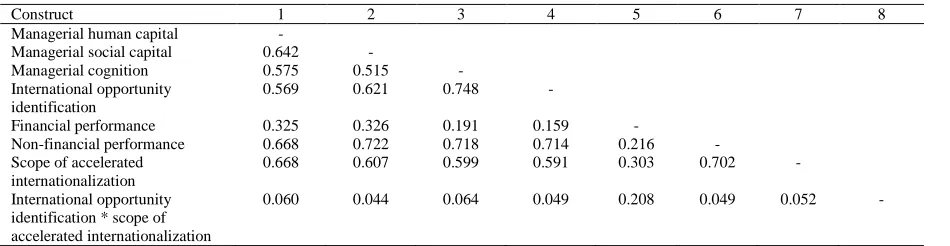
Table 4
HTMT correlation ratio
Construct 1 2 3 4 5 6 7 8
Managerial human capital -
Managerial social capital 0.642 -
Managerial cognition 0.575 0.515 - International opportunity
identification
0.569 0.621 0.748 -
Financial performance 0.325 0.326 0.191 0.159 -
Non-financial performance 0.668 0.722 0.718 0.714 0.216 - Scope of accelerated
internationalization
0.668 0.607 0.599 0.591 0.303 0.702 -
International opportunity identification * scope of accelerated internationalization
Table 5
Model fit statistics
Model
X
2df
X
2/df
(RMSEA)
RMSEA
(90% C.I.)
GFI
CFI
NFI
RFI
IFI
TLI
SRMR
PCLOSE
Measurement
Model
1446.453
795
1.819
0.046
0.042 –
0.050
0.854
0.947
0.819
0.882
0.948
0.943
0.0386
0.965
Structural
Model
1719.848
981
1.753
0.044
0.041 –
0.047
Table 6
Results of hypothesized relationships in SEM model
Hypotheses Std. Estimates Critical ratio p Value Conclusions
H1 0.062 n.s 1.084 0.255 Not supported
H2 0.317*** 5.953 0.000 Supported
H3 0.535*** 9.566 0.000 Supported
H4a -0.012n.s. -0.80 0.201 Not supported
H4b -0.060** -1.93 0.022 Not supported
H4c -0.101** -2.06 0.025 Not supported
H5a 0.013n.s. 0.92 0.243 Not supported
H5b 0.065** 2.954 0.002 Supported
H5c 0.110** 2.823 0.002 Supported
H6 -0.024n.s. -0.771 0.472 Not Supported
H7 0.106** 2.569 0.020 Supported
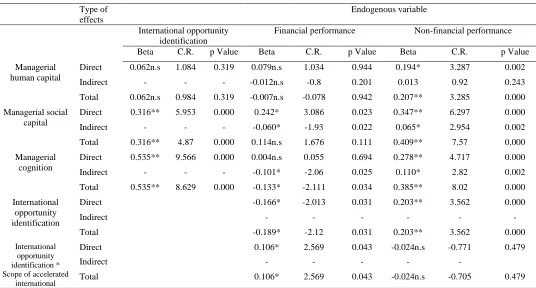
Table 7 Standardized direct, indirect, and total effects of exogenous variable in SEM model
Type of
effects
Endogenous variable
International opportunity
identification
Financial performance
Non-financial performance
Beta
C.R.
p Value
Beta
C.R.
p Value
Beta
C.R.
p Value
Managerial
human capital
Direct
0.062n.s
1.084
0.319
0.079n.s
1.034
0.944
0.194*
3.287
0.002
Indirect
-
-
-
-0.012n.s
-0.8
0.201
0.013
0.92
0.243
Total
0.062n.s
0.984
0.319
-0.007n.s
-0.078
0.942
0.207**
3.285
0.000
Managerial social
capital
Direct
0.316**
5.953
0.000
0.242*
3.086
0.023
0.347**
6.297
0.000
Indirect
-
-
-
-0.060*
-1.93
0.022
0.065*
2.954
0.002
Total
0.316**
4.87
0.000
0.114n.s
1.676
0.111
0.409**
7.57
0.000
Managerial
cognition
Direct
0.535**
9.566
0.000
0.004n.s
0.055
0.694
0.278**
4.717
0.000
Indirect
-
-
-
-0.101*
-2.06
0.025
0.110*
2.82
0.002
Total
0.535**
8.629
0.000
-0.133*
-2.111
0.034
0.385**
8.02
0.000
International
opportunity
identification
Direct
-0.166*
-2.013
0.031
0.203**
3.562
0.000
Indirect
-
-
-
-
-
-
Total
-0.189*
-2.12
0.031
0.203**
3.562
0.000
International opportunity identification * Scope of accelerated
international
Direct
0.106*
2.569
0.043
-0.024n.s
-0.771
0.479
Indirect
-
-
-
-
-
Total
0.106*
2.569
0.043
-0.024n.s
-0.705
0.479
![catena Poly[[copper(I) μ 2,6 bis[4 (pyridin 2 yl)thiazol 2 yl]pyridine] hexafluoridophosphate acetonitrile monosolvate] from single crystal synchrotron data](data:image/gif;base64,R0lGODlhAQABAIAAAP///wAAACH5BAEAAAAALAAAAAABAAEAAAICRAEAOw==)