Applications of dynamical systems theory and 'complex'
analyses to cricket fast bowling.
GLAZIER, Paul S.
Available from Sheffield Hallam University Research Archive (SHURA) at:
http://shura.shu.ac.uk/20686/
This document is the author deposited version. You are advised to consult the
publisher's version if you wish to cite from it.
Published version
GLAZIER, Paul S. (2011). Applications of dynamical systems theory and 'complex'
analyses to cricket fast bowling. Doctoral, Sheffield Hallam University (United
Kingdom)..
Copyright and re-use policy
See
http://shura.shu.ac.uk/information.html
Sheffield Hallam University Research Archive
! Lsr,
cino i i oum ues
| Cdlrriats Learning Centre
I Coilsni: b Crescent Campus
Sheffield S102BP
1 0 2 0 7 0 94 4 8
<
ProQuest Number: 10702781
All rights reserved
INFORMATION TO ALL USERS
The quality of this reproduction is dependent upon the quality of the copy submitted.
In the unlikely event that the author did not send a com plete manuscript and there are missing pages, these will be noted. Also, if material had to be removed,
a note will indicate the deletion.
uest
ProQuest 10702781
Published by ProQuest LLC(2017). Copyright of the Dissertation is held by the Author.
All rights reserved.
This work is protected against unauthorized copying under Title 17, United States C ode Microform Edition © ProQuest LLC.
ProQuest LLC.
789 East Eisenhower Parkway P.O. Box 1346
Applications of Dynamical Systems Theory
and ‘Complex’ Analyses to Cricket
Fast Bowling
Paul S Glazier
A thesis submitted in partial fulfilment of the requirements of
Sheffield Hallam University
for the degree of Doctor of Philosophy
Fast bowling - a highly dynamic and coordinated motor skill.
ABSTRACT
The aims of this thesis were to: (i) increase understanding of the biomechanical and motor control processes that underpin proficient fast bowling performance using dynamical systems theory and ‘complex’ analyses; and (ii) demonstrate the application of dynamical systems theory and the utility of ‘complex’ analyses to performance- oriented sports biomechanics research using cricket fast bowling as a representative task vehicle.
Prior to analysing within- and between-bowler differences in coordination patterns at different levels of analysis and their relationship to ball release speed, the suitability of manual coordinate digitising for analysing intra- and inter-individual variability was examined. Both the reliability of time-discrete and time-continuous kinematic variables was considered. Of the 33 time-discrete kinematic variables
examined, 31 exhibited between-participant variances and re-digitisation variances that accounted for the largest and smallest portions of total variance, respectively.
Furthermore, re-digitisation variance accounted for less than 5% of total variance in 29 of these variables with 15 of these exhibiting less than 1%. For the 45 time-continuous kinematic variables, measurement error accounted for 17.2% of movement variability (range 4.3-41.0%). When considered together, these results indicated that manual coordinate digitising was sufficiently sensitive to reliably measure differences in technique within and between bowlers.
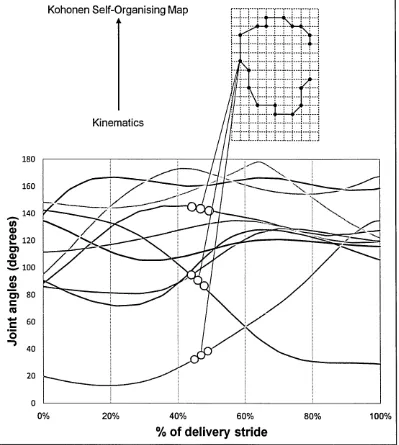
Kohonen Self-Organising Maps (SOMs) were used to analyse coordination patterns in cricket fast bowling at a global whole-body level of analysis. Qualitative differences in SOM trajectories between bowlers signified participant-specific
coordination patterns, which were attributed to differences in organismic constraints and intrinsic dynamics. A theoretical argument against the common optimal movement pattern concept was constructed and the utility of SOMs was evaluated. Several issues currently limiting their practical application, including the difficulty in linking the SOM trajectory to aspects of technique and the inability of biomechanists to identify optimal sports techniques, were highlighted.
A combination of ‘complex’ analytical techniques was then applied to quantify intersegmental coordination among key limb and torso segments. Cross-correlation functions showed that moderate (0.5+) to very strong (0.9+) coupling relationships existed for the four segment couplings (NBA vs. FL, BA vs. NBA, BA vs. FL, UT vs. P) with the majority of these moving in synchrony. Statistically significant mean
differences in both cross-correlation coefficients and average coupling angle for the four segment couplings throughout (0-100%), and during different phases (0-24%, 25-49%, 50-74%, 75-99%) of, the delivery stride provided further evidence of participant-
specific coordination patterns. However, no associations between coupling relationships and ball release speed could be identified either within or between bowlers. This study further highlighted the difficulties in making associations between technique and outcomes.
It was concluded that, based on the reported research findings, dynamical systems theory and its associated ‘complex’ analyses could make a substantive contribution to the enhancement of knowledge of cricket fast bowling techniques and also advance applied sports biomechanics research more generally. Further
LIST OF PUBLICATIONS
Parts of this thesis have been reproduced in the following publications:
Glazier, P.S., Davids, K. & Bartlett, R.M. (2003). Dynamical systems theory: a relevant framework for performance-oriented sports biomechanics research.
Sportscience, 7 (http://www.sportsci.org).
Glazier, P.S., Wheat, J.S., Pease, D.L. & Bartlett, R.M. (2006). The interface of biomechanics and motor control: Dynamic systems theory and the functional role of
movement variability. In Movement System Variability (edited by K. Davids, S.J.
Bennett & K.M. Newell), pp. 49-69. Champaign, IL: Human Kinetics.
Glazier, P.S. & Davids, K. (2009). Constraints on the complete optimization of
human motion. Sports Medicine, 39, 15-28.
Glazier, P.S. & Davids, K. (2009). The problem of measurement indeterminacy in
complex neurobiological movement systems. Journal of Biomechanics, 42, 2694-2696.
Davids, K. & Glazier, P.S. (2010). Deconstructing neurobiological coordination:
The role of the biomechanics-motor control nexus. Exercise and Sport Sciences
Reviews, 38, 86-90.
Glazier, P.S. (2010). Game, set and match? Substantive issues and future directions
in performance analysis. Sports Medicine, 40, 625-634.
Glazier, P.S. (2010). Is the ‘crunch factor’ an important consideration in the
aetiology of lumbar spine pathology in cricket fast bowlers? Sports Medicine, 40, 809-
815.
Glazier, P.S. (2011). Movement variability in the golf swing: Theoretical,
methodological, and practical issues. Research Quarterly for Exercise and Sport, 82,
ACKNOWLEDGMENTS
This thesis is a product of a ‘search and refinement’ process over an extended timescale. I would like to thank the following people who have helped me along the way:
Dr. Jon Wheat for his input and advice on empirical issues and his assistance with MATLAB programming and operation.
Prof. Steve Haake for facilitating a seamless transfer of registration to Sheffield Hallam University and for the financing of my student and publication fees.
Prof. Keith Davids for his input on theoretical issues and assistance with publication writing early on in the process.
TABLE OF CONTENTS
ABSTRACT i
LIST OF PUBLICATIONS ii
ACKNOW LEDGEMENTS iii
TABLE OF CONTENTS iv
LIST OF FIGURES viii
LIST OF TABLES X
CHAPTER I - INTRODUCTION
1.0 Historical Background 1
1.1 Focus of this Thesis 1
1.2 Research Question 3
1.3 Aims and Objectives 3
1.4 Structure of this Thesis 4
CHAPTER II - REVIEW OF THE LITERATURE: BIOMECHANICS OF FAST BOWLING PERFORM ANCE
2.0 Introduction 7
2.1 Biomechanical Factors Associated with Ball Release Speed 8
2.2 Biomechanical Factors Associated with Bowling Accuracy 19
2.3 Summary of Key Research Findings 21
2.4 Limitations of Existing Studies and Opportunities for Further Research 23
CHAPTER III - THEORETICAL DEVELOPM ENT OF THE BIOMECHANICS-MOTOR CONTROL NEXUS
3.0 Introduction 24
3.1 Movement Systems as Dynamical Systems 24
3.2 Implications of Dynamical Systems Theory for Sports Biomechanics 29
3.2.1 Hypothesis Generation 29
3.2.2 Research Design 30
3.2.3 Experimentation 32
3.2.4 Inverse Dynamics Analyses 35
3.2.5 Forward Dynamics Analyses 36
3.2.7 Interpretations of Movement Variability 3.3 Summary
42
45
CHAPTER IV - METHODS
4.0 Introduction 47
4.1 Participants 47
4.2 Experimental Protocol 47
4.3 Data Collection 48
4.4 Data Reconstruction 50
4.5 Data Processing 53
CHAPTER V - THE SUITABILITY OF MANUAL COORDINATE DIGITISING FOR ANALYSING INTER- AND INTRA-INDIVIDUAL MOVEMENT VARIABILITY
5.0 Introduction 55
5.1 Method 57
5.1.1 Data Analysis - Time-Discrete Data 57
5.1.2 Data Analysis - Time-Continuous Data 59
5.2 Results 59
5.2.1 Reliability of Time-Discrete Data 59
5.2.2 Reliability of Time-Continuous Data 62
5.3 Discussion 62
5.4 Conclusion 66
CHAPTER VI - ANALYSING CRICKET FAST BOWLING TECHNIQUES USING KOHONEN SELF-ORGANISING MAPS
6.0 Introduction 67
6.1 Method 69
6.1.1 Data Analysis 69
6.2 Results 70
6.3 Discussion 72
6.3.1 Magnitude and Origin of Individual Differences 72
6.3.2 Utility and Practical Application of SOMs 73
6.4 Conclusion 75
CHAPTER VII - RELATIONSHIPS BETWEEN INTERSEGMENTAL COORDINATION AND BALL RELEASE SPEED: A MULTIPLE SINGLE-PARTICIPANT ANALYSIS
7.0 Introduction 76
7.1 Method 77
7.1.1 Data Analysis 77
7.1.2 Statistical Analysis 81
7.2 Results 84
7.2.1 Ball Release Speed 84
7.2.2 Cross-Correlation Analysis 86
7.2.3 Vector Coding Analysis 90
7.3 Discussion 110
7.3.1 Cross-Correlation Analysis 110
7.3.2 Vector Coding Analysis 112
7.4 Conclusion 115
CHAPTER VIII - GENERAL DISCUSSION AND RECOMMENDATIONS FOR FUTURE RESEARCH
8.0 Introduction 116
8.1 Summary of Research 116
8.2 Implications for Coaching Cricket Fast Bowling and Other Sports
Techniques 1 1 9
8.3 Concluding Remarks and Recommendations for Future Research 120
CHAPTER IX - REFERENCES 122
APPENDIX A - INFORMED CONSENT PROFORMA
APPENDIX B - USER-DEFINED SPATIAL MODEL OF THE HUMAN PERFORMER
APPENDIX C - ROOT-MEAN-SQUARE (RMS) CALIBRATION AND RECONSTRUCTION ERROR ESTIMATES
APPENDIX D - TIME-DISCRETE PERFORMANCE PARAMETER DEFINITIONS
APPENDIX E - TIME-DISCRETE PERFORMANCE PARAMETER DATA SETS
APPENDIX G - KOHONEN SELF-ORGANISING MAP MATLAB CODE APPENDIX H - CROSS-CORRELATION DATA SETS
LIST OF FIGURES
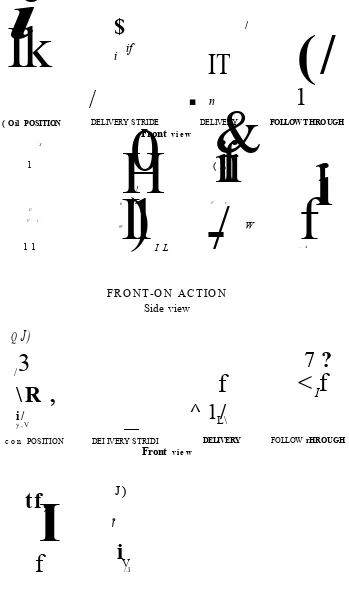
Figure 2.1. Side-on (top) and front-on (bottom) bowling actions (adapted from ECB Fast Bowling Directives 2000). Both techniques are deemed to be safe as there is no or minimal shoulder axis counter-rotation between back foot impact and front foot impact.
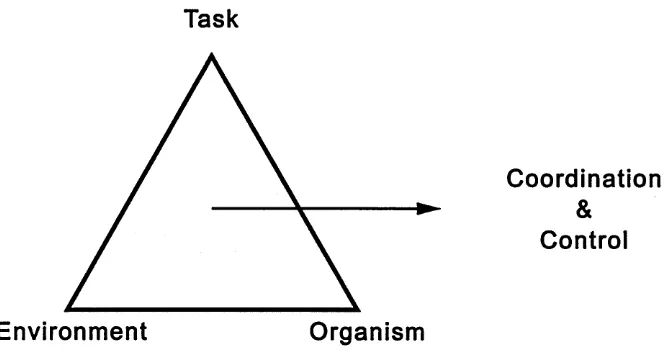
Figure 3.1. Newell’s theoretical model of interacting constraints (reproduced from Newell, 1986).
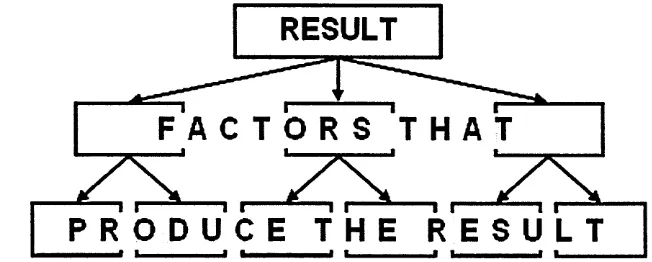
Figure 3.2. Basic format, structure and composition of a deterministic model (reproduced from Hay & Reid, 1988).
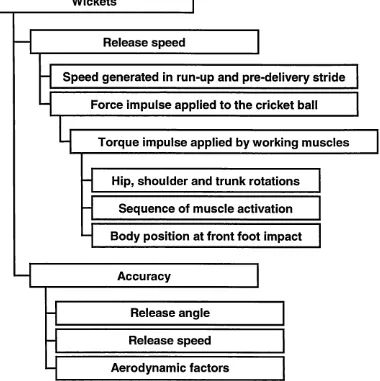
Figure 3.3. A simple deterministic or hierarchical model for cricket fast
bowling. Although this model does not strictly conform to the criteria set out by Hay and Reid (1988) for constructing these performance models, it does
provide an indication of the mechanical factors that are likely to be related to performance.
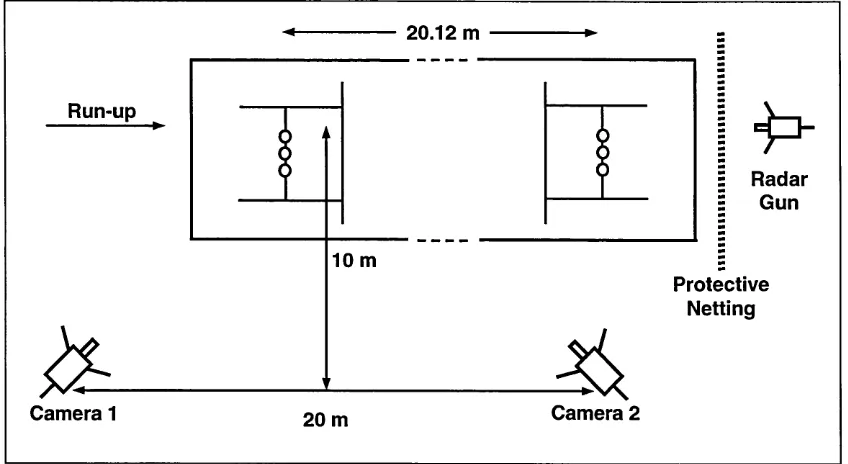
Figure 4.1. A plan view of the data collection setup (not to scale).
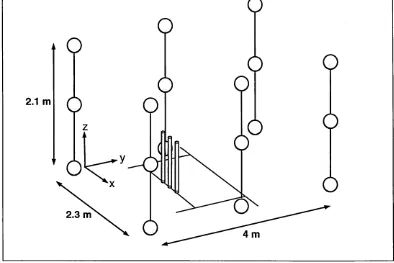
Figure 4.2. A three-dimensional view of the calibration volume (not to scale). Figure 5.1. Percentage contribution of between-participant variance (* e b2),
9 9
within-participant variance ( i e w~) and variance from the re-digitisations (Ber ) to total variance for 33 time-discrete performance parameters.
Figure 5.2. Intra-individual movement variability (■ ) versus measurement error (■ ) for 45 time-continuous variables (x, y and z for 15 anatomical landmarks).
Figure 6.1. A schematic showing the compression of high-dimensional input kinematics (joint angles) acquired from a cricket fast bowler between back foot impact (0%) and ball release (100%) on to a low-dimensional grid of neurons, known as a Kohonen Self-Organising Map (SOM). Owing to its non-linear properties, the abstract 2D SOM has removed redundancies in, but retained the essential topological characteristics of, the original 3D data set. The SOM displayed in this diagram is a simplified version for illustrative purposes. Figure 6.2. U-matrices for participants 1 to 8.
Figure 7.1. Segment angular displacement definitions for: (a) upper torso and pelvis (centred mid-segment); (b) non-bowling arm and front leg (centred on proximal end of each segment); and (c) bowling arm (centred on proximal end of the segment).
Figure 7.2. Vector coding applied to an exemplar relative motion diagram or angle-angle plot for the UT vs. P coupling. The magnified view (a) indicates how the coupling angle (y) was calculated at every percentage point from BFI (0%) to BR (100%). The coupling angle compass (b) shows how y was
interpreted with the hashed arrows indicating equal movement in both segments and the solid arrows indicating movement in one segment only.
11
26
33
34 49 50
63
64
68
71
78
Figure 7.3. Histograms (mean ± SD) of the types of coordination exhibited over the 12 performance trials for the NBA vs. FL coupling during the four phases (0-24%, 25-49%, 50-74% and 75-99%) of the delivery stride for participant 1 (top left) to 8 (bottom right).
Figure 7.4. Histograms (mean ± SD) of the types of coordination exhibited over the 12 performance trials for the BA vs. NBA coupling during the four phases (0-24%, 25-49%, 50-74% and 75-99%) of the delivery stride for participant 1 (top left) to 8 (bottom right).
Figure 7.5. Histograms (mean ± SD) of the types of coordination exhibited over the 12 performance trials for the BA vs. FL coupling during the four phases (0-24%, 25-49%, 50-74% and 75-99%) of the delivery stride for participant 1 (top left) to 8 (bottom right).
Figure 7.6. Histograms (mean ± SD) of the types of coordination exhibited over the 12 performance trials for the UT vs. P coupling during the four phases (0-24%, 25-49%, 50-74% and 75-99%) of the delivery stride for participant 1 (top left) to 8 (bottom right).
Figure 7.7. Histogram of statistically significant pairwise differences in cross correlation coefficients per participant for the four segment couplings (NBA vs. FL, BA vs. NBA, BA vs. FL and UT vs. P).
Figure 7.8. Histogram of statistically significant pairwise differences in coupling per participant for the NBA vs. FL coupling.
Figure 7.9. Histogram of statistically significant pairwise differences in coupling per participant for the BA vs. NBA coupling.
Figure 7.10. Histogram of statistically significant pairwise differences in coupling per participant for the BA vs. FL coupling.
LIST OF TABLES
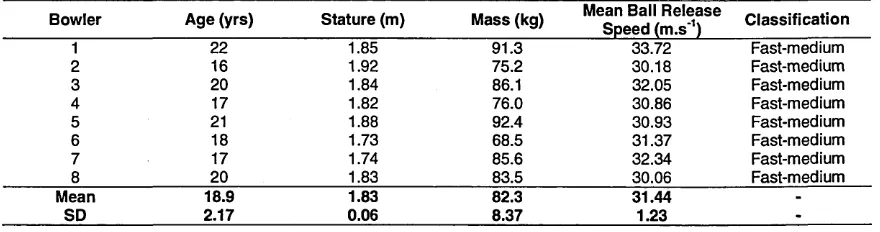
Table 4.1. Characteristics of the study sample.
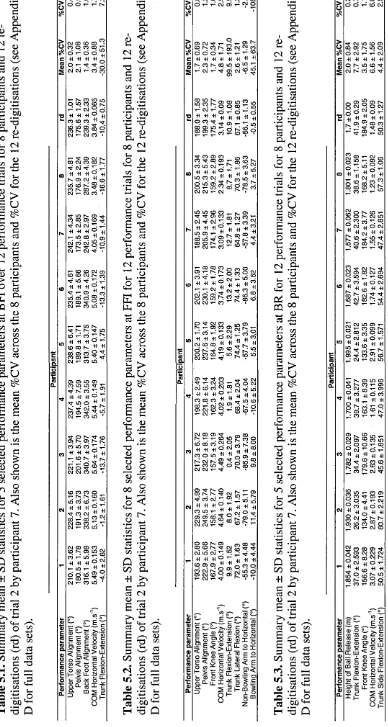
Table 5.1. Summary mean ± SD statistics for 5 selected performance parameters at BFI over 12 performance trials for 8 participants and 12 re digitisations (rd) of trial 2 by participant 7. Also shown is the mean %CV across the 8 participants and %CV for the 12 re-digitisations (see Appendix D for full data sets).
Table 5.2. Summary mean ± SD statistics for 8 selected performance parameters at FFF for 12 performance trials for 8 participants and 12 re digitisations (rd) of trial 2 by participant 7. Also shown is the mean %CV across the 8 participants and %CV for the 12 re-digitisations (see Appendix D for full data sets).
Table 5.3. Summary mean ± SD statistics for 5 selected performance parameters at BR for 12 performance trials for 8 participants and 12 re digitisations (rd) of trial 2 by participant 7. Also shown is the mean %CV across the 8 participants and %CV for the 12 re-digitisations (see Appendix D for full data sets).
Table 5.4. Summary mean ± SD statistics for 15 selected performance
parameters at (from BFF to BR) for 12 performance trials for 8 participants and 12 re-digitisations (rd) of trial 2 by participant 7. Also shown is the mean %CV across the 8 participants and %CV for the 12 re-digitisations (see Appendix D for full data sets).
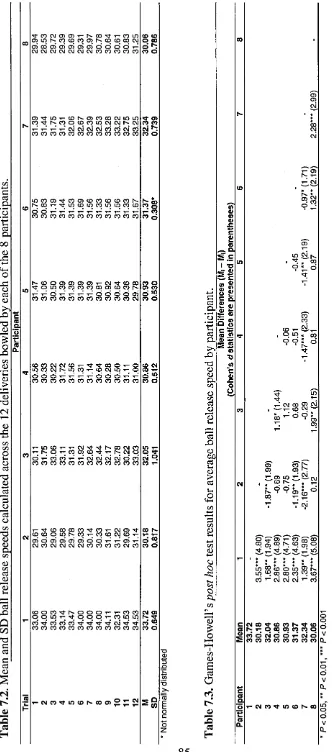
Table 7.1. Types of coordination and their coupling angle (y) boundaries. Table 7.2. Mean and SD ball release speeds calculated across the 12 deliveries bowled by each of the 8 participants.
Table 7.3. Games-HowelFs post hoc test results for average ball release speed
by participant.
Table 7.4. Mean (SD) phase-lagged cross-correlation coefficients calculated over the 12 performance trials performed by each of the 8 participants. Table 7.5. Mean (SD) phase-lagged Z-transformed cross-correlation
coefficients calculated over the 12 performance trials performed by each of the 8 participants.
Table 7.6. Games-Howell’s post hoc test results for mean phase-lagged Z-
transformed cross-correlation coefficients (NBA vs. FL coupling) by participant.
Table 7.7. Games-Howell’s post hoc test results for mean phase-lagged Z-
transformed cross-correlation coefficients (BA vs. NBA coupling) by participant.
Table 7.8. Tukey’s post hoc test results for mean phase-lagged Z-transformed
cross-correlation coefficients (BA vs. FL coupling) by participant.
47
60
60
60
61 81
85
85
86
86
88
88
Table 7.9. Tukey’s post hoc test results for mean phase-lagged Z-transformed cross-correlation coefficients (UT vs. P coupling) by participant.
Table 7.10. Pearson product-moment correlation coefficients for: (i) peak phase-lagged Z-transformed cross-correlation coefficients and ball release speed for each participant; (ii) the average peak phase-lagged Z-transformed cross-correlation coefficient calculated across the 12 deliveries for each participant and average ball release speed; and (iii) peak phase-lagged Z- transformed cross-correlation coefficient for the best performing trial and corresponding ball release speed for each participant.
Table 7.11. Average mean (SD) coupling angle calculated during the 4 phases (0-24%, 25-49%, 50-74% and 75-99%) of the delivery stride over 12
performance trials for the NBA vs. FL coupling.
Table 7.12. Games-HowelPs post hoc test results for average mean coupling
angle for the NBA vs. FL coupling (0-24%) by participant.
Table 7.13. Games-HoweH’s post hoc test results for average mean coupling
angle for the NBA vs. FL coupling (24-49%) by participant.
Table 7.14. Games-Howell’s post hoc test results for average mean coupling
angle for the NBA vs. FL coupling (50-74%) by participant.
Table 7.15. Games-Howell’s post hoc test results for average mean coupling
angle for the NBA vs. FL coupling (75-99%) by participant.
Table 7.16. Pearson product-moment correlation coefficients for: (i) mean coupling angle for the NBA vs. FL coupling and ball release speed for each participant; (ii) the average mean coupling angle for the NBA vs. FL coupling calculated across the 12 deliveries for each participant and average ball release speed; and (iii) mean coupling angle for the NBA vs. FL coupling for the best performing trial and corresponding ball release speed for each participant. Table 7.17. Average mean (SD) coupling angle calculated during the 4 phases (0-24%, 25-49%, 50-74% and 75-99%) of the delivery stride over 12
performance trials for the BA vs. NBA coupling.
Table 7.18. Games-Howell’s post hoc test results for average mean coupling
angle for the BA vs. NBA coupling (0-24%) by participant.
Table 7.19. Tukey’s post hoc test results for average mean coupling angle for
the BA vs. NBA coupling (25-49%) by participant.
Table 7.20. Tukey’s post hoc test results for average mean coupling angle for
the BA vs. NBA coupling (50-74%) by participant.
Table 7.21. Games-HowelTs post hoc test results for average mean coupling
angle for the BA vs. NBA coupling (75-99%) by participant.
Table 7.22. Pearson product-moment correlation coefficients for: (i) mean coupling angle for the BA vs. NBA coupling and ball release speed for each participant; (ii) the average mean coupling angle for the BA vs. NBA coupling
89
89
90
92
92
92
93
93
95
97
97
97
98
calculated across the 12 deliveries for each participant and average ball release speed; and (iii) mean coupling angle for the BA vs. NBA coupling for the best
performing trial and corresponding ball release speed for each participant. 98
Table 7.23. Average mean (SD) coupling angle calculated during the 4 phases (0-24%, 25-49%, 50-74% and 75-99%) of the delivery stride over 12
performance trials for the BA vs. FL coupling. 100
Table 7.24. Tukey’s post hoc test results for average mean coupling angle for
the BA vs. FL coupling (0-24%) by participant. 102
Table 7.25. Tukey’s post hoc test results for average mean coupling angle for
the BA vs. FL coupling (25-49%) by participant. 102
Table 7.26. Games-Howell’s post hoc test results for average mean coupling
angle for the BA vs. FL coupling (50-74%) by participant. 1 0 2
Table 7.27. Games-Howell’s post hoc test results for average mean coupling
angle for the BA vs. FL coupling (75-99%) by participant. 103
Table 7.28. Pearson product-moment correlation coefficients for: (i) mean coupling angle for the BA vs. FL coupling and ball release speed for each participant; (ii) the average mean coupling angle for the BA vs. FL coupling calculated across the 12 deliveries for each participant and average ball release speed; and (iii) mean coupling angle for the BA vs. FL coupling for the best
performing trial and corresponding ball release speed for each participant. 103
Table 7.29. Average mean (SD) coupling angle calculated during the 4 phases (0-24%, 25-49%, 50-74% and 75-99%) of the delivery stride over 12
performance trials for the UT vs. P coupling. 105
Table 7.30. Tukey’s post hoc test results for average mean coupling angle for
the UT vs. P coupling (0-24%) by participant. 107
Table 7.31. Games-Howell’s post hoc test results for average mean coupling
angle for the UT vs. P coupling (25-49%) by participant. 107
Table 7.32. Tukey’s post hoc test results for average mean coupling angle for
the UT vs. P coupling (50-74%) by participant. 107
Table 7.33. Games-Howell’s post hoc test results for average mean coupling
angle for the UT vs. P coupling (75-99%) by participant. 108
Table 7.34. Pearson product-moment correlation coefficients for: (i) mean coupling angle for the UT vs. P coupling and ball release speed for each participant; (ii) the average mean coupling angle for the UT vs. P coupling calculated across the 12 deliveries for each participant and average ball release speed; and (iii) mean coupling angle for the UT vs. P coupling for the best
1.0 Historical Background
Sport and exercise science is often considered to be a relatively new field of study. Indeed, higher education institutions around the world have only been offering
undergraduate degrees in this discipline since the 1960s. In reality, however, scholarly investigations into sport and exercise have been going on for at least the last 2,500 years. It could be argued that two of the first sport and exercise scientists were
Hippocrates (c. 460-370 b.c.) and Galen (c. a.d. 129-216). The former was interested in
the prophylactic and therapeutic benefits of exercise and was involved in the training of athletes who competed in the ancient Olympic Games, and the latter, who is regarded by some (e.g., Snook, 1978) as the father of the related field of sports medicine, was
appointed by Emperor Marcus Aurelius to provide surgical and medical support to the gladiators and assist with the planning of nutritional and training programmes (Porter,
1999).
Although the methods and technologies used in the delivery of sport science support to professional athletes are obviously far more advanced these days, the composition and structure of contemporary sport science support is, in many ways, similar to that provided during the Hellenic and Roman periods. Now, top athletes and professional sports teams in most developed countries around the world have access to state-funded elite sports academies and centres of excellence, and are supported by multidisciplinary teams of sport scientists who routinely implement strategically- designed support programmes to help boost performance and reduce injury risk. Cricket, in particular, has benefited greatly from this support structure and provision. One of the reasons touted for the success of the great Australian teams of the past two decades was the creation of the Australian Cricket Academy in 1987, which was developed through a joint initiative between the Australian Institute of Sport and the Australian Cricket Board. Similarly, the National Performance Centre in the UK, formerly the National Cricket Academy, has been identified as one of the reasons behind the current success of the England cricket team.
1.1 Focus of this Thesis
Weatherley, Hardcastle, Foster & Elliott, 1996), forcing them to endure more time away from the game than any other category of player (e.g., Orchard, James, Alcott, Carter & Farhart, 2002). The realisation of these factors has led to the formation of specialist fast bowling academies in various countries around the world (e.g., the MRF Pace
Foundation in Chennai) to promote and encourage the use of safe and effective fast bowling techniques among aspiring young fast bowlers. Most Test-playing nations now also employ the services of a full-time fast bowling coach to assist in refining the techniques and enhancing tactical awareness of fast bowlers who are being introduced to the international game at an increasingly younger age.
Despite the increased interest in fast bowling from a coaching perspective, scientific research into this important facet of the game has been much slower to develop. Since the pioneering investigations into the biomechanics of fast bowling techniques by researchers at the University of Western Australia approximately a quarter of a century ago (e.g., Elliott & Foster, 1984; Foster, John, Elliott, Ackland & Fitch, 1989; Elliott, Hardcastle, Burnett & Foster, 1992), progress has been limited to a relatively small, but steadily increasing, number of studies published in academic journals. Many of these investigations have attempted to build upon the research by
Elliott and colleagues and establish causative associations between bowling technique and lower back injuries (e.g., Burnett, Elliott, & Marshall, 1995; Burnett, Barrett, Marshall, Elliott & Day, 1998; Portus, Mason, Elliott, Pfitzner & Done, 2004). Indeed, recent research has indicated that a combination of contralateral side flexion and
ipsilateral axial rotation of the lumbar spine, not counter-rotation of the shoulder axis as previously thought, is likely to be instrumental in the development of abnormal
radiological features, such as spondylolysis, spondylolisthesis, pedicle sclerosis and intervertebral disc degeneration (e.g., Ranson, Burnett, King, Patel & O’Sullivan, 2008; Glazier, 2010b; Stuelcken, Ferdinands, & Sinclair, 2010).
There have been even fewer scientific studies focusing on the factors that contribute to proficient fast bowling performance. Although many of the investigations published in the literature have provided some useful insights into the biomechanical factors that contribute to a high ball release speed and bowling accuracy (e.g., Glazier, Paradisis & Cooper, 2000; Portus, Sinclair, Burke, Moore & Farhart, 2000; Loram, McKinon, Wormgoor, Rogers, Nowak & Harden, 2005; Salter, Sinclair & Portus, 2007; Wormgoor, Harden & McKinon, 2008), it could be argued that they have generally failed to make a substantive contribution to the enhancement of knowledge. In many
respects, these investigations have suffered from the same issues that have plagued performance-oriented sports biomechanics research, more generally, for the past three decades—that is, they have generally failed to move beyond the descriptive phase to a more analytical one, they have typically not made reference to motor control theory, the universal principles of biomechanics, or the fundamental laws of physics and biology that govern them, and they have tended to be product-driven rather than process-driven (e.g., Baumann, 1987; Norman, 1989; Zatsiorsky & Fortney, 1993; Bartlett, 1997). The recent emergence of dynamical systems theory in human movement science, however, appears to hold much promise, not only in resolving some of the issues inhibiting progress in research on fast bowling performance, but for applied sports biomechanics research more generally (see Glazier, Davids & Bartlett, 2003; Glazier, Wheat, Pease & Bartlett, 2006; Davids & Glazier, 2010). The focus of this thesis is, therefore, on the application of dynamical systems theory and its associated ‘complex’1 analyses to enhancing knowledge on fast bowling performance and its wider application to performance-oriented sports biomechanics research.
1.2 Research Question
Can dynamical systems theory and ‘complex’ analyses be used to help understand the biomechanical and motor control processes underpinning proficient fast bowling performance?
1.3 Aims and Objectives
This thesis has two aims:
(i) to enhance understanding of the biomechanical and motor control processes that
underpin proficient fast bowling performance using dynamical systems theory and ‘complex’ analyses;
(ii) to demonstrate the application of dynamical systems theory and the utility of
‘complex’ analyses to performance-oriented sports biomechanics research, more generally, using cricket fast bowling as a representative task vehicle.
To successfully meet these aims, the following objectives will be fulfilled:
(i) Provide a detailed theoretical analysis of how dynamical systems theory can be
applied to integrate the sub-disciplines of biomechanics and motor control, and enhance performance-oriented sport biomechanics research
(ii) Establish whether manual coordinate digitising can reliably measure differences
in time-discrete and time-continuous measurements both within and between bowlers.
(iii) Use Kohonen Self-Organisation Maps (SOMs) to measure differences in
coordination between bowlers at a whole-body, global level of analysis and establish whether a ‘common optimal movement pattern’ exists
(iv) Apply various ‘complex’ analyses (i.e., cross-correlation and vector coding) in a
multiple single-participant design to analyse intersegmental coordination of upper and lower extremity during delivery and establish any relationships with ball release speed.
1.4 Structure of this Thesis
The remainder of this thesis is comprised of the following chapters:
Chapter II critically reviews and summarises the main empirical studies published on fast bowling performance, specifically ball release speed. Key findings from these investigations, along with any inherent limitations, are highlighted. It is concluded that, for substantive progress to be made in understanding the processes of coordination and control underpinning proficient fast bowling performance, the
reductionist, nomothetic (inter-individual), product-oriented approach typically used in sports biomechanics research needs to be superseded by a holistic, idiographic (intra individual), process-oriented approach in conjunction with an appropriate theoretical framework. Dynamical systems theory is identified as being one such theoretical framework that appears to be particularly well-suited to this research endeavour.
Chapter HI provides a theoretical development of the biomechanics-motor control nexus. It begins with an overview of key concepts from dynamical systems theory, such as self-organisation and constraints, and how they relate to the formation of what Turvey (1990, p. 940) described as the “... most primitive independently
governable actuator of movements”—the coordinative structure or functional motor synergy. The ramifications for sports biomechanics of conceptualising the human
movement system as a complex, non-linear neurobiological system (dynamical systems perspective) rather than a deterministic, information-driven machine finitely controlled by a capacity-limited microcomputer acting as the brain (information processing perspective) are discussed, specifically the implications for: hypothesis generation
(Davids & Glazier, 2010); research design (Glazier et al., 2003); experimentation
(Glazier et al., 2006); inverse dynamics analyses (Glazier & Davids, 2009a); forward
dynamics analyses (Glazier & Davids, 2009b); the use o f ‘complex’ analyses (Glazier et
al., 2003; Wheat & Glazier, 2006); and interpretations of movement variability (Glazier
et al., 2006). To conclude, a case is made for not moving beyond the kinematic level of
analysis based on the theoretical arguments presented in this chapter.
Chapter IV provides a detailed account of the methods used to acquire and condition the kinematic data used in the empirical studies described in Chapters V, VI and VII. The characteristics of the study sample, and the experimental protocol, data collection, data reconstruction and data processing procedures adopted during, and subsequent to, this session are outlined in this chapter. These procedures are justified with recourse to existing technical notes and methodological papers published previously in the biomechanics literature.
Chapter V assesses the suitability of manual coordinate digitising for analysing intra- and inter-individual movement variability. Generally speaking, experimental errors and their consequences have not been well-evaluated in applied biomechanical research studies. Indeed, Bartlett, Stockill, Elliott and Burnett (1996) argued that future kinematic studies of fast bowling techniques need to evaluate experimental errors much more rigorously than in previous investigations. Recently, there has been some
conjecture in the literature about the suitability of manual coordinate digitising for analysing movement variability (see Bartlett, Bussey & Flyger, 2006). Given the need for sports biomechanists analysing cricket fast bowling techniques to be able to reliably measure differences within and between bowlers at specific instances during, and throughout the course of, the delivery stride, both the reliability of time-discrete and time-continuous kinematic measurements is considered.
in the topology2 of fast bowling techniques between bowlers are analysed and a theoretical argument against the ‘common optimal movement pattern’ or ‘idealised motor template’ concept (Brisson & Alain, 1996) is constructed. The origins of these topological differences are discussed and the utility and practical application of SOMs to performance-oriented sports biomechanics research, more generally, is considered.
Chapter VII examines the relationship between intersegmental coordination and ball release speed in cricket fast bowling. Whereas Chapter VI analysed coordination at a whole-body global level, this chapter considers coordination at a more local level using several different ‘complex’ analytical techniques (i.e., cross-correlation functions and vector coding) derived from dynamical systems theory. It has previously been suggested that coupling relationships between the bowling arm and the non-bowling arm, the non-bowling arm and the front leg, and the bowling arm and the front leg might be related to ball release speed (Davis & Blanksby, 1976b; Lillee, 1977; Pont, 2006), but as of yet, these associations have not been empirically-verified. A multiple single-participant research design was adopted to enable coordination strategies that were individual-specific and those that were generalisable to the group to be identified.
Chapter VIII summarises the main empirical findings to emerge from Chapters V, VI and VII and discusses the practical implications for fast bowling coaching and talent identification. The potential contribution of adopting a dynamical systems theoretical approach to performance-oriented sports biomechanics research and other related areas of sports science, such as the emerging sub-discipline of performance analysis (Glazier, 2010a), are also highlighted. To conclude, several recommendations for future research are made.
2 Bernstein (1967) used the term ‘topology’ to refer to the “... whole o f qualitative characteristics o f space configurations and of the form of movements in contrast to the quantitative, metric ones” (p. 42).
Chapter II
Review of the Literature:
2.0 Introduction
In Chapter I, it was noted that there has been a relative paucity of scientific
investigations into the factors that underpin proficient fast bowling performance (i.e.,
ball release speed and accuracy) (Bartlett et al, 1996; Bartlett, 2003). Much of the early
research on fast bowling performance was based on the observation and expert evaluation of cine film footage (e.g., Penrose, Foster & Blanksby, 1976; Davis & Blanksby, 1976a,b) and descriptive kinematic and force platform analyses (e.g., Elliott & Foster, 1984; Elliott, Foster & Gray, 1986; Mason, Weissenteiner & Spence, 1989) of successful fast bowlers. Latterly, surface electromyography was used to determine the sequential and temporal patterning of muscle activity in collegiate fast-medium bowlers (e.g., Burden & Bartlett, 1991). Subsequent empirical studies attempted to establish statistical associations among kinematic variables, anthropometric parameters, physical capacities and ball release speed (e.g., Burden & Bartlett, 1990a,b; Stockill & Bartlett,
1992a; Glazier et al, 2000; Portus et al, 2004; Loram et al, 2005; Salter et al, 2007). More recently, inverse dynamics analyses (e.g., Ferdinands, Marshall, Round &
Broughan, 2003; Ferdinands & Marshall, 2004) and forward dynamics simulations (e.g., Ferdinands, Broughan & Round, 2002) have been used to examine forces and torques that contribute to the generation of ball release speed.
There have been far fewer studies that have focused on bowling accuracy. Devlin, Fraser, Barras and Hawley (2001) reported that moderate exercise-induced hypohydration impaired bowling accuracy but not ball release speed in sub-elite standard fast-medium cricket bowlers. Taliep, Gray, St Clair Gibson, Calder, Lambert and Noakes (2003) found that there was no change in bowling accuracy over the course of a 12-over bowling spell but there was a decrease in ball release speed, particularly after the 6th over. Petersen, Wilson and Hopkins (2004) showed that training with overweight and underweight cricket balls over a 10-week period decreased bowling accuracy but only slightly increased ball release speed. Duffield, Carney and Karppinen (2009) indicated no decrease in ball release speed or bowling accuracy during two 6- over bowling spells interspersed by a 45-minute period of light physical activity. Phillips, Portus, Davids and Renshaw (2012) revealed that national and emerging fast bowlers were better able to bowl to different targets, with greater consistency, and at greater speeds than junior fast bowlers. None of these studies, however, analysed the movement dynamics responsible for producing these outcomes or how different task (e.g., different weighted balls) and organismic constraints (e.g., fatigue) might have
influenced those movement dynamics. To date, only one biomechanical study by Portus
et al (2000) has attempted to link bowling accuracy and technique but, as discussed
below, this investigation was not without limitation.
In the following sections, key empirical studies examining the biomechanical factors associated with a high ball release speed (section 2.1) and bowling accuracy (section 2.2) are reviewed and the key findings to emerge from these investigations are highlighted along with any deficiencies in the methods used.
2.1 Biomechanical Factors Associated with Ball Release Speed
In the first documented account of fast bowling to appear in a scientific journal, Penrose
et al (1976) used high-speed cinematography to calculate and compare ball release
speeds among international fast bowlers in the test match between Australia and the West Indies at the W.A.C.A. Ground, Perth on 12-16 December, 1975. It was reported that Jeff Thomson, Andy Roberts, Michael Holding, Dennis Lillee, Keith Boyce and Gary Gilmore released the ball at 44.3 m.s'1, 41.6 m.s'1, 41.0 m.s"1, 38.4 m.s"1, 37.9 m.s"1 and 37.0 m.s’1 respectively, and that the ball tended to decelerate 15.5 percent by the
time it reached the batsman at the opposite end of the pitch. Penrose et al (1976) also
noted marked differences in the run-up speeds and technique styles of the world-class express fast bowlers in the sample. Thomson’s approach run peaked at 5.0 m.s*1, which was considerably slower than Lillee, Roberts and Holding, who peaked at 9.3 m.s"1, 8.0 m.s'1 and 7.8 m.s'1, respectively. Thomson’s slower run-up speed enabled him to adopt a more side-on position at back foot impact with more backward body lean than the other three bowlers. Thomson then pivoted over a straight front leg, as did Holding, enabling them both to release the ball from a greater height than Lillee and, more noticeably, Roberts who tended to collapse their front knees during delivery. Given the apparent performance benefits afforded by Thomson’s javelin-style technique, Penrose
et al (1976) conjectured whether his idiosyncratic style might become ‘the’ fast
bowling action of the future or whether it would remain unique to him.
flexion and extension; (iii) from an upright position with a restraint on the legs and hips to prevent hip rotation and extension and leg action; (iv) from the same upright position but with an additional restraint on the chest to prevent all movement except for arm action; and (v), normally without restraint from a full run-up. A high-speed cine camera operating at 100 Hz was used to calculate ball release speeds for the different
conditions. Davis and Blanksby (1976a) calculated the run-up to contribute 19% to the release speed, leg action and hip rotation 23%, trunk flexion and shoulder girdle rotation 11%, arm action 42% and hand flexion 5%. These findings, however, need to be treated with caution since the joint immobilization or restraint paradigm adopted presupposes that the restriction of one or more joints will not alter the coordinated action of the unaffected body segments, which is, at best, a tenuous assumption (Miller, 1980).
In a follow-up study, Davis and Blanksby (1976b) compared the bowling techniques of the six fastest bowlers (fast group) with the six slowest bowlers (slow group) from the sample of 17 that featured in their previous study. They reported only a marginal difference between the two groups in the length and angle of the run-up with the fast group having a run-up some two metres longer than the slow group. Both groups decelerated sharply during the final stride of the run-up, thus facilitating a change of body orientation to a more side-on position during the pre-delivery stride. However, the fast group were found to be more side-on at back foot impact and the four fastest bowlers all looked over the lateral aspect of their front arm whereas the three slowest bowlers looked inside the medial aspect. During the delivery stride, the fast group tended to adduct their front more abruptly and further in towards their ribs than the slow group. In contrast, the slow group brought their front foot down faster than those in the fast group. The front leg in the fast group was found to be 15% straighter at the point of delivery than in the slow group and wrist flexion was far greater and
occurred closer to the instant of release in the fast group. There was no difference between groups for the range of trunk motion in the sagittal plane between back foot impact and ball release. However, the range of motion of the shoulder axis between back foot impact and ball release in the transverse plane was greater in the fast group. Finally, the alignment of the delivery stride was similar between groups with 67% of all bowlers directing their front foot towards the target.
Elliott and Foster (1984) provided the first full biomechanical analysis of the fast bowling action. The aim of this investigation was to compare the kinematics and kinetics of side-on and front-on fast bowling techniques (see Figure 2.1). The study
sample consisted of four Australian international fast bowlers: Jeff Thomson, Terry Alderman, Geoff Lawson and Ian Callen. Each bowler was required to bowl three maximum effort deliveries with their normal action, three maximum effort deliveries using a more side-on action and three maximum effort deliveries using a front-on action. Two high-speed cine cameras were situated laterally (200 Hz) and overhead (100 Hz) to film each delivery for subsequent digitisation and a force platform was situated at the location of front foot impact to collect ground reaction force data. A simple linear scaling procedure was used to generate two-dimensional displacement data for joint centres in the link segment system. These data were then smoothed and differentiated to obtain velocity and acceleration data. As Alderman was the only bowler capable of altering his bowling action, only the kinematics and kinetics of his side-on and front-on techniques and the normal techniques of the other bowlers were reported. This study showed that run-up speeds of bowlers using a side-on action were less than those using a front-on action (3.9 m.s'1 vs. 4.5 m.s'1). Interestingly, these data
are substantially lower than those reported by Penrose et al. (1976) for other
international fast bowlers indicating methodological problems in that study. Also, the peak vertical velocity of the elbow of the non-bowling arm in bowlers using a side-on action was greater than in those using a front-on action (-3.2 m.s'1 vs. -2.4 m.s'1). This study did not produce any evidence to suggest that the side-on action is superior to the front-on action in terms of having the potential to generate greater ball release speed. However, it was concluded that the side-on action might be a more effective method of generating a high ball release speed as side-on bowlers can run-up slower, make better use of their non-bowling arm, and can more precisely time hip and shoulder rotations, resulting in a more effective summation of body forces while minimising stress imposed on body segments and joints.
Elliott et al. (1986) used an identical experimental setup to collect kinematic and
kinetic data from 15 Western Australia first-grade or international fast-medium (30.6 ± 2.0 m.s'1) bowlers. This investigation showed that the bowlers analysed tended to adopt an open shoulder alignment at back foot impact (231.8 ± 17.6°), which the authors suggested might have restricted the maximum ball release speed because the effective ranges of hip and shoulder rotations are reduced with this type of bowling action.
Similar to Davis and Blanksby (1976a), Elliott et al. (1986) also attempted to quantify
the contributions of different body segments to ball release speed. However, instead of
i
Ik
( Oil POSITION
SID E-O N A CTIO N Side view
$
if i/
/
IT
■ n
DELIVERY STRIDE DELIVERY
Front v i e w
(/
1
FOLLOW THROUGH
X
1
0 &
( LU
H
!
h
ifi
V s i
l i
V iW
I1)
Wf
1 1 I L
-/
- AFRO N T-O N A CTIO N Side view
q
J)
3
/
\ R ,
i /
y , V
c o n POSITION
tf,
I
f
___
f
^
1
/
DEI I VERY STRIDI
L\ DELIVERY
J )
r
i
V/.I
Front v i e w
7
?
< f
I [image:31.612.94.443.49.640.2]FOLLOW rHROUGH
Figure 2.1. Side-on (top) and front-on (bottom) bowling actions (adapted from ECB Fast Bowling Directives 2000). Both techniques are deemed to be safe as there is no or minimal shoulder axis counter-rotation or realignment to a more side-on position between back foot impact and front foot impact.
simply calculated the difference between peak resultant velocities of adjacent joint centres in the link segment system and expressed this difference as a percentage of the ball release speed. They calculated that the run-up and hip action contributed 15% of ball release speed, shoulder action 13%, arm action 50%, and hand and finger action 22%. These results contrast markedly to those reported by Davis and Blanksby (1976b). For example, the run-up and hip action combined in that study contributed 42% of ball
release speed, 27% more than calculated by Elliott et al (1986). Furthermore, Davis and
Blanksby (1976a) calculated the total arm action contributed 47% of ball release speed,
whereas Elliott et al (1986) calculated it to contribute 72% of ball release speed. The
reason for these discrepancies in percentage contributions is unclear although it is likely to be an artefact of the method of calculation.
A further descriptive biomechanical study was undertaken by Mason et al.
(1989) to develop an ‘optimal’ model of the bowling technique (i.e., one that maximises ball release speed but minimises the likelihood of injury), which was to be used as a
basis for teaching young fast bowlers. Fifteen fast-medium bowlers (x = 32.4 m.s'1)
from the Australian Institute of Sport Cricket Academy were filmed from the front and side using two phase-locked high-speed (100 Hz) cine cameras. A force platform measured ground reaction forces at front foot impact, a series of light gates positioned four metres apart down the length of the bowler’s run-up was used to determine horizontal speed during different intervals of the run-up and a radar gun was used to measure ball release speed. The trial performed by each bowler yielding the highest release speed was selected for analysis. The results of this study indicated that 14 of the bowlers analysed adopted side-on actions and only one bowler adopted a front-on action. Although the exact classification criteria were not disclosed, this finding seemed
to contradict the previously reported results of Elliott et al (1986) indicating that fast
bowling techniques were increasingly becoming more front-on. The mean run-up speed during the 16-12 metre, 12-8 metre, 8-4 metre and 4-0 metre intervals before the
popping crease was 6.1 m.s'1, 6.1 m.s'1, 5.7 m.s'1 and 5.6 m.s'1, respectively, indicating
a slight decrease in speed as bowlers prepared to deliver the ball. Mason et a l (1989)
of the bowling action were reported with the authors relying almost exclusively on subjective evaluation of stick-figure animations as the basis for their analysis.
In the first of a series of papers to emerge from the National Cricket Association Sport Science Support Programme ‘Fast Bowling Project’, Burden and Bartlett (1990a) reported the results of a kinematic investigation of 17 international and county fast (> 36 m.s'1) and fast-medium (< 36 m.s'1) bowlers, including Patrick Patterson, Graham Dilley and Ian Botham. A high-speed cine camera, operating at 200 Hz and situated laterally on the boundary edge along the line of the popping crease, was used to record 6 deliveries from each bowler during 6 county championship matches of the 1989 season. The fastest delivery bowled by each of the bowlers was selected for two-dimensional kinematic analysis. This study reported a low correlation between run-up speed and ball
release speed (r = 0.21, P > 0.05), although, curiously, run-up speed appeared to be
measured at the point of ball release, not at back foot impact as is customary, which is likely to account for some of the unusually low run-up speeds reported. A moderate
correlation (r = 0.41, P > 0.05) was also shown to exist between front knee angle at ball
release and ball release speed, although those bowlers who flexed their front knee between front foot impact and ball release were shown to have a lower ball release speed. This study was notable because it was the first to attempt to establish formal associations between aspects of technique and ball release speed via the application of inferential statistical analyses. It was also the first scientific study on fast bowling to move beyond description and make explicit reference to key underpinning
biomechanical principles (i.e., the kinematic chain).
In a follow-up study, Burden and Bartlett (1990b) compared the kinematics of nine collegiate fast-medium bowlers with the kinematics of the seven elite fast bowlers who featured in their previous study. The results of this study indicated that the faster ball release speeds of elite fast bowlers compared with those of the collegiate fast- medium bowlers (37.0 ±1.0 m.s'1 vs. 28.2 ±1.1 m.s'1) could be attributed to the slightly higher run-up speeds of the former than the latter (5.5 ± 0.5 m.s'1 vs. 4.8 ± 0.7 m .s'1) and the progressively greater differences in peak linear speed of joint centres
comprising the kinematic chain (hip: 6.1 ± 0.5 m.s'1 vs. 5.4 ± 0.8 m.s'1; shoulder: 9.6 ± 0.6 m.s'1 vs. 8.1 ± 0.4 m.s'1; wrist: 24.5 ± 0.8 m.s'1 vs. 20.9 ±1.0 m.s'1; middle knuckle: 27.3 ± 0.8 m.s'1 vs. 23.4 ±1.2 m.s’1). The higher angular velocity of the bowling arm in the elite fast bowlers compared with those of the collegiate fast-medium bowlers (29.7 rad.s'1 vs. 26.6 rad.s"1) was suggested to be primarily responsible for the greater increase
in peak linear speed of the wrist joint compared to the shoulder joint in the elite group compared to the collegiate group. A rapid flexion of the fingers closer to the moment of ball release was also hypothesised to account for the greater increase in peak linear speed of the ball release speed compared to the middle knuckle in the elite group compared to the collegiate group. Perhaps the most distinct difference between the two groups was the action of the front knee. The elite fast bowlers hardly flexed their front leg during the phase between front foot impact and ball release, whereas the front knee of the collegiate fast-medium bowlers underwent a period of flexion and generally failed to extend again before ball release.
Building on the project’s earlier two-dimensional studies, Stockill and Bartlett (1992a) performed the first three-dimensional kinematic analysis of fast bowling techniques. The participants in this study were 17 first-class and international fast (> 35.8 m.s'1) and fast-medium (< 35.8 m.s'1) bowlers, including Curtly Ambrose, Allan Donald and Waqar Younis. Two high-speed cine cameras operating at 200 Hz situated laterally and behind the bowler were used to collect film footage of deliveries bowled during test matches, county championship fixtures and net sessions of the 1991 season. The footage was subsequently digitised and reconstructed using a direct linear
transformation algorithm to convert two-dimensional image-coordinates to three- dimensional object-space coordinates. Although the results of this study tended to focus on alignments of the back foot, hip axis and shoulder axis at key instances during delivery with less emphasis on the biomechanical factors related to ball release speed,
Stockill and Bartlett (1992a) reported a positive correlation (r = 0.55, P < 0.05) between
run-up speed and ball release speed. However, as the unusually high average run-up speed (6.8 ±1.7 m.s'1) might be attributable to extrapolation errors associated with reconstruction points lying beyond of the calibration volume, the authors advised caution when interpreting these results. In another write-up of this study that appeared in the ‘Cricket Coach’, the journal of the Association of Cricket Coaches, Stockill and Bartlett (1992b) noted the degree of front knee flexion at ball release was inversely related to ball release speed. Although no data were provided, it was reported that faster bowlers tended to have a more extended or, in some cases, hyperextended front knees at ball release.
Two phase-locked cine cameras operating at 100 Hz, and two gen-locked video cameras operating at 50 Hz, were used to capture movement sequences for 12 fast senior
international bowlers and 12 fast-medium junior international bowlers, respectively. The footage was subsequently digitised and reconstructed using a direct linear transformation algorithm to convert two-dimensional image-coordinates to three- dimensional object-space coordinates. The results of this study showed that the ball release speeds of senior international fast bowlers were greater than junior international fast bowlers (38.1 ±1.4 m.s'1 vs. 32.1 ±1.9 m.s'1) as were the peak linear speeds of the right hip, seventh cervical vertebra, right shoulder, right wrist and right middle knuckle. Furthermore, the timings of these peak linear speeds occurred closer to ball release for seniors than the juniors. However, when these timings were expressed as a percentage of delivery stride duration, these temporal differences disappeared. Stockill and Bartlett (1994) concluded that differences in ball release speed might be attributable to higher run-up speeds, slightly higher angular velocities for the trunk and bowling arm and greater upper limb lengths, as it was argued that the longer bowling arm lengths of the seniors will produce higher ball speeds for a given angular velocity.
To investigate the influence of kinematic and anthropometric variables on ball
release speed, Glazier et al (2000) performed a three-dimensional kinematic analysis on
nine collegiate fast-medium bowlers (31.5 ± 1.9 m.s'1). Two gen-locked video cameras operating at 50 Hz, situated in the same horizontal plane with their optical axes
orthogonal to one another, were used to film 6 deliveries bowled by each participant. The fastest delivery, as measured by a radar gun previously validated by Glazier, Paradisis and Cobner (1999), was digitised and subjected to kinematic analysis.
Anthropometric lengths, including shoulder-elbow, elbow-wrist and hand length, were also measured according to the guidelines described by Martin, Carter, Hendy and Malina (1988) and Ross and Marfell-Jones (1991). The results of this study showed a relationship between run-up speed during the pre-delivery stride and ball release speed
(r = 0.728, P = 0.026). This finding agrees with those of Stockill and Bartlett (1992a)
and can be explained by the majority of bowlers analysed used techniques that exhibited a front-on body position at back foot impact and, therefore, could transfer linear
velocity generated during the run-up to ball release more effectively (Elliott & Foster, 1984). Relationships were also found between shoulder-wrist length and ball release
speed (r = 0.626, P = 0.036) and total arm length and ball release speed (r = 0.583, P =
0.050), thus concurring with the suggestions of Stockill and Bartlett (1994). Using a
similar method to Elliott et al. (1986), the relative contribution of the run-up to ball
release speed was 16%, hip rotation 2%, trunk action 6%, arm action 62%, and hand
and finger action 14%. These results were broadly similar to Elliott et al (1986) but
somewhat different to Davis and Blanksby (1976a). Further evidence of proximal-to-
distal sequencing was provided by Glazier et al (2000). However, as only peak linear
speeds of joint centres in the upper body kinetic chain were reported, the interaction or coupling relationships among body segments could not be established.
Portus et al (2004) examined the bowling actions of 42 high performance male
fast bowlers at the Australian Institute of Sport between 1996 and 1999 to establish the biomechanical factors most related to ball release speed and lower trunk injury. Three- dimensional kinematic data were generated by manually coordinate digitising
movement sequences captured on film at 100 Hz in 1996 and on video at 50 Hz between 1997 and 1999. Two force platforms, operating at 1000 Hz and positioned at the location of back foot impact and front foot impact, were used to collect
simultaneous ground reaction force data during every data collection session throughout the 4-year period. The results of this study showed relationships between front knee extension during the phase between front foot impact and ball release and ball release
speed (r = 0.37, P = 0.02), peak braking force at front foot impact and ball release speed
(r = 0.43, P < 0.01), time to peak braking force at front foot impact and ball release
speed (r = -0.32, P < 0.05), and time to peak vertical force at front foot impact (r = -
0.65, P < 0.01) and ball release speed. These findings indicate that bowlers who had
higher braking forces, and developed their peak braking and vertical forces more rapidly at front foot impact, presumably through the use of a more extended front leg, recorded higher ball release speeds. Also, relationships were found between timing of the
maximum hip-shoulder separation angle and ball release speed (r = 0.34, P = 0.05) and
the range of shoulder axis rotation and ball release speed (r = 0.30, P = 0.05). Portus et
al (2004) argued that these findings suggested that an optimal sequence of hip and
shoulder rotations is likely to exist, which would utilise more effectively the elastic energy created in the torso musculature through the delaying of shoulder axis rotation, ultimately resulting in an increased ball release speed.
Hanley, Lloyd and Bissas (2005) conducted a further three-dimensional kinematic analysis of 13 fast bowlers of varying standard (3 international seniors, 6 first-class seniors and 4 county juniors) to establish relationships between kinematic variables and ball release speed. Of the 74 variables analysed, only 5 were shown to be
angular displacement (r = 0.642, P < 0.05) and shoulder angular displacement (r =
0.636, P < 0.05) exhibited medium to large correlations with ball release speed. Owing
to the large number of independent variables analysed, however, it would appear that the “shotgun” approach was adopted in this study. This approach, where the selection of independent variables is a largely arbitrary process (Lees, 1992), is typically not
recommended and should be abandoned in favour of other more rational approaches, such as hierarchical or deterministic modelling (Lees, 1999).
Loram et al. (2005) attempted to identify the anthropometric, strength and
kinematic parameters most related to ball release speed in a group of South African schoolboy fast-medium bowlers and then attempted to predict ball release speeds using those parameters as predictor variables in a multiple linear regression analysis. Each of the 12 bowlers studied were filmed performing 3 deliveries by a high-speed digital video camera operating at 250 Hz, which was situated perpendicular to the plane of performance. Anthropometric lengths and girths for torso and limb segments were measured by a trained anthropometrist and an isokinetic dynamometer set at an angular velocity of 1.05 rad.s'1 was used to measure peak concentric knee and shoulder torque and the angle at which these peak torques occurred. This study reported positive correlations between ball release speed and front knee angle at front foot impact (r =
0.72, P = 0.009) and ball release speed and front knee angle at ball release (r = 0.71, P =
0.011). In contrast to the suggestions of Stockill and Bartlett (1994) and the findings of
Glazier et al. (2000), no relationships were found between limb lengths and ball release
speed. Although no relationship existed between any of the shoulder and knee strength parameters and ball release speed, the angle of peak internal and external rotation torques of the shoulder were included in the multiple regression model, presumably because they were the only other independent variables not to exhibit colinearity, along with knee angle at front foot impact and ball release. The adjusted coefficient of
determination (R2) of 0.85 reported in the regression analysis indicated that 85% of the
variance in ball release speed could be accounted for by the predictor variables. However, caution must be applied when interpreting these results as the response variable to predictor variable ratio was only 3:1, which is considerably less than the ratio of 20:1 considered to be ideal by Vincent (2005). This oversight is likely to limit the generalizability of the regression equation beyond this study.
Salter et al. (2007) conducted a preliminary investigation into the efficacy of
different research designs when studying fast bowling performance. They compared the
results of single-participant and group-based analyses of the biomechanical factors most related to ball release speed. In the single-participant analysis, 20 deliveries bowled by a semi-open (defined as having a shoulder alignment of 210-240° at back foot contact) high-performance English academy fast bowler (37.5 ±1.0 m.s'1) in a competitive match were filmed by two synchronised high-speed video cameras operating at 250 Hz situated on the boundary edge. The movement sequences were subsequently digitised at
125 Hz and reconstructed using a direct linear transformation algorithm. In the group- based analysis, 20 semi-open high performance Australian academy fast bowlers (34.2 ±1.6 m.s'1) each bowled a single delivery, which was captured by an 8-camera Vicon system and reconstructed for subsequent analysis. A selection of kinematic performance parameters reported previously in the scientific and coaching literatures formed the basis of this analysis. The results of this study showed no relationships between any of the selected performance parameters and ball release speed in the group-based analysis, but relationships were found between 8 of the 11 performance parameters and ball release speed in the single-participant analysis. Four of these performance parameters (centre of mass velocity at back foot impact, maximum angular velocity of the bowling arm, vertical velocity of the non-bowling arm and stride length) were then entered into a multiple regression model to predict ball release speed. It was shown that 87.5% of the variation in ball release speed could be attributed to changes in these predictor variables. The stepwise introduction of independent variables into the multiple regression analysis also showed how previously high correlation coefficients between independent
variables and ball release speed can be misleading, especially if colinearity exists among the independent variables. This finding provides further evidence that the
“shotgun” approach adopted by Hanley et al. (2005) is ill-advised and that greater
diligence and sound rationale needs to be applied when selecting independent variables.
In the most recent biomechanical investigation of fast bowling performance,
Wormgoor et al. (2008) analysed 28 premier club fast-medium bowlers (34.0 ±1.3
m.s'1) from South Africa to identify the kinanthropometric, strength, and technique parameters most related to ball release speed. Each participant bowled six deliveries that were captured using six digital video camcorders operating at 50 Hz and the fastest delivery, as measured by a radar gun, was digitised and reconstructed using a three- dimensional direct linear transformation algorithm. In contrast to Stockill and Bartlett
(1994) and Glazier et al. (2000), but in agreement with Loram et al. (2005), no
strength and ball release speed (r = 0.392, P = 0.039) when the isokinetic dynamometer was set at an angular velocity of 1.05 rad.s'1, relative concentric shoulder intemal- rotation strength at a mid-range position of 20° external rotation and ball release speed
(r = 0.428, P = 0.023), and front knee angle at release and ball release speed (r = 0.517,
P = 0.013). These results indicate that greater shoulder strength and a straighter front
leg at ball release may result in higher ball release speeds, respectively. The change of knee angle during the phase between front foot impact and ball release exhibited a
negative correlation with ball release speed (r = -0.466, P = 0.013) as did shoulder
alignment in the transverse plane at front foot impact and ball release speed (r = -0.466,
P = 0.013). Wormgoor et al. (2008) reasoned that the adoption of a more side-on
shoulder alignment at front foot impact enabled bowlers to move their shoulder axis through a larger arc leading up to ball release, thereby increasing ball release speed. In fact, despite the well-documented injury problems caused by counter-rotation of the shoulder axis, this study encouraged the use of mixed bowling techniques where this parameter is the distinguishing feature.
2.2 Biomechanical Factors Associated with Bowling Accuracy
As noted earlier in section 2.0, there has been only one empirical study that has
attempted to link fast bowling technique and bowling accuracy. Portus et al. (2000)
examined the inter-relationships between selected physical capacities, technique, ball release speed and bowling accuracy of 14 first-grade or higher fast-medium bowlers (32.1 m.s'1). In this study, each bowler was required to complete an 8-over bowling spell under simulated match conditions, of which the sixth ball of overs two, five and eight was recorded by two video cameras, one mounted overhead and the other mounted laterally, for digitizing purposes. An APAS image-based motion analysis system (Ariel Dynamics Inc.) was then used to digitize each of the recorded trials to obtain kinematic data describing the alignment of the back foot at back foot impact, the alignment of the sho