strength.
TATNER, Ian.
Available from Sheffield Hallam University Research Archive (SHURA) at:
http://shura.shu.ac.uk/20424/
This document is the author deposited version. You are advised to consult the publisher's version if you wish to cite from it.
Published version
TATNER, Ian. (2004). The effect of notches and pits on corrosion fatigue strength. Doctoral, Sheffield Hallam University (United Kingdom)..
Copyright and re-use policy
See http://shura.shu.ac.uk/information.html
Fines are charged at 50p per hour
\ i
- S p
J 8 SEP 2007
S | O r —)
1 8 SEP 2007
z&hloi,
\ % - a )
\ ( o /
All rights reserved
INFORMATION TO ALL USERS
The qu ality of this repro d u ctio n is d e p e n d e n t upon the q u ality of the copy subm itted.
In the unlikely e v e n t that the a u th o r did not send a c o m p le te m anuscript and there are missing pages, these will be note d . Also, if m aterial had to be rem oved,
a n o te will in d ica te the deletion.
uest
ProQuest 10701070
Published by ProQuest LLC(2017). C op yrig ht of the Dissertation is held by the Author.
All rights reserved.
This work is protected against unauthorized copying under Title 17, United States C o d e M icroform Edition © ProQuest LLC.
ProQuest LLC.
789 East Eisenhower Parkway P.O. Box 1346
The Effect of Notches and Pits on
Corrosion Fatigue Strength
Ian Tatner
A thesis submitted in partial fulfilment of the requirements of
Sheffield Hallam University for the degree of Doctor of
Philosophy
Abstract
An investigation has been undertaken to examine the fatigue behaviour of two
martensitic steels in air and aggressive environments. The steels studied are, 18% Ni
marageing steel and FV520B, the later being a stainless steel turbine blade material
and the former being a marageing steel that suffers general corrosion in mild
environments. Both steels were heat treated to give similar tensile strength.
The design and manufacture of an autoclave allowed push-pull fatigue tests to be
conducted in aggressive environments at elevated temperatures.
Corrosion potential was monitored using a three electrode cell and was controlled
during testing. Base-line fatigue tests were conducted with a range of constant
corrosion potentials, using both notched and plain FV520B specimens. In addition
fatigue tests with pulsed corrosion potential were performed to asses the effect of
transient corrosion conditions on the corrosion fatigue strength. The pulsed tests were
designed to simulate service transients in the oxygen content and general chemical
hostility in the condensing steam environment during start-up and shut down of the
steam turbine.
Post test examination of fractured samples was performed using Scanning Electron
Microscopy (SEM) and optical microscope techniques. The fractography results were
used to quantify microstructural and fracture features o f the steels.
A model based on the size and geometry o f the initial corrosion pitting has been
proposed to asses the fatigue life o f FV520B in an aggressive environment.
The effect o f pitting on the corrosion fatigue strength o f FV520B has been modelled
using linear elastic fracture mechanics (LEFM) type approach. The model has shown
Sheffield Hallam University Ian Tatner
The results suggest that the fatigue life is governed by the mechanical stress
concentrating effect o f the pits rather than the electrochemical damage caused by the
environment.
Finite Element Analysis (FEA) of the notch allowed calculation o f the elastic stress
intensity factor (Kt) for the specimen geometry used. The experimental results
together with numerical results of FEA were used to calculate o f the notch strength
reduction factor (Kf) for the material. This has been used to derive the notch
sensitivity factors (q) for both materials.
The results of fatigue tests in air showed that although both materials have similar
tensile strength their plain fatigue strengths are different. The sensitivity o f the
fatigue strength to notches was also found to be significantly different. The
marageing steel showed a higher sensitivity to a notch than the FV520B.
An empirical model has been proposed to quantify the notch sensitivity and the
effects o f various microstructural features on the fatigue strength. A model has been
developed to predict the serviceable life of a peak hardened FV520B turbine blade
subjected to aggressive low load conditions during start-up and non-aggressive high
load conditions during continual running. The model is based on the conclusions
suggested in the work of a threshold stress intensity factor being reached where a
fatigue crack will grow from a corrosion pit at the root o f a notch. The model is then
used to highlight the life reduction caused to steam turbine blades due to increased
numbers o f start-up cycles.
Keywords
FV520B, Marageing, Corrosion Pitting, Corrosion Potential, High Temperature,
Statement of Postgraduate Study
During the period of research several lectures and seminars have been attended,
details are given below.
• Delivery of research seminars at Sheffield Hallam University
• Attendance at Fatigue 2000 “Fatigue & Durability Assessment o f Materials,
Components and Structures” The fourth international conference o f the
Engineering Integrity Society, April 2000, Cambridge.
• Presentation of poster entitled "The Effect of Potential on the Corrosion
Fatigue Strength of Turbine Blade Steels" at the Materials Congress 2002, 9-
11 April 2002, London, UK.
• Full training on Philips XL40 Scanning Electron Microscope (S.E.M) held
over six weeks at the Materials Research Institute Sheffield Hallam
University.
• Attendance at series of lectures and tutorials at Sheffield Hallam University
leading to MSc. units in Research Methods and Research Studies.
• Attendance and completion at a Research Councils’ Graduate School. A five
day residential course at the University o f Stirling that covered: Awareness of
personal transferable skills and attributes, skills and processes required for
Sheffield Hallam University Ian Tatner
Acknowledgments
I would like to thank Prof. Atkinson for his support and advice throughout this
project. I would also like to thank Dr R. Akid and Dr U. Fernando for their help and
advice at various stages of the work.
The continued encouragement of friends and family even though they're not sure
what it was I was doing made completion possible. I would like to acknowledge the
following people amongst others for making me happy and inspiring me, Nick, Alice,
Tanya, Lee, Stella, and James Lorbiecki.
I want to thank the technical staff in the School o f Engineering at Hallam University
for their help and work, in particular John Bradshaw for invaluable assistance, Brian
Palmer for his help with instrumentation, Roger, John and Brian for workshop
assistance, and Keith and Tim for helping with experimental work.
Contents
A bstract... I
Statement of Postgraduate Study... I ll
Acknowledgments... IV
Contents... V
Nomenclature... X
List of Figures... XII
List of Tables...
XXVI
1
Introduction... 1
2
Literature Review...4
2.1 Introduction ... 4
2.2 Turbine Blades... 4
2.2.1 Steam Turbines...4
2.2.2 Stresses Acting on LP Turbine Blades... 5
2.2.3 Environmental Conditions Near an LP Steam Turbine B lade... 6
2.2.4 Steam Turbine Blade Materials...7
2.2.5 Failures in LP Turbine Blades...12
2.2.6 Corrosion Fatigue Strength o f Turbine Blade Materials...13
2.3 Marageing Steels...14
2.3.1 18%Ni Marageing Steels... 14
2.3.2 Heat Treatment o f Marageing Steels... 18
2.3.3 TRIP Steels... 18
Sheffield Hallam University Ian Tatner
2.3.5 Stress Corrosion Cracking o f 18% Ni Marageing Steels...21
2.3.6 Air Fatigue And Corrosion Fatigue of 18% Ni Marageing Steel 21 2.4 Air Fatigue... 24
2.4.1 A Brief Historical Review... 24
2.4.2 Crack Initiation... 26
2.4.3 Fatigue Crack Propagation... 29
2.4.4 Linear Elastic Fracture Mechanics...30
2.5 Effect of Grain Size on Fatigue Strength of M etals...35
2.6 Fatigue at Notches... 39
2.6.1 Fatigue Crack Growth at Notches... 40
2.6.2 The Initiation of Fatigue Cracks From Notches...42
2.6.3 Models of fatigue Crack Propagation From a N otch... 51
2.7 Non-Metallic Inclusions...54
2.7.1 Effect o f Inclusions on in Air Fatigue Strength...54
2.7.2 Models Used To Account For Non-Metallic Inclusions And Their Effect On Fatigue Strength... 56
2.8 Corrosion... 61
2.8.1 Introduction... 61
2.8.2 Pitting Corrosion ... 61
2.8.3 Models of Pit Growth.;... 63
2.8.4 Effect o f Notches on Electrochemical Corrosion Processes... 67
2.8.5 Corrosion At Inclusion Sites... 68
2.9 Corrosion Monitoring and Control... 72
2.9.1 Introduction... 72
2.9.3 The Three Electrode C ell... 73
2.10 Corrosion fatigue... ?..76
2.10.1 Introduction... :...76
2.10.2 Corrosion Fatigue Crack Initiation... 78
2.10.3 Corrosion Fatigue Crack Propagation... 87
2.10.4 Electrochemical Effects in Corrosion fatigue...89
2.11 Models of Corrosion Fatigue... 96
2.11.1 Introduction... 96
2.11.2 Superposition Model o f Corrosion Fatigue Crack Growth...96
2.11.3 Process Competition M odel...97
2.11.4 Stress Corrosion Cracking (SCC)... 109
2.12 Potential Control and Monitoring of Corrosion Fatigue Tests...I l l 2.12.1 Introduction... I l l 2.12.2 Effect of Potential on Corrosion Fatigue... I l l 2.12.3 Effect o f Applied Stress on Corrosion Potential... 112
2.12.4 Effect of Dissolved Oxygen on The Fatigue Strength o f Steels 114 2.12.5 Effect of Dissolved Oxygen Concentration on Potential...115
3
Experimental Procedure... 116
3.1 Introduction... 116
3.2 Experimental Progam... 116
3.3 Material Characterisation... 117
3.3.1 FV520B... 117
3.3.2 18 % Ni Marageing Steel... 117
3.3.3 Heat Treatment...118
Sheffield Hallam University Ian Tatner
3.4.1 Tensile Testing... 120
3.4.2 Material Hardness Testing... 121
3.4.3 Slow Strain Rate Testing... 121
3.4.4 Electrochemical Testing...122
3.4.5 Non-Metallic Inclusion Counting... 123
3.4.6 Scanning Electron Microscopy... 123
3.4.7 Finite Element Analysis... ... 124
3.5 Fatigue Testing Program... 125
3.5.1 Fatigue Specimen Design... 125
3.5.2 Air Fatigue Tests... 126
3.5.3 Corrosion Fatigue... 126
4 Results of Experimental Program...
136
4.1 Introduction ... 136
4.2 Static Material Testing... 136
4.2.2 Potentiodynamic Test Results...139
4.2.3 Non-Metallic Inclusion Count Results... 141
4.2.4 F.E.A Test Results...142
4.3 Air Fatigue Test Results... 143
4.3.1 Corrosion Fatigue Test Results...146
4.3.2 Pulse Damage Corrosion Fatigue Test Results ...154
5
D iscussion... 155
5.1 Introduction... ... 155
5.2 Interpretation of Slow Strain Test Results...155
5.4 Effect of Microstructure on Air Fatigue Behaviour... 159
5.4.1 The Effects of Non-Metallic Inclusion on Air Fatigue Strength 162 5.4.2 Air Fatigue Notch Response ... 165
5.5 Corrosion Fatigue... 177
5.5.1 Role of Environment... 177
5.5.2 Effect of Temperature... 178
5.5.3 Imposed Potential Corrosion Fatigue Behaviour... 183
5.5.4 Corrosion Fatigue in Plain Specimens... 193
5.5.5 Pulsed Imposed Potential Corrosion Fatigue Test Remarks...205
5.5.6 Fracture Surfaces of Pulsed Potential Corrosion Fatigue Tests... 210
5.5.7 Modelling of Pulsed Corrosion Testing Threshold...220
5.6 Modelling of Experimental Fatigue Life... 225
5.6.1 Introduction... 225
5.6.2 Fatigue Crack Initiation from a Corrosion Pit... 225
5.6.3 Fatigue Crack Propagation... 228
5.6.4 Calculation of Total Life... 232
5.7 The Effect of The Number of Start-Up Cycles on The Life of a Steam Turbine Blade... 234
5.7.1 Introduction... 234
5.7.2 Assumptions... 234
6
Conclusions...
239
7
Future W ork... 241
Sheffield Hallam University Ian Tatner
Nomenclature
AK Stress Intensity Factor Range MPa-Jm
a . Geometery Factor
cr Stress MPa
a Crack length pm
C,m Paris Constants
do,
— Crack Growth Rate with Respect to Load Cycles pm/cycle dN
<jy Yield Stress MPa
d Average Grain Diameter pm
ky Constant Associated with the Generation of Dislocations
cr. Constant Associated with the Resistance of a Metal to the Movement o f
dislocations
AK th Threshold Stress Intensity Factor Range MPa-Jm
K c Fracture Toughness MPa-Jm
p Notch Root Radius mm
Nj Number of Load Cycles Required to Initiate a Fatigue Crack
crw Fatigue Limit MPa
t Shear Stress Amplitude MPa
R Stress Ratio
Q Depth o f Metal Removed due to applied Current jum
z Number o f Eletrons Released During Anodic Metal Dissolution
F Faraday’s Constant 96500C/mol
co Frequency o f Applied Load Hz
AH Activation Enthalpy J/mol
R Universal Gas Constant 8.3143J/mol-K
do,
— Crack Growth Rate with Respect to Time im /h o u r dt
Ms Martensite Start Temperature, °C
Md Temperature above Which Strain Induced Transformation o f Austenite to
Martensite no Longer Occurs °C
Nf Number of Cycles to Cause Failure
Kt Elastic Stress Concentration Factor
Kf Fatigue Notch Factor
q Notch Sensitivity Factor
lt Transition Length of a Fatigue Crack, fjm
K lscc Stress Corrosion Cracking Threshold Stress Intensity Factor, M P a jm
af Crack Length at Fracture, jum
Np Number o f Cycles to Propagate an Initiated Crack to Failure
d Max Pit Depth, jjm
A Constant dependant upon the material environment combination
t Time, Seconds
Sheffield Hallam University Ian Tatner
List of Figures
Figure 1 - Schematic Arrangement o f a Typical Three Cylinder Steam Turbine...5
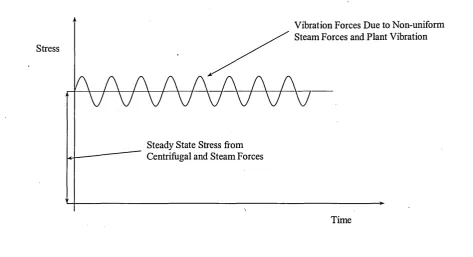
Figure 2 - Schematic Illustration O f Stresses Acting on a Typical Turbine Blade... 6
Figure 3 - Effect o f Carbon, Manganese, Silicon and Sulphur on The Transverse
Properties of 18% Ni Marageing Steel...18
Figure 4 - S-N Curves For Double Vacuum Meltedl8 % Ni Marageing Steel, Test
Conducted At 14 Hz in Laboratory Air or Aerated 3.5 % NaCl... 22
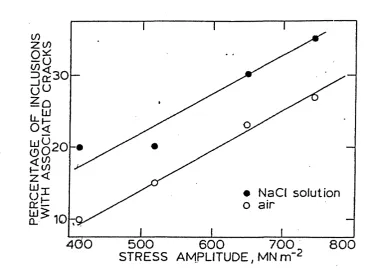
Figure 5 - Percentage o f Inclusions Associated With Cracks At 5% of Expected Life
Versus Stress Amplitude...23
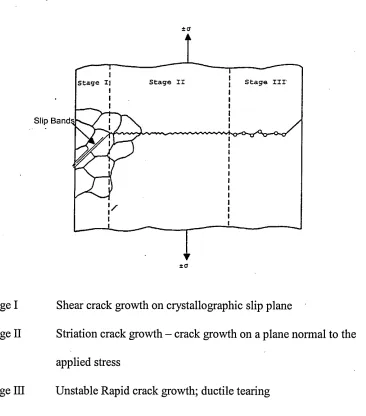
Figure 6 - Schematic Illustration O f The Three Stages O f Fatigue Crack Growth
Under Reversed Tensile Loading... 29
Figure 7 - The Three basic modes of Fracture, (a) Tensile Opening (mode I), (b)
In-Plane Sliding (mode II). (c) Anti-In-Plane Shear (mode El)...31
Figure 8 - Schematic Illustration o f the Different Regimes of Stable Fatigue
Propagation... 33
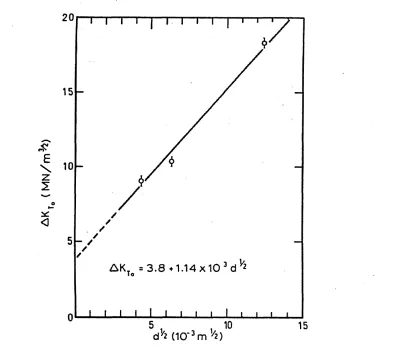
Figure 9 - The Effect of Grain Size on The Threshold Stress Intensity Factor... 36
Figure 10 - Influence o f Plastic Grain Size, Relative to Mean Packet Size, Upon The
Development of Bilinear Form of Fatigue Crack Growth Behaviour... 38
Figure 11 - Effects of Notches on an the Fatigue Strength of an Aluminium Alloy. 39
Figure 12 - Elastic and Plastic Stress Strain Fields at the Notch Root... 41
Figure 13 - Two Processes O f Fatigue Crack Growth From A Notch... 42
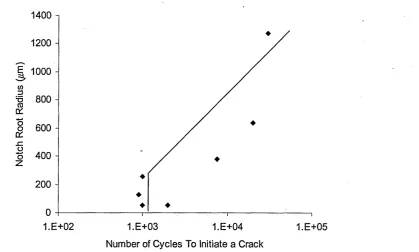
Figure 14 - The Influence of Notch Root Radius (p) on the Number of Cycles to
Initiate a Crack (Ni) From a 2.54 (mm) Deep Notch. For a Mild Steel. Stress
Figure 15 - Effect o f Notch Root Radius on Number of Cycles to Initiation for
2.5%NiCrMoV Under Constant Stress Range... 44
Figure 16 - The Influence o f Effective Stress Intensity Factor (AK/p1/2) (Ksi) on the Number of Cycles to Failure... 45
AK Figure 1 7 -rr Versus The Number of Cycles To Initiate a Fatigue Crack For Three Py2 Heat Treatments on 4140 Steel...46
AK Figure 1 8 - r Versus Number of Cycles To Initiate a Fatigue Crack For Various / / 2 Notch Root Radii. All Tests Conducted in Laboratory Air at Room Temperature... 48
AK Figure 1 9 j-r Versus Number of Cycles To Initiate a Fatigue Crack For Various P A Notch Root Radii in Type 403 Stainless Steel... 50
Figure 20 - Fatigue Behaviour o f Notched Components... 52
Figure 21 - Effect o f Crack Length on Stress Intensity Factor Range...53
Figure 22 - Model Of Non-Metallic Inclusion Debonding... 55
Figure 23 - Time Dependance on Maximum Pit Depth of 3%NiCrMnV Steel in 0.02M Na2B407+0.001M NaCl Solution... 64
Figure 24 - Effect of Surface Geometry on Current Density With Respect To Applied Load Level...68
Figure 25 - Pitting at a Manganese Sulphide Inclusion in FV520B During Constant Potential Testing in the range +50 - +200(mV)scE in 0.1M Sodium Chloride Solution at Room Temperature...69
Sheffield Hallam University Ian Tatner
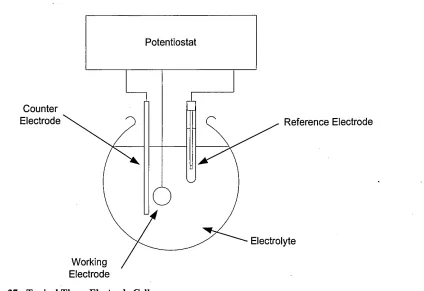
Figure 27 - Typical Three-Electrode Cell... 74
Figure 28 - Endurance Data for Air and Chloride Environments... 77
Figure 29 - Variation Of pH and Potential AT The Tip Of a Propagating Crack Under Cyclic Loading o f 40Khl3 Steel Beam Specimen Exposed To An Aqueous Solution With A pH o f 8 . ...,...80
Figure 30 - Dependency of Pit Density on Applied Cyclic Stress Level Under Fully-Reversed Loading in 0.6M, Aerated Sodium Chloride Solution... 82
Figure 31 - Effects o f Non-Active Pits on the Fatigue Strength o f LP Turbine Shaft Steel... 84
Figure 32 - Effect o f Active Pits, Tests conducted in non-deaerated, deionised water at 80°C. Loading frequency = 100(Hz). Pre-Pitted in Condensing Steam... 84
Figure 33 - Effect of Non-Active and Active Pits on the Threshold Stress Intensity Range for Fatigue Crack Initiation in LP Shaft Steel... 85
Figure 34 - SEM Micrograph of Fatigue Crack Initiation At a Corrosion Pit In 3.5%NiCrMoV Steel tested In Water At 80°C...86
Figure 35 - Variation of Transient Peak Current at Open Circuit Potential With Respect to Number o f Strain Cycles... 91
Figure 36 - Waveforms of Current Transients and Phase Relationship with Cyclic Stress for Passive and Transpassive Ranges... 93
Figure 37 - Schematic Illustration o f Basic Types of Corrosion Fatigue Crack Growth Behaviour... 99
Figure 38 - Fatigue Crack Initiation Process...100
Figure 39 - Model of transition From Corrosion Pit to Fatigue Crack... 101
Figure 40 - Schematic of Brown-Hobson Crack Growth M odel. ...102
Figure 42 - Schematic of Brown-Hobson Crack Growth Model with Akid and Miller
Metal Dissolution Term Included... ... 105
Figure 43 - Schematic of Navarro and de los Rios Crack Growth Model with Akid
and Miller Metal Dissolution Term Included... 105
Figure 44 - Effect o f Pit Depth On Endurance Limit 12 Cr stainless steel R=0.8... 108
Figure 45 - Schematic Representation of Growth Characteristics For CF and SCC.
... !...no
Figure 46 - S-N Curves for a 21%Cr 7%Ni Stainless Steel Under Rotating-Bending
Fatigue Tests in Various Environments... 112
Figure 47 - Results of Potentio-Dynamic Testing on a 21%Cr 7Ni Stainless Steel in
3% NaCl on a Rotating Bending Fatigue Machine with Zero Load Applied. .113
Figure 48 - S-N Curve for a 13%Cr Martensitic Stainless Steel in 3% NaCl Aqueous
Solution at 80°C...114
Figure 49 - Electrochemical Potential Data for SA 333-6 Carbon Steel in Water as a
Function of Oxygen Concentration and Temperature...115
Figure 50 - Tensile Specimen Design All Dimensions in mm... 120
Figure 51 - Slow Strain Rate Testing Specimen Design All Dimensions in m m .... 121
Figure 52 - F.E.A Mesh O f Notched Fatigue SpecimenExperimental Results 124
Figure 53 - Plain Fatigue Specimen Design For Air and Corrosion Fatigue.
Dimensions in m m ... 125
Figure 54 - Notched Fatigue Specimen Used For Air and Corrosion Fatigue All
Dimensions in mm...126
Figure 55 - Schematic Arrangement o f Autoclave and Water Loop System 127
Figure 56 - Sectioned View of Autoclave...128
Sheffield Hallam University Ian Tatner
Figure 58 - Insulating Grip System Used for Corrosion Fatigue Testing... 131
Figure 59 - An External Ag/AgCl Electrode for High Temperature, High Pressure
Use... 133
Figure 60 - Schematic of an External Reference Electrode... 134
Figure 61 - Effect of Temperature on the Slow Strain Rate Response of Softened
Overaged FV520B-B...138
Figure 62 - Graph To Show Effect o f Temperature on the Slow Stain Rate Response
of Peak Hardened FV520B-A... 138
Figure 63 - The Effect of Temperature on Reduction in Area and Elongation for Slow
Strain Rate Tests on Various Blading Materials... 139
Figure 64 - The Effect of Temperature on Tensile Strength for Slow Strain Rate Tests
on Various Blading Materials... 139
Figure 65 - Polarisation Curves For 18%Ni Marageing Steel and Peak Hardened
FV520B. Tests Conducted Open To Air in 0.3% NaCl At Room Temperature,
S.C.E Reference Electrode, Scan Rate = 10(mV/s)... 140
Figure 66 - A Graph of Show The Number and Size o f Inclusions In FV520B and
18%Ni Marageing Steel... 141
Figure 67 - The Ratio o f Area of Inclusions For FV520B and 18% Ni Marageing
Steels to the Total Area Checked...142
Figure 68 - Deformed F.E.A. Mesh Showing Von Mises Equivalent Stresses at the
Notch Root. Stress in Pa...143
Figure 69 - Cycles To Failure Against Applied Stress Amplitude For Both Notched
and Plain Specimen 18% Ni Marageing Steel, R=-l, Kt o f Notch = 2.29 All
Figure 70 - Cycles To Failure Against Applied Stress Amplitude For Notched
Specimen FV520B Peak Hardened FV520B, R =-l, Kt o f Notch = 2.29 All Tests
Conducted in Laboratory Air... 145
Figure 71 - Schematic showing Notation for Pulsed Potential Testing... 150
Figure 72 - Cycles To Failure Against Applied Stress Amplitude For Notched
Specimen Peak Hardened FV520B-A, R=-l, Kt of Notch = 2.29 All Tests
Conducted Within The Autoclave in Distilled Water at 2Hz...150
Figure 73 - Cycles To Failure Against Applied Stress Amplitude For Notched and
Plain Specimen Peak Hardened FV520B-A and 18% Ni Marageing Steel, R=-l,
Kt of Notch = 2.29. All Tests Conducted Within The Autoclave in 0.3% Sodium
Chloride at 100°C at 2Hz... 151
Figure 74 - Cycles To Failure Against Applied Stress Amplitude For Notched and
Plain Specimen Peak Hardened FV520B-B and 18% Ni Marageing, R =-l, Kt o f
Notch = 2.29. All Tests Conducted Within The Autoclave in 0.3% Sodium
Chloride at 100°C at.+200(mV)Ag/Agci. All Tests at 2 (Hz) Unless Otherwise
Stated... 152
Figure 75 - Cycles To Failure Against Applied Stress Amplitude For Notched
Specimen Peak Hardened FV520B-B, R=-l, Kt o f Notch = 2.29. All Tests
Conducted Within The Autoclave in 0.3% Sodium Chloride at 100°C at
-200(m V)Ag/AgCi at 2(Hz)... 152
Figure 76 - Cycles To Failure Against Applied Stress Amplitude For Notched
Specimen Peak Hardened FV520B-B, R=-l, Kt of Notch = 2.29. All Tests
Conducted Within The Autoclave in 0.3% Sodium Chloride at 100°C at -
Sheffield Hallam University Ian Tatner
Figure 77 - Cycles To Failure Against Period at +200(mV)Ag/Agci in cycles. For
Notched Specimen Peak Hardened FV520B-B, R=-l, Kt o f Notch = 2.29. All
Tests Conducted Within The Autoclave in 0.3% Sodium Chloride at 100°C at
2 (Hz)... 154
Figure 78 - Vickers Hardness Results For Slow Strain Rate Specimen Stubs 157
Figure 79 - Microstructure o f Marageing Steel (Etched With 2% Picral)... 159
Figure 80 - Microstructure o f FV520B Peak Hardened (Etched With 2% Picral)... 160
Figure 81 - Fatigue Limit Verses Inverse Root o f Grain Size. Taira et al Data for a
low Carbon Steel...161
Figure 82 - Calculated and Experimental Values of Fatigue Limit Versus Inclusion
Size...163
Figure 83 - Peterson Constant (a) Versus Vickers Hardness N um ber... 166
Figure 84 - Graph To Show Plain Fatigue Data for FV520B Plotted With Calculated
Notched Data...167
Figure 85 - Graph To Show Plain Fatigue Data for 18Ni Marageing Steel Plotted
With Calculated Notched Data... 168
Figure 86 - Cycles To Failure Versus Stress Amplitude For Peak Hardened FV520B.
...169
Figure 87 - Cycles To Failure Versus Stress Amplitude For 18% Ni Marageing Steel
...170
Figure 88 - Fatigue Notch Factor Versus Cycles To Failure For FV520B and 18% Ni
Marageing Steel... 170
Figure 89 - Notch Sensitivity Factor Versus Cycles To Failure For FV520B and 18%
Figure 90 - Fracture Surface of 18% Ni Marageing Steel Tested in Air at ±300(MPa),
7(Hz),Nf = 127080... ... 173
Figure 91 - Fracture Surface of 18% Ni Marageing Steel Tested in Air at ±300(MPa),
7(Hz), N f = 127080. Showing Striations... 174
Figure 92 - Fracture Surface of 18% Ni Marageing Steel Tested in Air at ±300(MPa),
7(Hz), N f = 127080. Showing Striations...175
Figure 93 - Typical Fracture Surface from Failed Peak Hardened FV520B Fatigue
Specimen Tested in Laboratory Air (20°C) ±390(MPa) N f = 158090... 176
Figure 94 - Stress Amplitude Versus Cycles To Failure For Plain and Notched
Marageing Steel... 177
Figure 95 - Stress Amplitude Versus Cycles To Failure Data for Plain 18 Ni
Marageing Steel, Cottis Data @ 14(Hz) Laboratory Temperature, Tatner Data @
2 (Hz) 100°C... 179
Figure 96 - View of A Fractured Plain Marageing Steel Specimen Showing General
Corrosion. Tested At ±300 (MPa), R=-l, 2 (Hz), in 0.3% NaCl at FCP at 100°C,
Nf = 33608...180
Figure 97 - Cycles To Failure Versus Stress Amplitude For Notched and Plain
FV520B In A ir , Water And 0.3%NaCl... 180
Figure 98 - View o f A Fractured Notched FV520B Steel Specimen Showing No
General Corrosion. Tested At ±300 (MPa), R=-l, 2 (Hz), in 0.3% NaCl at FCP
at 100°C, Tested for 106 Cycles No Failure...181
Figure 99 - Fracture Surface of a Plain Marageing Specimen Subjected to ±300(MPa)
in 100°C 0.3% NaCl at FCP... 182
Figure 100 - Cycles To Failure Versus Stress Amplitude For Notched And Plain
Sheffield Hallam University Ian Tatner
NaCl Solution At Various Values o f Applied Potential (Ag/Agci), All Tests
conducted At 2 (Hz) unless stated, 100°C... 183
Figure 101 - Fracture Away From Notch. Notched FV520B Specimen Subjected to
±75MPa at 2Hz, 100°C 0.3% N aC l, 0(mV)Ag/Agci Nf = 323310... 184
Figure 102 - Failed Specimen Showing Iron Oxide (Magnetite) Deposited During
Testing of Plain Specimen FV520B at 100°C in 0.3% NaCl +200 (mV)Ag/AgCi
±75(MPa) 2(Hz), Nf = 127080... 185
Figure 103 - Fracture Surface o f Peak Hardened FV520B, ±300 (MPa) 2(Hz), R = -1,
0.3% NaCl, 100°C, +200 (mV)Ag/Agci, Nf = 32610...186 Figure 104 - Fracture Surface of Peak Hardened FV520B, ±150 (MPa) 2(Hz), R = -1,
0.3% NaCl, 100°C, +200 (mV)Ag/Agci, Nf = 52580... 186
Figure 105 - Fracture Surface of Peak Hardened FV520B, ±75 (MPa) 2(Hz), R = -1,
0.3% NaCl, 100°C, +200(mV)Ag/Agci, Nf = 211280...187 Figure 106 Fracture Surface of Peak Hardened FV520B, ±300 (MPa) 0.5(Hz), R =
-1, 0.3% NaCl, 100°C, +200(mV)Ag/Agci, Nf = 7810...188
Figure 107 Fracture Surface of Peak Hardened FV520B, ±75 (MPa) 0.5(Hz), R =
-1, 0.3% NaCl, 100°C, +200 (mV)Ag/Agci, Nf = 29660 ... 188
Figure 108 - Fracture Surface of Peak Hardened FV520B, ±300 (MPa) 2(Hz), R = -1,
0.3% NaCl, 100°C, 0(mV)Ag/Agci, Nf= 39390... 189
Figure 109 - Fracture Surface of Peak Hardened FV520B, ±150 (MPa) 2(Hz), R = -1,
0.3% NaCl, 100°C, 0(mV)Ag/Agci, Nf = 148120... 189
Figure 110 - Fracture Surface of Peak Hardened FV520B, ±75 (MPa) 2(Hz), R = -1,
Figure 112 - Corrosion-Fatigue Transition Point Versus Applied Stress Amplitude
For FV520B Notched Specimen...191
Figure 113 - Fracture Surface o f Peak Hardened FV520B, ±150 (MPa) 2(Hz), R = -1,
0.3% NaCl, 100°C, +200(mV)Ag/Agci, Nf = 52580... 192
Figure 114 - Fractured Stub of FV520B-B Plain Specimen Tested at +200(mV)Ag/Agci
in 100°C NaCl, ±300 (MPa), 2(Hz), R=-l, Nf =10221... 194
Figure 115 - Fractured Stub o f FV520B-B Plain Specimen Tested at +200(mV)Ag/Agci
in 100°C NaCl, ±150 (MPa), 2(Hz), R=-l, Nf = 59836... 194
Figure 116 - Fractured Stub o f FV520B-B Plain Specimen Tested at ±200(mV)Ag/Agci
in 100°C NaCl, ±75 (MPa), 2(Hz), R=-l, Nf = 184024... 195
Figure 117 - Transition Point from Fractured Stub of FV520B-B Plain Specimen
Tested at +200(mV)Ag/Agci in 100°C NaCl, ±75 (MPa), 2(Hz), R =-l, Nf =
184024... 195
Figure 118 - Effect of Applied Stress Range on Crack Transition Depth for Plain
FV520B-B Corrosion Fatigue Specimen Tested at +200(mV)Ag/AgCl, R =-l,
2(Hz), 100°C in 0.3% NaCl... 196
Figure 119 - Crack Growth at Notch... 198
Figure 120 - Band of Material Damaged Due to Hydrogen Charging Process 203
Figure 121 - Q Versus N, With an Exposed Area of 2.29*10'5(m2) 75(MPa) 2(Hz),
±200(mV)Ag/Agci in 0.3% NaCl at 100°C... :... 204 Figure 122 - Notch Area of FV520B-B Corrosion fatigue Specimen Subjected to 90
Sheffield Hallam University Ian Tatner
Figure 123 - Notch Area o f FV520B-B Corrosion fatigue Specimen Subjected to 600
cycles at +200(mV)Ag/AgCi at The Start of Testing in 0.3% NaCl at 100°C,
±300(MPa) 2(Hz)...207
Figure 124 - Notch Area of FV520B-B Corrosion fatigue Specimen Subjected to 600
cycles at +200(mV)Ag/AgCi at The Start of Testing in 0.3% NaCl at 100°C,
±300(MPa) 2(Hz)... 207
Figure 125 - Notch Area of FV520B-B Corrosion fatigue Specimen Subjected to
1800 cycles at +200(mV)Ag/Agci at The Start o f Testing in 0.3% NaCl at 100°C,
±300(MPa) 2(Hz)... 208
Figure 126 - Notch Area of FV520B-B Corrosion fatigue Specimen Subjected to
1800 cycles at +200(mV)Ag/Agci at The Start o f Testing in 0.3% NaCl at 100°C,
±300(MPa) 2(Hz)... 208
Figure 127 - Notch Area of FV520B-B Corrosion fatigue Specimen Subjected to
1800 cycles at +200(mV)Ag/Agci at The Start o f Testing in 0.3% NaCl at 100°C,
±300(MPa) 2(Hz)... 209
Figure 128 - Notch Area of FV520B-B Corrosion fatigue Specimen Subjected to
1800 cycles at +200(mV)Ag/Agci at The Start of Testing in 0.3% NaCl at 100°C,
±300(MPa) 2(Hz). Showing a Crack Growing From a Corrosion Pit...209
Figure 129 - Fatigue Crack Initiating From Corrosion Pitting on Fracture Surface of
Notched Specimen Subjected to 1800 cycles at +200(mV)Ag/Agci at The Start of
Testing in 0.3% NaCl at 100°C, ±533(MPa) 2(Hz) R=-l. Nf = 65828...212
Figure 130 - Fracture Surface of Notched Specimen Subjected to 14400 cycles at
Figure 131 - Fracture Surface of Notched Specimen Subjected to 2400 cycles at
+200(mV)Ag/AgCi at The Start of Testing in 0.3% NaCl at 100°C, ±225(MPa) 2 (Hz) R=-l. Nf = 139712... ... 215
Figure 132 - Fracture Surface o f Notched Specimen Subjected to 7200 cycles at
+200(mV)Ag/Agci at The Start o f Testing in 0.3% NaCl at 100°C, ±225(MPa) 2 (H z)R = -l.N f = 53264... 216
Figure 133 - Fracture Surface o f Notched Specimen Subjected to 14400 cycles at
+200(mV)Ag/Agci at The Start of Testing in 0.3% NaCl at 100°C, ±225(MPa)
2 (H z)R = -l.N f = 45810... ...216
Figure 134 - Fracture Surface of Notched Specimen Subjected to 2400 cycles at
+200(mV)Ag/Agci at The Start of Testing in 0.3% NaCl at 100°C, ±300(MPa)
2(Hz) R=-l. Nf = 5280... 217
Figure 135 - Fracture Surface of Notched Specimen Subjected to 2400 cycles at
+200(mV)Ag/Agci After 500,000 cycles at ±75(MPa) in 0.3% NaCl at 100°C,
±300(MPa) 2(Hz) R=-l. Nf = 25993...217
Figure 136 - Fracture Surface of Notched Specimen Subjected to 90 cycles at
+200(mV)Ag/Agci at The Start of Testing in 0.3% NaCl at 100°C, ±400(MPa)
2 (H z)R = -l.N f = 14050... 218
Figure 137 - Fracture Surface of Notched Specimen Subjected to 1800 cycles at
+200(mV)Ag/Agci at The Start o f Testing in 0.3% NaCl at 100°C, ±533(MPa)
2 (H z)R = -l.N f = 65828... 218
Figure 138 - The Effect o f Pulsed Corrosion Damage Fatigue Testing. *=Simnad and
Evans Mild Steel Corrosion Fatigue in 0.1M Potassium Chloride Solution at
100 (Hz). Rollins et al High Carbon Steel Tested at 25 (Hz). Tatner FV520B
Sheffield Hallam University Ian Tatner
Fatigue in Solution, FCP at Stress Level Indicated Until Failure. Arrow
Indicates No Failure... 220
Figure 139 - Fracture Surface o f a Specimen Subjected to 1800 Cycles at
+200(mV)Ag/Agci ±75(MPa) Prior to Testing at FCP at ±300(MPa) at 100°C in 0.3% NaCl. Specimen did not Fail During Test and was Subsequently Pulled to
Cause Failure'... ’...222
Figure 140 - Fracture Surface of a Specimen Subjected to 2400 Cycles at
±200(mV)Ag/AgCl ±75(MPa) Prior to Testing at FCP at ±150(MPa) at 100°C
in 0.3% NaCl. Specimen did not Fail During Test and was Subsequently Pulled
to Cause Failure...222
Figure 141 - High magnification of Fracture Surface o f a Specimen Subjected to
1800 Cycles at ±200(mV) Ag/Agci ±75(MPa) Prior to Testing at FCP at
±300(MPa) at 100°C in 0.3% NaCl. Specimen did not Fail During Test and was
Subsequently Pulled to Cause Failure...223
Figure 142 - High magnification of Fracture Surface o f a Specimen Subjected to
2400 Cycles at ±200(mV) Ag/Agci ±75(MPa) Prior to Testing at FCP at
±150(MPa) at 100°C in 0.3% NaCl. Specimen did not Fail During Test and was
Subsequently Pulled to Cause Failure... 223
AK
Figure 143 - Number of Cycles To Initiate a Fatigue Crack Versus —- r... 226
P A
AK
Figure 144 -r Versus The Number o f Cycles To Initiate a Fatigue Crack During
P
AK
Figure 145 rr Versus The Number of Cycles To Initiate a Fatigue Crack For
P 2
Various Notch Root Radii. From Atkinson and Lindley 2.5%NiCrMoV , *Kim
et al 4140 Steel and Clark 403 Type SS . With Clark Type 403 SS in Steam at
100°C and Tatner in 0.3% NaCl at 100°C...228
Figure 146 - Calcultaed Crack Propagation Life Versus Experimental Crack
Propagation Life... 231
Figure 147 - Experimental Values o f Total Life Versus Calculated Values... 232
Figure 148 - Effect o f Crack Length on Fatigue Thresholds... 235
Figure 149 - Pit Size Versus The Number Of Start Cycles For A Steam Turbine
Blade... 236
Figure 150 - A Graph To Stress Intensity Factor Range (MPa m 1/2) Versus The
Number O f Start Cycles For A Steam Turbine Blade...237
Figure 151 - The Number of Start Cycles Versus Life Prior To Crack Initiation In A
Sheffield Hallam University Ian Tatner
List of Tables
Table 1 - Nominal % Mass Composition of Standard Martensitic Stainless Steels.
Table 2 - Composition of 18% Ni Marageing Steels.
Table 3 - Comparison o f Measured and Calculated
Table 4 - Proof Stress Values For Materials Used in Fatigue Crack Initiation
Experiments.
Table 5 - Composition of Materials Tested.
Table 6 - Three Stage Heat Treatment Schedule.
Table 7 - Air Fatigue Tests Conducted.
Table 8 - Tensile Test Results For Peak Hardened FV520B.
Table 9 - Vickers Hardness Results.
Table 10 Air Fatigue Test Results.
Table 11 - Corrosion Fatogue Test Results.
Table 12 - Corrosion Fatigue Potential Pulse Test Results.
Table 13 - Calculated and Experimental Fatigue Limits Based on Inclusion Area.
Table 14 - Crack Data for a Constant Imposed Potential.
Table 15 - Stress Intensity Ranges for Constant Potential Tests Conducted on
Notched Specimen.
Table 16 - Results of Thiourea Test.
Table 17 - Results o f Pulsed Imposed Potential Corrosion Fatigue Tests.
Table 18 - Results of Pulsed Imposed Potential Corrosion Fatigue Tests.
Table 19 - Comparison o f Number o f Cycles To Failure for Specimens Tested in Air
and Under Pulsed Potential Conditions.
Table 20 - Pit-Crack Transition Stress Intensity Factor Ranges From Previous Works.
Table 21 - Stress Intensity For Corrosion Pits Formed Due To Applied Corrosion
Potential.
Table 22 - Threshold Conditions From Pulsed Corrosion Potential Corrosion Fatigue
Testing.
Table 23 - Calculated Pit Depths and Stress Intensity Factor Ranges for Threshold
Sheffield Hallam University Ian Tatner
1
Introduction
Since the privatisation o f the UK electricity industry in the early 1990s there has been
much more two shifting at generating plants where turbines are either turned off at
times of low demand or follow electricity demand. In either situation turbines
designed for high temperature continuous operating conditions are subjected to the
fluctuating conditions caused by the continual stop-start o f the power station [1]. In
the past power generation units would be run for many years on constant demand
delivering the base demand for electricity with older units being brought back online
at times of high demand. The delivery o f base load electricity is now often achieved
with the use o f more thermally efficient gas fired stations, with older coal fired
stations covering peak load, this means older coal fired stations are being turned on
and off more often than intended [2]. As the use of'Green' power is increased this
problem will only get worse, 'green energy' is very difficult to schedule and so when
high electricity demand is matched with low output from Green sources, fossil
sources will be required to makeup any short fall until demand drops or output from
•'Green' plants is increased. Two-shifting or demand following would cause water
chemistry transients, Starr [1] comments "weekend shut downs can upset boiler water
treatment. Demineralisation units do not work to specification. Air can be drawn into
the system. The upshot is corrosion fatigue.". Reduced feed water quality can also
have extremely damaging consequences on corrosion fatigue, Lindley [3] states "
From a practical viewpoint, it is of prime importance to limit the time during which a
major threat to existing plant is reduced feed water quality or contamination"
Atkinson [4],
The present work assesses the effect of water purity transients on the corrosion
fatigue strength of a low pressure turbine blade material. The work carried out
focuses on FV520B steel, building on the earlier work by Clark [5]. Corrosion
fatigue tests were conducted on both FV520B and a 18 % Ni marageing steel. The
marageing steel was selected as it possesses similar mechanical characteristics as
FV520B but due to its low chromium content has low corrosion resistance in
relatively mild environments. Though both materials fail due to corrosion fatigue,
due to the different corrosion dynamics of the two materials, it was expected that
their failure lives would be different. To this end a high temperature re-circulating
corrosion fatigue test rig was designed and built. The test rig also incorporated a
potentiostat which allowed simulation of actual service conditions and the damage
due to impurities and dissolved oxygen. Fatigue and corrosion damage were
quantified using SEM and optical methods. The results from this work facilitated the
development o f a corrosion damage model based on a LEFM approach. It was shown
there is a threshold value below which the corrosion pit fails to develop into a
growing crack. The threshold value was seen to be a function o f the pit depth and the
applied stress level, hence an LEFM type approach was used. By using the initial pit
depth as a pseudo crack length a propagation life model was proposed based on a
integrated Paris law approach. This was further developed by including consideration
o f the number o f cycles required to initiate a growing crack from a corrosion pit. The
initiation and propagation models were combined to give a total life prediction that
Sheffield Hallam University Ian Tatner
The empirical models developed were combined with an equation derived from
Faraday's law that was used to predict pit depths using electrochemical data
combined with loading data. The combination o f the Faraday approach to pit depth
prediction and the use o f a LEFM type approach, seen to work in the current study
produced a tool capable of assessing the effect o f the number of start-up cycles on the
2 Literature Review
2.1
Introduction
This chapter will review the published work and the pertinent research carried out in
the area of corrosion fatigue.
2.2
Turbine Blades
This section describes and where possible quantifies the mechanical and
electrochemical conditions faced by LP turbine blades in service. A brief summary is
given on the various LP blading materials and details are given o f the known issues
in the corrosion fatigue resistance of these materials.
2.2.1 Steam Turbines
Steam turbines convert steam energy into rotational kinetic energy that is used to turn
an alternator thus producing alternating current. Large steam turbine generator units
are used to produce electrical power in the 100-1300 MW range. These include both
fossil fuel and nuclear systems. Fossil fuelled turbines operate at around 50-60 Hz
with steam inlet conditions in the order of 550°C at 15-25 MPa and normally produce
660 MW power. Nuclear turbines operate at 30 Hz with steam conditions normally
about 250°C at 5 MPa. Nuclear turbines are generally larger in physical size due to
the larger volumes of steam to be accommodated at the lower operating speed, Rust
Sheffield Hallam University Ian Tatner
In the early stages o f steam turbine development there was only one cylinder being
driven by a steam generator. Since output demand increased and efficiency was
enhanced multi-cylinder turbines were developed. The modem power generation
steam turbines are usually made up of several separate turbine cylinders connected on
a single shaft. Incoming steam from the steam generator first enters the high pressure
(HP) cylinder then subsequently proceeds to the intermediate (IP) and low pressure
(LP) cylinders which allow more energy to be extracted from it. See Figure 1.
HP Steam Inlet
I
. ►HPCYL.
To Reheater |
____________^ From Reheater
IPCYL. LP CYL. Alternator
To Condenser
Figure 1 - Schematic Arrangement o f a Typical Three Cylinder Steam Turbine
2.2.2 Stresses Acting on LP Turbine Blades
The stresses acting on a LP blade, assuming it is properly tuned are a combination of
predominantly steady stresses from centrifugal forces and steam bending.
Superimposed on the steady stresses are alternating stresses caused by cyclic or
random variations in the steam flow conditions. See
Vibration Forces Due to Non-uniform Steam Forces and Plant Vibration Stress
Steady State Stress from Centrifugal and Steam Forces
[image:37.614.70.544.41.298.2]Time
Figure 2 - Schematic Illustration O f Stresses Acting on a Typical Turbine Blade.
The combined effect of alternating stresses and mean stress is a situation that has
been seen to initiate fatigue failures in pitted LP blades. The stress concentrating
effect of the geometry at the root of blades where they are connected to the rotor
should also be considered. There are times when the turbine and hence the blade are
subjected to low predominantly static stresses, such as during barring. Barring is a
process carried out at times of low power demand where the turbine is rotated at 0.33
Hz otherwise the turbine shaft may bend if rotation is stopped while the turbine is at
a higher temperature. However, it is known that the reduction o f steam quality during
barring leads to localised corrosion attack of the blades.
2.2.3 Environmental Conditions Near an LP Steam Turbine Blade
The steam supplied to turbines is highly controlled to ensure minimal contamination
and hence prolong turbine life. However, from time to time steam purity will become
Sheffield Hallam University Ian Tatner
two shifting. These occasional breakdowns manifest themselves in pollution of the
turbine causing deposits o f acids, chlorides and sulphates in the transition region
where the incipient moisture condenses.
The superheated steam initially condenses at a point along the turbine known as the
Wilson or moisture line. It is the blades in this region that are exposed to the most
harmful environmental conditions. Typically the transition from dry to wet steam
takes place in the next to last row (L-l) in the LP turbine. Viswanathan et al [8]
comments "The initial condensation can have the most marked environmental
effect". The most harmful effect o f the condensing steam is that of localised or pitting
corrosion. The most severe blade corrosion is generally found where the blade is
attached to the rotor shaft. Here the corrosion is enhanced by grooves or cracks, it is
these grooves that also lead to high local stresses.
2.2.4 Steam Turbine Blade Materials
Steam turbine blade materials are selected on the basis of a number of properties,
such as, strength to weight ratio, fatigue strength, corrosion resistance, damping
capacity, erosion resistance and cost. Extensive work in material development was
carried out in the 1960’s and 1970's as turbines became larger (up to 660MW) and
blade materials were improved to give higher strength and pitting corrosion
resistance.
The standard LP turbine blade material used in steam turbines manufactured world
wide is a martensitic steel containing 12-13%Cr. It is known that the 12%Cr steel is
a good blade material that serves well in high purity steam [9].
Due to some failures in LP blades several alternatives to the standard 12%Cr material
alternative blading materials, with particular emphasis being paid to the precipitation
hardenable stainless steels that are the subject of the current research.
2.2.4.1 Duplex Steels
Duplex steels differ from the 12% Cr martensitic steels as they posses a dual phase
microstructure of ferrite and austenite. Due to the high Chromium and Molybdenum
contents they have excellent corrosion resistance even in hot concentrated chloride
solutions. However, duplex steel strength levels are considerably lower than those
achievable with 12% Cr when at elevated temperatures. Reductions o f up to 25% of
yield strength at 100°C for a 22 Chromium grade Duplex have been reported [10].
2.2.4.2 High Nitrogen 12 Cr
With the invent of high nitrogen steels an attempt was made to apply the concept of
substitution of carbon by nitrogen to 12 Cr steels in order to improve corrosion
resistance. Leffler [11] comments "Nitrogen increases the resistance to localised
corrosion, especially in combination with molybdenum" and goes onto say "in
martensitic and martensitic-austenitic steels nitrogen will increase both hardness and
strength".
2.2.4.3 Precipitation Hardenable Martensitic Stainless Steels
The martensitic stainless steels with chromium contents o f 13-17% were widely used
in engineering applications in the early 1900's. Their corrosion resistance was
Sheffield Hallam University Ian Tatner
state was difficult and expensive, and high temperature softening treatments would
cause serious surface oxidation and possible distortions.
Fabrication is limited when the material is used in the hardened condition this is due
to poor ductility. The high carbon contents caused a reduction in weldability.
Welding causing deep hardening of weldment and the heat affected zone, introducing
the risk o f cracking. These factors made the use o f martensitic steels in critical
applications such as nuclear plants, unlikely. A gap existed in the stainless steel range
for a material that could be heat treated, was corrosion resistant and above all, was
tough and weldable.
In the 1940's Precipitation Hardenable (PH) martensitic steels were developed. The
object o f precipitation hardening is to create in a heat treated alloy a dense and fine
dispersion of precipitate particles in a matrix of deformable metal. The precipitate
particles act as obstacles to dislocation movement and thereby increase fatigue
strength in the heat treated alloy. The precipitation hardening o f a homogeneous
material involves three basic steps;
Step 1
Solution treatment- the material is soaked at temperature until a uniform solid
solution is obtained.
Step 2
Quenching- the aim o f quenching is to lock in the precipitates thus giving a super
saturated solid solution. This quenching may occur by simply air cooling depending
Step 3
Precipitation hardening (ageing) - this phase o f the precipitation treatment controls
the size of the precipitate and hence the final strength level.
The time period and temperature o f the final heat treatment are controlled to give one
o f three strength conditions, namely, peak hardened, standard overaged, softened
overaged. These conditions can be thought of as controlling the size o f the precipitate
particle relative to the metal matrix. As the precipitate gets bigger it presents a more
comprehensive block to the movement of dislocations thus giving a higher strength
material. When the precipitate particle becomes so large it is no longer a coherent
part of the metal matrix dislocations can move around the precipitate. The three
ageing conditions above relate to the size and spacing of the precipitates relative to
the metal matrix. The peak hardened condition corresponds to the largest possible
coherent precipitate. The standard overaged is a condition where the precipitate is no
longer coherent but does increase strength by blocking the movement o f dislocations.
The softened overaged material is the same strength level as before ageing treatment
but with large incoherent precipitates.
Early grades of PH steels such as 17/4 PH were developed leading to a range o f PH
grades. Nominal compositions of some standard PH martensitic stainless steels are
Sheffield Hallam University Ian Tatner
Grade
Chemical Composition %
C Si Mn Cr Ni Mo AL Cu Ti Nb
17/4 PH 0.04 0.6 0.3 16 4.2 - - 3.4 -
-15/5 PH 0.04 0.04 0.3 15 4.5 - - 3.4 -
-Custom 450 0.03 0.25 0.25 15 6 0.8 - 1.5 - 0.3
13/8 PH 0.04 0.03 0.03 13 8.2 2.2 1.1 - -
-Custom 455 0.03 0.25 0.25 12 8.5 - - 2.5 1.2 0.3
FV520B 0.05 0.4 0.8 14 5.5 1.7 - 1.8 - 0.35
Table 1 - Nominal % M ass Composition of Standard M artensitic Stainless Steels [12]
PH steels have found widespread application as turbine blade materials due to their
high fatigue strength in air and excellent corrosion resistance along with a high level
of toughness.
2.2.4.4 Titanium Alloys
Titanium alloys are considered as one o f the most common blading materials in large
power generating steam turbines in the USA. The high strength to weight ratio of
titanium and its high corrosion resistance make it an ideal turbine blade material. The
advantages o f using titanium over conventional blading materials apply best in the
LP turbine where steam temperatures are low, steam volume are high and blades are
longest. The reason for using titanium in the LP turbine is due to increased power
capacity. Increasing the power capacity of a turbine demands more steam flow. This
can be fulfilled either by increasing blade lengths or increasing the diameter on which
the blade rotates. In either case the centrifugal forces imposed on the blade will be
Titanium is lower in density than steel so by using Titanium the length of the blade
can be increased without increasing stresses in the blade itself or the shaft that carries
the blade. Since the Titanium and 12% Cr blades share similar dynamic vibration
characteristics little alteration would be required for a set of 12% Cr blades to be
replaced with Titanium [6].
There is however little interest in the UK for using Titanium as a turbine blade
material. This is probably due to the fact that titanium blades are considerably more
expensive than 12% Cr blades. Recently Titanium has been suggested as a solution
for turbine blade corrosion problems [6]. However, change of material to Titanium is
not the only solution to these problems, better steam purity, design and possible
coating of the blade are options that could reduce corrosion effects. At present, the
market conditions do not demand Titanium blades, current economic factors in the
power industry do not justify the development and acquisition of new plants.
2.2.5 Failures in LP Turbine Blades
As a result of the environmental and stress systems detailed blade failures in the area
of the Wilson line are by far the main source of failures in the entire turbine [13], and
as such have received international research attention.
Viswanathan et al [8] comments, "Corrosion-fatigue is probably the major source of
steam turbine blade fatigue failures." It has been shown by many investigators that
the alternating and static stresses on blades alone were in many situations insufficient
to cause failure. Laboratory controlled corrosion-fatigue tests have shown
considerable reduction in a materials fatigue strength, by up to seventy percent or a
Sheffield Hallam University Ian Tatner
Broadly speaking the blade failure problem has seen a two pronged attack, one
approach developed mainly by Chemists is to improve steam quality and reduce
water chemistry transients. The second approach used was to accept that steam
quality will vary and to either reduce the blade stresses to such a level that blades can
operate in a pitted condition without failure or change the blade material to a more
resistant one. It has been suggested by some workers [14] that by allowing load
variations to be arranged in such a way that the transition row (Wilson line) operate
wet occasionally then washing effects will allow the conditions that promote the
pitting in blades to be avoided.
Several alloys have been used as replacement for conventional 12%Cr steel. Coatings
that prevent exposure o f the 12%Cr surface to the environment within the steam
turbine have been considered however problems with concentrated exposure at small
defects in the coating have prevented widespread consideration.
2.2.6 Corrosion Fatigue Strength of Turbine Blade Materials
Corrosion fatigue is the dominant failure process of LP steam turbine blades. Hence a
high corrosion fatigue resistance is one o f the central demands in selecting a blading
material. Pitting has been identified as important in the corrosion fatigue failure
proces [3]. Pits act as notches in two respects, firstly they are sites of mechanical
stress concentration and secondly the electrolyte local to the pit can change becoming
more aggressive relative to the bulk solution. The process o f corrosion fatigue in
notched components such as turbine blades one must also view geometrical notches
both in terms o f their stress and chemical concentrating capabilities. It has been
shown [15] that the pH of the solution within the pit will drop and the chloride
conditions within the pit become more cathodic with respect to the bulk [16]. This
has lead to suggestions that the reduction in service life maybe a result o f hydrogen
embrittlement. A greater effect due to hydrogen is observed in higher strength steels.
It is difficult to find a valid ranking of steam turbine materials with respect to their
corrosion fatigue resistance. No one material stands out as superior in all conditions.
Even materials that are generally regarded as having superior corrosion resistance
show weak points under the ‘right’ conditions [17]. It is difficult to sum up the
aggressivity o f an environment as complex as that in a working steam turbine. The
chloride concentration has been shown to give a good indication o f the effectiveness
of an aqueous environment in reducing the fatigue strength of turbine blade materials
[17].
2.3
Marageing Steels
The term Marageing comes from the ageing of a steel in the martensitic condition.
Marageing steels have high strength levels while maintaining high toughness.
Marageing steels have found varied uses in the aerospace and aircraft industries.
These uses have included rocket motor cases, landing gear components, aircraft
forgings and fasteners. Other areas include machine tool and die applications, and
extrusion hardware. Uses include hydrofoil systems and aircraft arrester hooks [18].
2.3.1 18%Ni Marageing Steels
Marageing steels were originally developed in the 1950s with nickel contents around
25% by The International Nickel Company [19]. Further developments o f these early
Sheffield Hallam University Ian Tatner
(250) and 18Ni (300) grades. Table 2 shows the typical composition o f these widely
used 18% Ni marageing steels.
Alloy addition
18% Ni Series
200 250 300
Ni 17/19 17/19 18/19
Ti 0.15/0.25 0.3/0.5 0.5/0.8
Al 0.05/0.15 0.05/0.15 0.05/0.15
Co 8/9 7/8.5 8.5/9.5
Mo 3/3.5 4.6/5.1 4.6/5.2
Nb - -
-Table 2 - Composition o f 18% Ni M arageing Steels, [20]
Other elements include C 0.3 (max.); Mn 0.12 (max.);Si 0.12 (max.); S 0.01 (max.); P 0.01 (max.); B 0.003 (added); Zr 0.02 (added); Ca 0.05 (added); Si + Mn combined less than 0.20 max.
The addition of around 20% nickel to iron produces a Fe-Ni matrix that has a
hysteresis o f martensite formation on cooling and reversion to austenite upon heating
to around 600° (the As temperature). The As temperature o f the Fe-Ni martensitic
matrix is high enough that marageing steels can be aged at around 485°C without
reversion o f the martensite matrix to austenite. The low levels o f carbon in 18% Ni
marageing steels help to keep the martensite Fe-Ni matrix ductile [23]. The
precipitation hardening reaction gives the high strength/toughness associated with
marageing steels. Marageing steels are less notch sensitive than other high strength
steels such as 4340 [20]. There is also no evidence o f a sharp ductile to brittle
transition at lower temperatures [20] this is due to the nickel content [21].
All conventional grades of 18 %Ni marageing steel are either single or double
vacuum re-melted to ensure good cleanliness [23]. The specific strength level that
o f titanium, molybdenum and cobalt [23]. It is believed [20] that around 50% o f the
final yield strength of the fully heat treated 18% Ni marageing steel comes from the
martensitic matrix. The strengthening contributions to 18% Ni marageing steels have
been shown to be as follows [20];
• cobalt gives an incremental effect on the yield stress o f 7-14
MPa per 0.1% added
• Molybdenum gives an incremental effect on the yield stress of
14-21 MPa per 0.1% added.
• Titanium gives an incremental effect on the yield stress o f 0.3-
0.5 MPa per 0.1% added
The basic strengthening mechanism comes from titanium and molybdenum with
cobalt simply providing a denser martensitic matrix with a uniform distribution o f
dislocations. In the annealed alloy this provides many easy nucleation sites for the
rapid precipitation o f fine and uniformly spaced particles when the material is
subsequently aged. It has also been suggested that the presence of cobalt might lower
the solubility of molybdenum in the matrix therefore increasing the amount of
molybdenum precipitate [19] and [22].
The strengthening portion due to ageing is as a result of the precipitation o f
intermetallic compounds; Ni3Mo, Ni3Ti. The reason that the 18% Ni marageing
steels provide good toughness along with high strength levels [23] is the way the
precipitates affect dislocation movement. In most common high strength steels the
movement o f dislocations is restricted, this can cause the locking and piling up o f
dislocations leading to the generation of fracture nuclei, the precipitates in marageing
Sheffield Hallam University Ian Tatner
The 18% Ni marageing steel is a complex alloy with all the elements synergistically
combining to form a material with a greater strength than the sum of its constituent
parts. The quantities of each o f the elements added to the steel must be carefully
controlled to ensure optimum affect. The alloying elements commonly used in
marageing steels have the affect of reducing the martensite start temperature (Ms)
temperature with the exception of cobalt, Floreen [19] comments " In practical terms,
this affect of cobalt has been very helpful in allowing higher alloy contents to be
added to the steels.". Other workers have also observed the Ms elevating effect of
cobalt in marageing steels [23]. The Ms temperature of marageing steels must be
strictly controlled in order to ensure complete transformation o f austenite to
martensite on air cooling to room temperature, this transformation to martensite is
critical as the precipitates will only age harden martensite [24].
Levels o f titanium above 0.54% lead to a reduction of the Ms temperature, this means
that excessive titanium or insufficient homogenisation may result in retained
austenite. Titanium is also used to scavenge residual carbon thus preventing the
formation of molybdenum carbides that would tie up molybdenum and prevent the
formation of NisMo and hence reduce ageing.
Carbon contents above 0.03% can have deleterious effects on toughness due to the
formation o f molybdenum and titanium carbides thus reducing the amounts of
molybdenum and titanium for ageing.
Both silicon and manganese increase strength but in excessive quantities can have an
0.10)__________ M A N G A N E S E + S IU C O N ,%0.30_________0.50
CARBON SULPHUR MANGANESE + SILICON
IMPACT
TOUGHNESS L ^ STRENGTHNOTCHED
>
>-f o
77
o
0.010 0.030 0.050
SULPHUR, % C ARBON, %
Figure 3 - Effect o f Carbon, M anganese, Silicon and Sulphur on The Transverse Properties of
18% Ni M arageing Steel.
Strict control is required to prevent the reduction o f the Ms temperature o f marageing
steels to such a point that reversion to austenite can occur during ageing or such that
austenite may be retained after annealing.
2.3.2 Heat Treatment of Marageing Steels
18% Ni steels lend themselves well to production, upon air cooling after annealing
they fully transform into a soft martensite that is easily machineable and can be aged
by a simple heat treatment at 485°C followed by air cooling. The lack o f rapid
cooling removes problems o f distortion associated with quenching. The low carbon
content o f the steel means that decarburisation is not a problem thus giving similar
material characteristics at the surface or inside a component. Dimensional changes
caused by heat shrinking are minimal [20],
As previously discussed marageing steels are martensitic precipitation hardenable
steels, the martensite is formed upon cooling to room temperature. If during
Sheffield Hallam University Ian Tatner
subsequent heat treatment the material is heated above the austenite start temperature
((As) around 600°) then the martensite will revert to austenite within the matrix.
The subsequent transformation o f the reverted austenite to martensite will occur
below the martensite start temperature (Ms). The Ms is a function of the specific alloy
content, there are however some empirically based equations that are used to
calculate the temperature at which martensite formation will begin, [25].
The transformation o f austenite to martensite may also occur as a result of externally
applied deformation, this process is known as Transformation Induced Plasticity
(TRIP). The driving force for transition is controlled by the free energy difference
between the austenite and martensite states and the externally applied stress, [26]. As
the free energy between the states increases, with decreasing temperature, the level of
externally applied stress required to cause transformation reduces. Conversely as the
free energy between the austenitic and martensitic states decreases, with increasing
temperature, the level o f externally applied stress required to cause transformation
will increase. Above a certain temperature, Md, no deformation - induced
transformation is possible. The Md3o temperature is the temperature at which 50%
martensite is created for a plastic strain o f 30%, there are empirical relationships used
to find Md3o, see Equation 1 [25].
Equation 1
M im °C = 497 - 462(C + N ) - 8.1 (Mn) - 20(JV/) - 1 3 .7 ( 0 ) -1 8 .5 (Mo) - 9.2 (Si)
Strain induced transformation from austenite to martensite has been linked to
increased elongation during tensile testing by several authors, [27,28,29,31]. The
increase of elongation due to a phase transformation from austenite to martensite may
The phenomena was first explained by Bressanelli and Moskowitz in 1966, [30]. The
work hardening rate o f the austenite is insufficient to prevent necking and hence only
minimal uniform elongation is achieved before fracture. In metastable austenite ,
martensite forms in the region of necking, thus increasing the strength of the necked
portion so that it is no longer the weakest section. Deformation then occurs in
neighbouring regions. It is through this transformation that martensite reduces
necking and encourages uniform strain along the gauge length leading to greater
elongation.
Only the martensite formed in the latter stages o f tensile testing, i.e. during necking,
is considered beneficial [29]. Martensite formed prior to necking is detrimental
because of the inherently low ductility of the martensite.
Even large quantities of reverted austenite can not be seen optically, this is because
the austenite is located within the laths of the martensite in the form of very fine
needles or platelets [28]. The volume fraction of reverted austenite within a
martensitic matrix can be determined using either X-ray diffraction techniques [29]
or by correlating the magnetic response o f the material with the martensite content
[30] [31].
2.3.4 Corrosion Properties Marageing Steels
The level of corrosion resistance offered by 18% Ni marageing steels is low. Upon
exposure to the atmosphere 18% Ni marageing steels corrode uniformly. 18% Ni
marageing steels do not display passivity and usually undergo uniform surface attack
Sheffield Hallam University IanTatner
2.3.5 Stress Corrosion Cracking of 18% Ni Marageing Steels
It is generally agreed that the susceptibility to stress corrosion cracking (S.C.C.)
increases with yield stress for ferrous alloys [32], however, when testing different
alloy types at the same strength level 18% Ni marageing steels compare favourably to

![Figure 23 [145] shows experimental pit growth data plotted along with calculated pit](https://thumb-us.123doks.com/thumbv2/123dok_us/772398.583234/95.615.66.456.169.468/figure-shows-experimental-pit-growth-data-plotted-calculated.webp)

![Figure 26 [88] shows schematically the four principle ways in which a nonmetallic](https://thumb-us.123doks.com/thumbv2/123dok_us/772398.583234/101.613.117.474.77.454/figure-shows-schematically-principle-ways-nonmetallic.webp)