DEVELOPMENT AND VALIDATION OF A NOVEL UV-DERIVATIVE
SPECTROSCOPIC METHOD FOR ESTIMATION OF GLICLAZIDE
TABLETS
Dr. Usharani N*, Keerthana K, Sarika M, Revathi D, Kusuma D, Kumari VY
Maharajah’s College of Pharmacy, Phool Baugh, Vizianagaram-535002.
ABSTRACT
In the present study, derivative spectrophotometric methods have been developed and validated for the determination of Gliclazide in bulk and in tablet dosage forms. The second, third and fourth order derivative spectroscopy was applied for the estimation of Gliclazide using zero- crossing method. These methods were adopted to eliminate the spectral interference. Based on spectrophotometric characteristics of Gliclazide a signal of second (219nm), third (204nm) and fourth (213nm) order derivative spectra were found to be relevant for quantification. The literature survey showed that no analytical method was reported so far for the estimation of Gliclazide in tablet dosage form using derivative spectroscopy, though few simple UV-spectroscopic and HPLC methods exist. Hence the authors made an attempt to develop simple, accurate, sensitive, reliable and rapid derivative spectroscopic methods for the quantification of Gliclazide. The proposed methods obeyed Beer’s law in the concentration range of 2-10µg/ml and were validated as per the ICH guidelines.
KEYWORDS: Gliclazide, Derivative spectroscopy, Validation.
INTRODUCTION
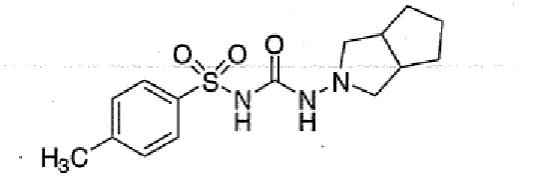
Gliclazide (GLZ), (Fig. 1) is chemically l-(hexahydrocyclopenta[c]pyrrol-2(1H)-yl)-3- [(4-methylphenyl) sulphonyl] urea. It is a second-generation sulphonyl urea oral hypoglycemic agent used in the treatment of non-insulin dependent diabetes mellitus.[1]
Volume 4, Issue 11, 1564-1572. Research Article ISSN 2277– 7105
Article Received on 08 Sep 2015,
Revised on 28 Sep 2015, Accepted on 18 Oct 2015
*Correspondence for
Author
Dr. Usharani N.
Maharajah’s College of
Pharmacy, Phool Baugh,
Fig. 1: Chemical structure of Gliclazide.
The literature survey revealed that there are only few spectroscopic and HPLC methods available for the estimation of Gliclazide in pharmaceutical formulations and to best of our knowledge, no reports were found for spectroscopic derivatisation of GLZ in bulk and in tablet dosage forms.[2-10] The present article describes UV-derivative spectroscopic methods for the determination of Gliclazide in pharmaceutical dosage forms and the results were validated as per ICH Guidelines.[11-15] The proposed methods can easily be applied to routine analysis of GLZ in tablet formulations. These methods are easy, rapid and economical for the estimation of GLZ in pharmaceutical dosage forms.
MATERIALS AND METHODS Chemicals
Authentic drug sample of Gliclazide was given as a gift sample by BMR Chemicals, Hyderabad. Gliclazide tablets were procured from the local market. Analytical grade Methanol from Fisher scientific, Mumbai was used as solvent.
Instrument
Derivatization was performed on Agilent Cary 60 UV-Vis double beam Spectrophotometer with 1 cm matched quartz cells. Other equipment used in the study were Shimadzu (BL 220H) analytical balance and ultra sonic bath (Amkette Industries-ANM USC 100).
Method Development
Solvent selection: For optimization of the method, various solvents were tested and it was found that GLZ was soluble in Methanol and0.1N NaOH. In the present investigation, methanol was used as solvent.
Preparation of Standard Solutions
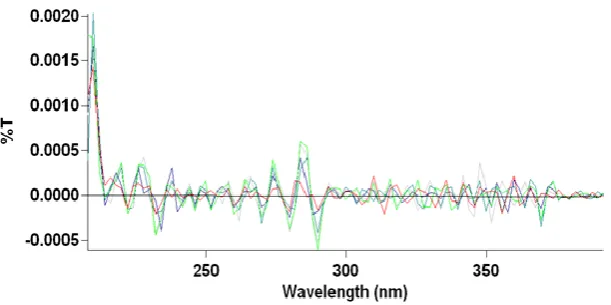
Finally, the volume was made up to 100ml with methanol. From this stock solution, working standard solutions having a concentration of 2, 4, 6, 8 and 10 μg/ml were prepared and scanned in the range of 200-400 nm against solvent blank and the absorption spectra were recorded. Then the zero order overlay spectrum obtained was derivatised to get second (Fig. 2), third (Fig. 3) and fourth (Fig. 4) order spectra.
[image:3.595.140.448.384.533.2]Fig. 2: Overlain of second order derivative spectrum of GLZ.
Fig. 3: Overlain of third order derivative spectrum of GLZ.
[image:3.595.145.451.582.734.2]Study of Derivative Spectrum
The zero order overlay spectrum of GLZ was converted into first, second, third and fourth order spectra. As the first order overlain spectrum did not show satisfactory result for the proper selection of zero crossing point of GLZ, the second, third and fourth order overlain spectra were selected to show zero crossing point (ZCP) which assisted the present method of estimation.
Derivative spectroscopic method
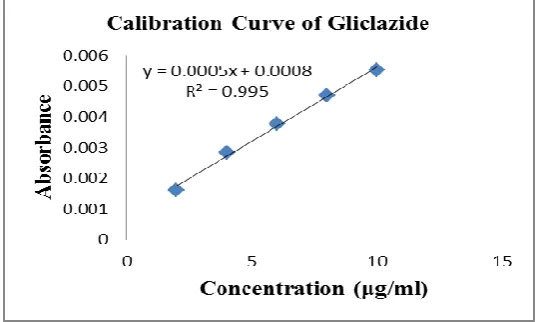
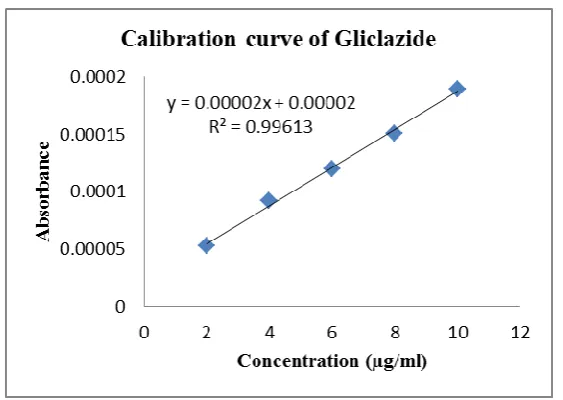
[image:4.595.163.432.377.538.2]The working standard solutions ranging from2 μg/ml to 10 μg/ml were scanned from 200- 400 nm. For the second, third and fourth order derivative spectra the ZCPs were obtained at 219 nm, 204 nm and 213 nm respectively, whose amplitudes were plotted against the corresponding concentrations to give calibration curves with good regressions as shown in figures 5, 6 and 7. The derivative spectra of GLZ obtained for the overlain spectrum in second, third and fourth order derivative spectroscopy are shown in figures 2, 3 and 4 respectively.
[image:4.595.164.433.580.740.2]Figure 5: Linearity of Gliclazide by second order derivative spectroscopy.
Figure 7: Linearity of Gliclazide by fourth order derivative spectroscopy.
Analysis of marketed formulation
Twenty tablets (Diazide, label claim 80 mg) were made into a fine powder and mixed well. An accurately weighed quantity of the powder equivalent to 10 mg of GLZ was transferred into a 10 ml volumetric flask. Sufficient quantity of methanol was added and sonicated for 20 minutes to allow complete dissolution. The volume was made up to the mark and the solution was then filtered through whatmann filter paper no.40. From the above solution 0.1ml was taken and made upto 10ml with methanol to obtain 10 μg/ml solution. It was then analyzed and percent recovery was determined as summarized in Table 1.
Table 1: Analysis of marketed formulation.
Parameters Analysis of Marketed Formulation
Second Order Third Order Fourth Order
Drug Content (%) 98.65 99.05 100.03
± S.D 0.31 0.51 0.43
% R.S.D 0.42 0.60 0.49
RESULTS AND DISCUSSION
The analytical method was validated with respect to parameters such as linearity, precision, limit of detection (LOD), limit of quantitation (LOQ) and accuracy as per ICH guidelines.
Linearity
Table 2: Results of Linearity Study.
Parameter 2nd Order 3rd Order 4th Order
Linearity 2-10 μg/ml 2-10 μg/ml 2-10 μg/ml
λmax nm 219 nm 204 nm 213 nm
Regression Equation Y=mx+c Y=0.0005x+0.0008 Y=0.000025x+0.000003 Y=0.00002x+0.00002 Correlation Coefficient R2 0.995 0.996 0.996
Slope(m) 0.0005 0.000025 0.00002
Intercept (c) 0.0008 0.000003 0.00002
Accuracy
To check the accuracy of the proposed method, recovery studies were carried out by applying standard addition method. A known amount of standard GLZ, corresponding to 80, 100 and 120% of the label claim was added to pre-analyzed sample of the tablet. The recovery studies were carried out in triplicate at each level and are shown in Table 3.
Table 3: Recovery Study Data. Sl.no Amount of tablet
powder (mg)
Amount of pure drug added (mg)
Amount recovered ± SD
%
Recovery % RSD
1. 10
8 10 12 17.95±0.060 19.94±0.09 21.94±0.131 98.70 99.20 99.04 0.33 0.45 0.59 Precision
To check the intra-day and inter-day variation of the method, solutions containing 2, 4 and 6 μg/ml of GLZ were subjected to the proposed spectroscopic method of analysis and the recoveries obtained were noted as shown in Table 4.
Limit of detection (LOD) and Limit of Quantitation (LOQ)
Table No. 4: Results of Validation Studies of the Proposed Method.
Parameter 2nd Order 3rdOrder 4th Order
Limit of detection (μg/ml) 0.165 0.132 0.525 Limit of quantitation(μg/ml) 0.5 0.4 0.9
Precision (n=3)%RSD Intra-day Inter-day 0.36 0.16 0.34 0.24 0.16 0.40 0.38 0.41 0.49 0.33 0.42 0.42 0.42 0.56 0.51 0.39 0.51 0.49 CONCLUSION
The present article describes application of second order, third order and fourth order derivative spectroscopy for the estimation of Gliclazide in tablet dosage forms. The developed method was found to be novel, simple, accurate, precise and rapid for the estimation of Gliclazide. The method is economical and do not require any sophisticated instruments contrast to chromatographic methods. Hence it can be effectively applied for the routine analysis of Gliclazide in bulk and in pharmaceutical dosage forms.
ACKNOWLEDGEMENTS
The authors are thankful to BMR Chemicals for providing standard sample of Gliclazide and we also acknowledge the laboratory facilities provided by Maharajah’s college of pharmacy, Vizianagaram for this study.
REFERENCES
1. Indian Pharmacopoeia, Government of India, Ministry of Health and Welfare, New Delhi, 2010; 2: 1416-17.
2. Dhanawade PP, Kane RN. Derivative spectrophotometric method for estimation of irbesartan in bulk drug and dosage form. International Journal of Research in Pharmaceutical and Biomedical Sciences, 2012; 3(3): 1300-05.
3. Avinash Deosarkar V, Shruti Deshpande D, Sanjay Walode G. Quantitative estimation of Carbimazole by UV Derivative Spectrophotometry in bulk drug and tablet formulation. American Journal of Pharmatech Research, 2012; 2(3): 677-85.
5. Vijay kumar N, Gurupadayya BM, Samrat Mukherjee, Sreenidhi MK. Development and Validation of zero and first order spectrophotometric method for determination of Trimipramine in bulk and pharmaceutical dosage form. Indo American Journal of Pharmaceutical Research, 2015; 5(2): 690-97.
6. Ashwini Deshpande S, Nilesh A, Shashikant Bagade B, Shirish Deshpande S. Development of novel method for estimation of Metformin HCl, Glimeperide and Voglibose in multi ingredient dosage form by derivative spectroscopy. World Journal of Pharmacy and Pharmaceutical Sciences, 2014; 3(3): 1812-23.
7. Vijya P, Dhara P, Sharav D, Dhananjay M. Development and validation of derivative spectrophotometric method for simultaneous estimation of Brimonidine Tartrate and Brinzolamide in combined dosage form. Indo American Journal of Pharmaceutical Research, 2014; 4(3): 1472-78.
8. Priyanka G, Ranjith K, Pavithra V, Sharon Elizabeth K, Sriveni K. Third Order Differential Derivative Spectroscopy of Orlistat. Indo American Journal of Pharmaceutical Research, 2013; 3(8): 6321-26.
9. Jigarkumar Patel A, Chavhan VD, Deulgaonkar YB, Mahajan MP. Spectrophotometric determination of Donepezil Hydrochloride in bulk & tablet dosage form by absorption maxima, first order derivative spectroscopy and area under the curve. Indo American Journal of Pharmaceutical Research, 2013; 3(5): 3760-66.
10.Laxmi G, Mukhopadhyay S, Durgapal S. Simultaneous estimation of Metformin and Pioglitazone by ultraviolet spectrophotometry, Indian J Pharm Sci, 2010; 72: 508-10. 11.Khanage SG, Deshmukh VK, Mohite PB, Dhamak VM, Appala Raju S. Development of
derivative spectrophotometric estimation of Atazanavir sulfate in bulk drug and pharmaceutical dosage forms. Int. J. Pharm. & Health Sci, 2010; 1(3): 149-54.
12.Smita Kumbhar T, Swapnil Jadhav D, Neela Bhatia M, Manish Bhatia S. Development and validation of derivative spectrophotometric method for estimation of Atorvastatin Calcium and Amlodipine Besylate in tablet dosage form. International Journal of Pharmacy and Pharmaceutical Sciences, 2011; 3(4): 195-97.
13.Thamake SL, Jadhav SD, Pishawikar SA. Development and validation of method for simultaneous estimation of Atorvastatin Calcium and Ramipril from capsule dosage form by first order derivative spectroscopy. Asian J. Research Chem, 2009; 2(1): 52-53.