ISSN Print: 1947-3931
DOI: 10.4236/eng.2018.107026 Jul. 6, 2018 357 Engineering
Analysis of Selecting Gated Community as
Opening Its Micro-Inter-Road Network
Lin Dong
1,2, Akira Rinoshika
2, Zhixian Tang
11Engineering Mechanical Engineering School, Shanghai University of Engineering Science, Shanghai, China 2Department of Mechanical Systems Engineering, Yamagata University, Yamagata, Japan
Abstract
The opening of gated community to expand the micro-road network in the urban traffic system is a hot topic on the urban congestion. To satisfy the de-mand of opening early choosing case, this paper proposed a comprehensive selecting framework on qualified communities and its appropriate opening time. Firstly, the static influential factors on internal road structure, boundary road structure and traffic flow are qualitatively analyzed. Then, an evaluation opening state index system based on describing accurately traffic flow state is obtained, which takes the opening factors into account at the boundary road network. In this structure, the modified fuzzy C-means (FCM) method calcu-lates the fuzzy entropy weight and range of each opening states index. Finally, the simulation results show that the proposed method is capable of selecting qualified community and the optimum opening time.
Keywords
Opening Gated Community, Opening State Index System, Fuzzy C-Means (FCM) Clustering, Fuzzy Entropy Weight
1. Introduction
Urban gated community creates a boundary separating road system from the open community outside the walls or fences. The boundary walls on the boun-dary of living quarters from each independent area, and its internal roads are not connected with the main roads of the outside traffic network. It becomes an im-portant topic to optimize the layout of urban road network and to ease the in-creasingly serious traffic congestion, and meets many problems, such as modifi-cation cost, noise pollution, safety, and so on. However, there is little research on how to select qualified gated community and how to optimize the open plan-How to cite this paper: Dong, L.,
Rino-shika, A. and Tang, Z.X. (2018) Analysis of Selecting Gated Community as Opening Its Micro-Inter-Road Network. Engineering, 10, 357-367.
https://doi.org/10.4236/eng.2018.107026 Received: June 6, 2018
Accepted: July 3, 2018 Published: July 6, 2018
Copyright © 2018 by authors and Scientific Research Publishing Inc. This work is licensed under the Creative Commons Attribution International License (CC BY 4.0).
DOI: 10.4236/eng.2018.107026 358 Engineering ning, which becomes a realistic problem and urgently to be solved, thus moti-vating the present work. Additional, it is of significance to find the best combi-nation of community to open, which is implemented maximum of urban traffic conditions improved within the limited cost and got efficiently congestion eas-ing, thus becoming objective of the present work.
In order to study the opening state evaluation of the gated communities, it is necessary to analyze the mechanism of the traffic flow congestion at the boun-dary road networks accurately. The traffic flow of a specific gated living quarter is characterized by unique, experience historical, uncertainty and complexity. Therefore, to address these shortcomings, the historical specific traffic flow data should be studied sufficiently. Washington State Transportation Department [1] released the report that the congestion evaluation degree was defined as the av-erage peak travel time. The latest Highway Capacity Manual (HCM) [2] used the level of service that was defined into six grades to evaluate road performance in the United States. However, it is maybe not appropriate in the urban traffic state in China with specific road network structure. On the other hand the trend en-tropy theory becomes an important method to study the traffic flow. Shao et al. [3] explores the principle and algorithm of entropy-maximizing model (EM model) with gravitational prior probability. Yong et al. [4] studies the entropy condition for the Lighthill-Whitham-Richards model of the fractal traffic flows described by local fractional calculus. The traffic flow of a specific gated living quarter is characterized by unique, experience historical, uncertainty and com-plexity. Therefore, to address these shortcomings, the historical specific traffic flow data should be studies sufficiently. Lozano et al. [5] proposed a recognition algorithm for road congestion levels by analyzing real-time traffic flow data based on the K-means clustering analysis algorithm. Sun [6] employed the fuzzy c-means (FMC) cluster analysis and fuzzy synthetic evaluation method to classi-fy urban traffic into six different states classification, but it is difficult to obtain the quantitative evaluation results of traffic state. Antoniou et al. [7] proposed an approach for local traffic flow state estimation and prediction based on da-ta-driven computational approaches. Many researches keep warm on the study of the historical specific traffic flow data [8] [9] [10] [11].
In this paper, the overview of framework and process of comprehensive opening evaluation model is first described. Then, the methodology of traffic flow state identification and opening evaluation at the boundary is proposed. Finally, a case study based on a simulated gated community is carried out to demonstrate the performance and applicability of the proposed method.
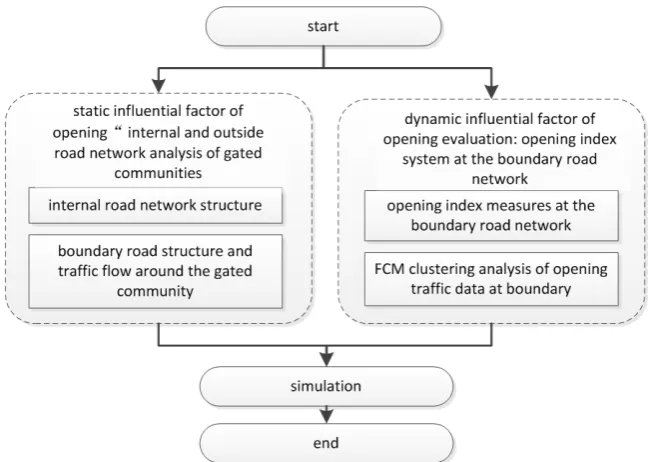
2. Proposed Framework and Process of Comprehensive
Opening Evaluation Model
DOI: 10.4236/eng.2018.107026 359 Engineering Figure 1. Framework and process of comprehensive opening evaluation model.
road structure and traffic flow. Then, the evaluation opening index system based on describe accurately traffic flow state at the boundary road network is ob-tained.
3. Static Influential Factor of Opening: Internal and Outside
Road Network Analysis of Gated Communities
3.1. Internal Road Network Structures
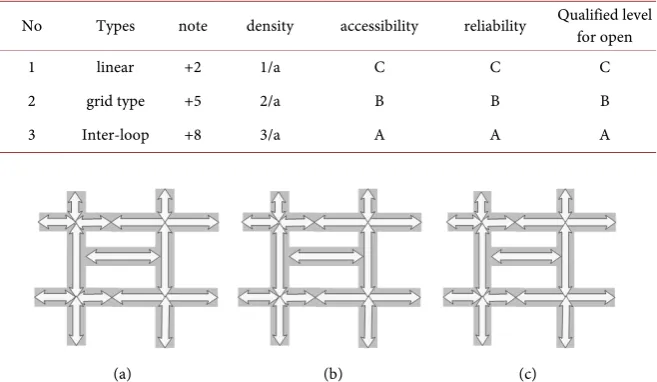
Three typical internal road network types in urban of Shanghai, as shown in Figure 2, are adopted as the study object, which are square type, grid type, and inter-loop type networks, respectively.
The road networks are compared between the three types network by eva-luating notes, density, traffic accessibility and traffic reliability, and results are shown in Table 1. Here the area is defined as a 2 and three service levels (A is the good, B is middle and the C is low) are divided.
DOI: 10.4236/eng.2018.107026 360 Engineering Table 1. Comparison and analysis of three typical types’ networks.
No Types note density accessibility reliability Qualified level for open
1 linear +2 1/a C C C
2 grid type +5 2/a B B B
3 Inter-loop +8 3/a A A A
(a) (b) (c)
Figure 2. Three typical types of internal road structures in gated communities.(a) linear type; (b) grid type; (c) inter-loop.
2) Grid type. Grid type, as shown in Figure 2(b), is typical with cross-shaped road through the entire network, which is a deformation of linear type. If open-ing this type network, fives notes are add at the network. The density of this type is 2/a, which is larger than that of linear type. Traffic accessibility also increases in response to road coverage’s increasing. But the main road also has low traffic transfer function even if it is improved comparing with the linear type, and the reliable increases with increasing the gate.
3) Inter-loop types: inter-loop type, as shown in Figure 2(c), is evolved to al-leviate the traffic problem at crossroads. The cross is changed to a loop, and in-ter group roads connect to radiation instead of loop itself. As opening this type network, it adds eight notes at the network, and the density becomes 3/a. The density and accessibility are higher than that of above two types. Because the in-ner loop is not only the role of coordinating and transferring, but also can eva-cuate traffic flow as much as radioactivity. Therefore its traffic reliability is high-er than that of above two types.
As above summary, the inter-loop type has the highest density and mul-ti-directional structure as comparing the three typical internal road networks. Therefore, based on the effect of the opening internal roads on the surrounding road capacity, the inter-loop type is most qualified to open, and the grid type is second choice and the linear type is last one.
3.2. Boundary Road Structure and Traffic Flow around the Gated
Community
DOI: 10.4236/eng.2018.107026 361 Engineering (a)
(b)
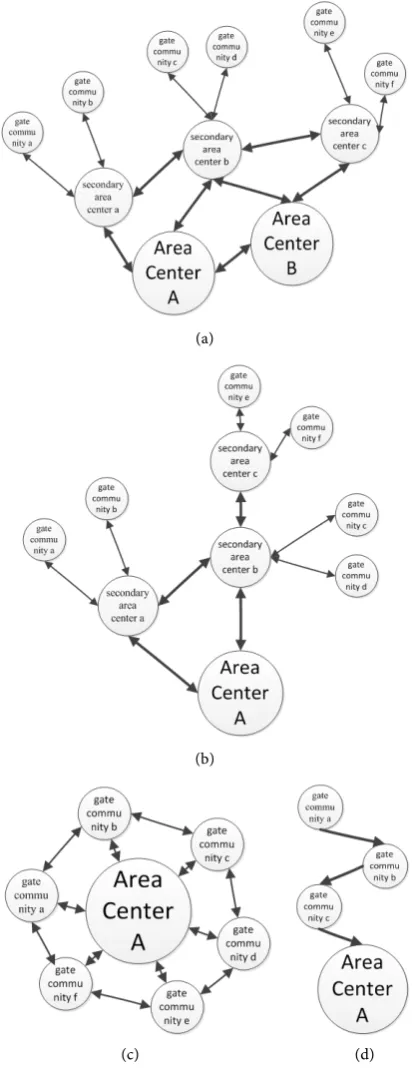
[image:5.595.270.477.72.607.2](c) (d)
Figure 3. Visualization of boundary road structure and traffic flow.(a) Grid type; (b) tree type; (c) loop type; (d) linear type.
of road structure and traffic flow, in which the color depth of the arrows represents the visualization of the traffic flow.
gather-DOI: 10.4236/eng.2018.107026 362 Engineering ing the surrounding branches, which improves the traffic conditions.
2) Grid and tree types (Figure 3(b) and Figure 3(c)): these two types locate at urban center with large traffic flow and complicated surrounding road network. So, it is also qualified to open bring with good effect.
3) Linear type (Figure 3(d)): this type network, such as a community around a highway with a typical simple structure, exhibits large traffic flow and low den-sity. Its opening only servers as a vehicle diversion. Additional, because linear type has low density and road numbers, all traffic flows are aggregated on few main roads. The intersection at the entrance and exit is extremely eased to cause congestion and vehicle queuing at arterial roads, thus bring with negative impact on traffic capacity.
4. Dynamic Influential Factor of Opening Evaluation:
Opening Index System at the Boundary Road Network
4.1. Opening Index Measurements at the Boundary Road Network
1) Volume Road Qr means the total number of vehicles running on a certain
road during a certain time period:
1 i m r s i Q Q =
=
∑
(1)where Qsi is the number of vehicles running in the ith section during the time
period and m is the number of sections on the road.
2) Road network average speed Vm refers to the average speed of all vehicles
running in the road network during a certain time period. It can be denoted as:
1 i i n r r i rn V Q V Q = ⋅
=
∑
(2) 3) Road network load degree grn is the ratio of the actual number of vehiclesrunning in the network at a certain time and the number of vehicles accommo-dated in the network under the maximum capacity. It can be estimated by the road load degree:
( )
1 i
n
rn r r
i
g w i g
=
=
∑
⋅ (3)where n is the number of roads in the network. Wr(i) is the weight of the ith
road in the given network and gri is the load degree of the ith road.
4) Boundary road network journey time delay JTDm is the rate of journey time
delayed when the actual road network average speed is lower than the free-flow speed of the network caused by the interaction between vehicles or other factors. It can be defined as follows:
1
rn f f
rn
rn f
L L
V V V
JTD L
V V
−
DOI: 10.4236/eng.2018.107026 363 Engineering where L is the total length of the network and Vf is the free-flow speed of the
road.
4.2. FCM Clustering Analysis of Opening Traffic Data at Boundary
In this paper, the fuzzy C-means (FCM) clustering algorithm is used to solve the threshold values of different traffic and opening states. Opening data and traffic flow at boundary is a continuous randomly and process, so it is necessary to build a clustering model to distinguish opening state from others.The modified FCM method calculates the fuzzy range of each index. The in-put data defines as:
{
1, 2}
, 1,2, , ,i i i in
x = x x , ,… x i= … m (5)
where m is the sample data number and n is the number index number. The so-lution steps are as follows:
[1] Initialization parameters. In this paper, the opening state data is classified into six different states: close (A), ready close (B), inform close (C), inform open (D), ready open (E) and open (F). Set the clusters number c = 6, the iterative stopping threshold ε = 10−6 and the exponential weight t = 2.5. Choose the initial cluster centers ( )0
0 K , ( )0
1
K ,…, ( )0 c
K , randomly from the xi. Set the
itera-tion number r = 0. xijis the jth sample, Ki is the ith cluster center and n is the
number of evaluation indices.
[2] Compute or update the membership matrix U(r). Set
(
)
2 1n
ij j i jl il
l
d x K x K
=
= − =
∑
− ,the distance between the ith cluster center Ki and jth sample. The matrix U(r) can
be expressed by the following.
( ) ( ) ( ) ( ) ( ) ( ) ( ) 1 2 1
1 , 0
.
1 0, ,
0 0, r t c ij r ij r k kj r ij r ij r ij d d d U
d and i j
d and i j
− − =
>
= = ≠ = =
∑
, , (6)where ( )r ij
U is the membership degree of the jth sample belonging to the ith cluster.
[3] Update the new cluster centers ( )r 1 i K + as follows: ( )
( )
( )
1 1 1 1 1,2,3 1 m t r ij j j ri m t
r ij j
u x
K i n
u
= +
=
=
∑
= …∑
, (7)DOI: 10.4236/eng.2018.107026 364 Engineering
5. Simulations
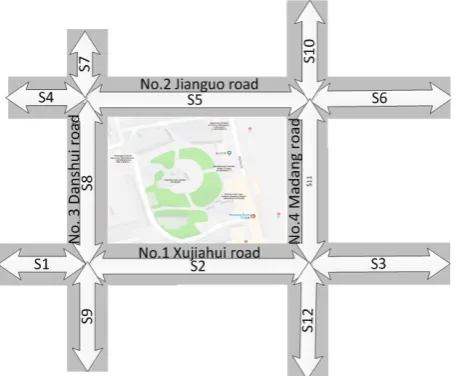
Based on the framework of the comprehensive opening evaluation model, we choose a typical simulation case to study. The simulation gated community as shown in Figure 4, is selected with inner loop type network and outer loop type road system, which is expressed in Section 3. It covers a total area of 3900 square meters, in which a total construction area has 13,000 square meters and a green-ing rate is 42%. It is mainly constructed high-rise buildgreen-ings and slab-type apart-ment.
The sample case is characterized by loop type boundary structure. It located at the key center of Shanghai urban, surrounded with advantageous trading. As shown in Figure 4, Dapuqiao business zone locates at 200 m from the west, Huaihai road locates at 300 m from the north, and a new shopping mall locates in the east. It also has a primary school, a medical school of a top university, various small business building, shops and many other facilities in a kilometer circle.
The internal road network is typical loop types and the main road is two-way single lane, as shown in Figure 4. The surrounding living quarters constructed mainly more than 20 years and internal networks are limited for huge vehicles. In addition, width road, completely split flow of people and vehicles, good view and other various advantages promoted it to be an opening community.
As to the more important boundary road network system, it blocks center area road networks in the daily urban traffic. As shown in Figure 4, it is a well-shaped road network. The east is Madang road, the north is Jiangguo east road, the west is Danshui road and the south is urban main road Xujiahui road.
[image:8.595.262.491.517.705.2]The key south and north viaducts locate at 100 m from the southwest along the Xujiahui road. As examining the historical data in the morning and evening traffic peaks, the gated community blocks the urban traffic flow seriously. In this study, we evaluate the opening threshold value to determine the optimum time to open the gated and relieve the congestion.
DOI: 10.4236/eng.2018.107026 365 Engineering As indicated in Figure 4, the boundary road network at the gated community case is equipped with four roads and a total of 12 sections, where road 1 consists of sections 1, 2 and 3, road 2 includes sections 4, 5 and 6, road 3 is divided into sections 7, 8 and 9, road 4 includes sections10, 11 and 12. Traffic information including volume, average velocity and time occupancy are obtained from the simulations, and data are selected in the case study.
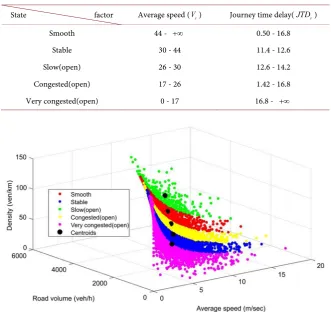
In order to obtain the fuzzy range standard in different states to verify the model result, the FCM clustering analysis is performed for boundary road net-work in this case study. The FCM results are shown in Figure 5. The FMC clus-tering model is employed to classify traffic flow data at the boundary into five different states, and the fuzzy standard range evaluation is given in Table 2.
[image:9.595.208.540.390.702.2]Furthermore, the travel time of a road network is one of the most intuitive and effective traffic flow parameters that characterizes traffic congestion. The travel time may be used as a comparative evaluation verified criterion for the discrimination of traffic conditions. Therefore, we calculate the corresponding the journey time delay value and also show in Table 2. We set the threshold val-ue of the journey time delay is 14.4. The inter-road of the gated community tends to open when the threshold value reaches 14.4. On the other hand, it closes when the threshold value is less than 14.4.
Table 2. Influent factors of fuzzy standard ranges in different states of specific gated community.
State factor Average speed (Vs) Journey time delay(JTDs)
Smooth 44 - +∞ 0.50 - 16.8
Stable 30 - 44 11.4 - 12.6
Slow(open) 26 - 30 12.6 - 14.2
Congested(open) 17 - 26 1.42 - 16.8 Very congested(open) 0 - 17 16.8 - +∞
DOI: 10.4236/eng.2018.107026 366 Engineering
6. Conclusions
A comprehensive opening framework on qualified communities and its appro-priate opening time were studied by developing an improved opening evaluation model. The opening evaluation values and its visual present were mainly inves-tigated. Simulation results indicate that the proposed analysis and model are ca-pable of capturing the real opening stated of gated communities.
Since the simulations are implemented in the comprehensive opening evalua-tion model that should be improved in the future, the mechanism of opening and congestion characteristic should be paid more attention.
Acknowledgements
This work is partially supported by the visiting foreign scholarship of 8th
“Teacher Professional Development Project” fund by Shanghai Municipal Edu-cation Commission (No.2017 32), and Teaching construction project of Shang-hai University of Engineering and Technology (No.P201701001).
References
[1] Bar-Gera, H. (2007) Evaluation of a Cellular Phone-Based System for Measure-ments of Traffic Speeds and Travel Times: A Case Study from Israel. Transportation Research Part C: Emerging Technologies, 15, 380.
https://doi.org/10.1016/j.trc.2007.06.003
[2] National Research Council (2000) Transportation Research Board, Highway Capac-ity Manual. TRB, National Research Council, Washington DC.
[3] Shao, Y.-H., Cheng, L. and Wang, W. (2005) Application of Entropy-Maximizing (EM) Model in Traffic Distribution Forecast. Journal of Transportation Systems Engineering and Information Technology, 5, 83-87.
[4] Guo, Y.-M., Zhao, Y., Zhou, Y.-M., Xiao, Z.-B. and Yang, X.-J. (2017) On the local Fractional LWR Model in Fractal Traffic Flows in the Entropy Condition. Mathe-matical Methods in Applied Science, 40, 6127-6132.
https://doi.org/10.1002/mma.3808
[5] Lozano, A., Manfredi, G. and Nieddu, L. (2009) An Algorithm for the Recognition of Levels of Congestion in Road Traffic Problems. Mathematics and Computers in Simulation, 79, 1926. https://doi.org/10.1016/j.matcom.2007.06.008
[6] Sun, X.L. (2013) Urban Road Traffic State Evaluation and Prediction: A New Scheme with Applications. Ph.D. Thesis, Beijing Jiaotong University, Beijing. [7] Antoniou, H., Koutsopoulos, N. and Yannis, G. (2013) Dynamic Data-Driven Local
Traffic State Estimation and Prediction. Transportation Research Part C: Emerging Technologies, 34, 89-107. https://doi.org/10.1016/j.trc.2013.05.012
[8] Feng, K.Y. (1992) Entropy and Component Properties of Mixed Traffie. Journal of Funan University, 19, No. 2.
[9] Min, W. and Wynter, L. (2011) Real-Time Road Traffic Prediction with Spa-tio-Temporal Correlations. Transportation Research Part C: Emerging Technolo-gies, 19, 606. https://doi.org/10.1016/j.trc.2010.10.002
DOI: 10.4236/eng.2018.107026 367 Engineering https://doi.org/10.1016/j.peva.2004.11.003