Musical Note Extraction using Self Organizing Feature
Maps
Unnikrishnan G.,
PhD
School of Computer Sciences
Mahatma Gandhi University
Kottayam, Kerala, India
ABSTRACT
Raga is the central melodic concept in Indian classical music and its automatic recognition is an important research area in computational musicology. It has several applications like indexing music, comparing and classifying music, Music Information Retrieval and pedagogy of music. Musical note extraction is the first logical step in the process of creating computational models of ragas. This paper proposes a method for extracting musical notes (swaras) from audio recordings of South Indian Classical music, based on a special kind of Artificial Neural Network known as Kohonen’s Self Organizing Feature Map (SOM).
General Terms
Computational Musicology, Raga Recognition, Musical Note Extraction, Artificial Intelligence, Neural Networks
Keywords
Pitch Estimation, Sruthi, Swara, Raga, Octaves, Relative Pitch Ratio, Self Organizing Feature Maps.
1.
INTRODUCTION
Computational musicology is an interdisciplinary research area focusing on the investigation of musicological questions with computational methods. It takes contribution from both computer science and musicology. The main objective of Computational Musicology is to represent a musical problem in terms of algorithms and corresponding data structures. The focus of research in Computational Musicology is not to study music as such, but to design methods to retrieve musical information from the acoustical signals of music recordings. Tasks involved in Computational Musicology include genre classification, raga recognition, melody extraction, artist recognition, song recommendation etc.
The most fundamental melodic concept in Indian classical music is raga. South Indian Classical Music, better known as Carnatic Music, is rich with a huge number of ragas. Carnatic music compositions (called kritis, keerthanas etc) are based on ragas. The rendering of a composition typically start with alapana (improvisation) of the raga in which the composition is made, followed by the kriti. There are thousands of Carnatic ragas.
A raga is a melodic abstraction. It can be defined as a collection of melodic phrases. These phrases are sequences of musical notes or ‘swaras’ that are often inflected with various micro-pitch alterations and articulated with an expressive sense of timing. Longer phrases are built by joining these melodic atoms together [1].
A raga can be described by properties such as: a set of notes (swaras), their progressions (arohana/avarohana), the way they are intonated using various movements (gamakaas), and their relative position, strength and duration [2]. In order to
identify ragas computationally, swara intonation, scale, note progressions and characteristic phrases are used.
Raga recognition and classification is a central topic in Indian music theory, inspiring rich debate on the essential characteristics of ragas and the features that make two ragas similar or dissimilar [3]. Automatic raga recognition is the process of using a computer to correctly identify the raga of a musical piece, live or recorded. It has tremendous potential use in various areas including Music Information Retrieval, Teaching and learning of music, Practicing music, Multimedia Databases, Interactive Composition, Accompaniment Systems etc.
For the recognition and classification of ragas, we need to first transcribe or extract the different notes constituting those ragas. Transcription of music is the process of analyzing an acoustic musical signal to obtain the musical parameters of the sounds that occur in it. It is a process of transforming an acoustic signal into a symbolic representation [4].
There are seven basic notes in Carnatic music, known as Sapta Swaras. They are Shadjam (Denoted by ‘S’ in this paper), Rishabham (R), Gandharam (G), Madhyamam (M), Panchamam (P), Dhaivatham (D) and Nishadam (N). ‘S’ is the tonic or Adhara Shadjam, based on which all other notes are derived. A series of notes, beginning with ‘S’ and ending with ‘N’, is called a Sthayi or Octave. The frequency of a note in an octave will be twice the frequency of the same note in the previous octave.
Out of the seven swaras, ‘S’ and ‘P’ are constant. They are called Achala Swaras (fixed notes). The remaining five swaras have varieties and they are called Chala Swaras (varying notes) [Table I].
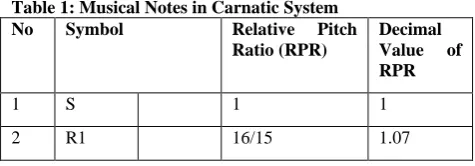
[image:1.595.310.548.678.761.2]From the study of the physics of musical scales [5], it is a known fact that the frequencies of musical notes always satisfy some ratios. This is true in the case of Carnatic music also. That is, the frequency of each of the notes ‘R’,’G’,’M’,’P’,’D’,’N’ is in a particular ratio with the frequency of ‘S’. These ratios are called the Relative Pitch Ratios (RPR). For extraction (recognition) of notes, the relative pitch of each note with respect to ‘S’ in an octave is considered [3]. A method for extraction of notes should satisfy the Relative Pitch Ratio (RPR) criteria [Table I] [5]. That is, RPR serves as a yardstick to measure the correctness of the extracted note.
Table 1: Musical Notes in Carnatic System
No Symbol Relative Pitch
Ratio (RPR)
Decimal Value of RPR
1 S 1 1
3 R2 G1 9/8 1.13
4 G2 R3 6/5 1.2
5 G3 5/4 1.25
6 M1 4/3 1.33
7 M2 17/12 1.42
8 P 3/2 1.5
9 D1 8/5 1.6
10 D2 N1 5/3 1.67
11 N2 D3 9/5 1.8
12 N3 15/8 1.88
13 S’ 2 2
Various combinations of the notes discussed above constitute different ragas in Carnatic Music. Each raga will have a unique sequence of notes with uniformly increasing frequency in the ascent (called Arohana) and decreasing frequency in the descent (called Avarohana) that determines the characteristics of the raga. In general, all music compositions and other forms of musical improvisations based on a raga must contain the notes constituting that raga. The ascent or the descent of a raga should generally contain at least 4 notes. The common forms of raga scales are pentatonic or ‘Audava’ scales containing five notes including ‘S’, hexatonic or ‘Shadava’ containing six notes and heptatonic or the complete scales called the ‘Sampurna’ ragas containing seven notes.
2.
LITERATURE STUDY ON
PREVIOUS WORKS
There have been a few attempts on computer-based recognition of ragas of both Carnatic and Hindustani (North Indian Classical Music) systems as detailed below.
Chakravorty et al. [6] proposed the machine recognition of ragas from notation. They used scale-matching for a first-level identification. Next a knowledge-based approach was used via a lexicon of phrases of each raga. The input notation was segmented into approximate arohana-avarohana sections and lexical matching, first with exact sequences and then with partial sequences, was done. Sahasrabuddhe and Upadhye [7] modeled ragas as finite automata. Their approach was to generate new samples of the ragas which sounded like compositions made by humans.
Pandey et al. [8] used hidden Markov model (HMM) for detection of Hindustani ragas in their system called ‘Tansen’. A sequence of swaras was automatically extracted from solo vocal recording by applying a heuristics driven note-segmentation technique. The individual swaras formed the states of the HMM. The HMM that best explained the observed swara sequence was the detected raga. They have
Chordia and Rae [1] used pitch-class distributions (PCD) and pitch-class dyad distributions (PCDD) to detect Hindustani ragas. The Harmonic Product Spectrum (HPS) algorithm was used to extract the pitch. The PCDs were calculated by taking histograms of the pitch tracks. The bins corresponded to each note of five octaves of a chromatic scale centered about the tonic for that segment (the tonic was identified manually, by tuning an oscillator and noting the value in Hz.). The ratios of the just-intoned scale and the tonic frequency were used to calculate the center of each bin, and the edges were determined as the log mean. The five octaves were then folded into one and the values normalized to create a pitch-class distribution.
The generation of PCDDs is more complex. First, note onsets were detected by observing the sudden changes in phase and amplitude in the signal spectrum. Then the detected onsets were used to segment the pitch-tracks into notes. Each note was then assigned a pitch-class label: first the raw pitch estimates were approximated by assigning to each the center value of the bins defined for the pitch histogram, and then the mode was calculated for each note. The label of the corresponding chromatic pitch was assigned to that note. The octaves were folded into one as with the PCDs. The pitch-classes were then arranged in groups of two (bi-grams), or in musical terms, dyads. The input set for both PCD and PCDD consisted of 17 ragas.
In the method developed by Sridhar and Geetha [10], set of swaras was estimated and compared with the templates in the database. The raga corresponding to the best matched template was selected as the class label. Their test data consisted of 30 tunes in three ragas sung by four artists, out of which 20 tunes were correctly identified by the system. Harmonic product spectrum algorithm was used to extract the pitch. The tonic was manually fed. Other frequencies in the scale are marked down based on the respective ratio with the tonic. The set of notes which are used are matched against several sets of notes stored in the database for various ragas. A similar approach based on detecting the swaras used in arohana and avarohana to find the raga is presented by Shetty and Achary [11]. Matching set of notes with stored templates is different from the pitch-class profile method because, here, the comparison is between the scale intervals, and not the pitch-class distribution.
In Indian classical music, a swarasthana (Note Position) does not correspond to a fixed frequency value. Instead, it is a region. So, although two ragas share the same scale, the precise intonation of specific notes can vary significantly. Belle et al. [12] has used this feature to differentiate ragas that share the same scale intervals. They evaluated the system on 10 tunes, with 4 ragas evenly distributed in 2 distinct scale groups and showed that the use of swara intonation features improved the accuracies achieved with straightforward pitch class distributions.
these connections. Learning is accomplished by adjusting these strengths to cause the overall network to output appropriate results. The coefficients of connectivity are referred to as weights. Some of the neurons interface with the real world to receive its inputs (the input layer) and other neurons provide the real world with the network’s outputs (the output layer). All the rest of the neurons are hidden form view (the hidden layer(s)). The learning ability of a neural network is determined by its architecture and by the algorithmic method chosen for training. In supervised learning, the system is trained by giving it the correct answers to the questions. The system is taught the right way to do something. In unsupervised learning, no information is given to the system. Here, the objective is not to learn the correct answer, but to classify the inputs into categories as best as possible.
A popular approach to unsupervised learning is competitive learning, where neurons fight among themselves to decide what category a particular input belongs to. The neurons closest to the input are the strongest, and they will ultimately win the contest. The learning rule for this network only changes the weights going from the input to the winner neuron. The weights are adjusted so that this input makes the winner neuron even stronger than it was. Thus the weights are moved a little away from their previous settings and towards the input values. The degree to which this shift occurs is controlled by a learning-constant [15].
In order that neurons fight for supremacy, the neurons usually have inhibitory weights among themselves. A kind of lateral inhibition which only applies to the nearest neighbours of the neuron, results in a dynamic known as feature mapping. The basic idea here is to build an architecture where a neuron will help its nearby friends more than neurons further away. The networks then not only learn to cluster inputs into categories, but categories that are spatially related to each other are clustered by neurons closer to one another. This spatial distribution is called a Self-Organizing Map (SOM). Teuvo Kohonen [16] has developed a method, known as Kohonen’s algorithm, to perform the job of spatially dividing up the input data into clusters in the output.
Kohonen’s algorithm creates a vector quantizer by adjusting weights from N common input nodes to M output nodes arranged in a two dimensional grid. Output nodes are extensively interconnected with many local connections. Continuous-valued input vectors are presented sequentially in time without specifying the desired output. After enough input vectors have been presented, weights will specify cluster or vector centres that sample the input space such that the point density function of the vector centres tends to approximate the probability density function of the input vectors. In addition, the weights will be organized such that topologically close nodes are sensitive to inputs that are physically similar [17]. Output nodes will thus be ordered in a natural manner. The algorithm that forms feature maps requires a neighbourhood to be defined around each node. This neighbourhood slowly
decreases in size with time. The end result is that the nodes on the grid become ordered.
4.
SOM AS A TOOL FOR MUSICAL
NOTE EXTRACTION
The choice of Artificial Neural Networks as a method for identification of musical notes is justified by the human analogy. Music, whether be it for listening, enjoying, composing or understanding, is considered to be one of those defining qualities that distinguish humans from machines. Human beings learn by training of the neurons present in the brain. The same also applies to human recognition of music: humans train themselves to identify music by repetitively exposing themselves to music and trying to extract patterns that would represent the information contained therein. Thus the identification of musical notes and eventually of raga is a form of pattern recognition - pattern recognition in music. Hence artificial neural networks present a right kind of methodology for the task.
The model of identification that is proposed in this paper is based on Kohonen’s Self Organizing Feature Maps. It employs unsupervised learning. The choice of unsupervised learning is because the classification of various patterns is obviously an unsupervised process. This is also how humans learn to identify music: a student of music initially is not sure how a piece of music will finally be classified as having a particular set of notes. The process of differentiating between notes is guided mainly by his/her ability to extract and recognize patterns and such ability is usually developed over time with practice. The identification process could thus be described as unsupervised.
5.
THE PROPOSED METHOD
5.1
Feature Extraction
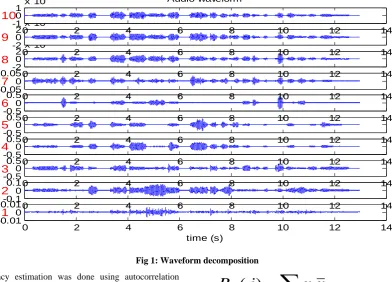
Fig 1: Waveform decomposition
The frequency estimation was done using autocorrelation method. If we take a signal x, for instance a piece in raga ‘Bilahari’ whose wave form is shown in Fig.2, then the autocorrelation function is computed as
j n
n n
xx
j
x
x
R
(
)
0 2 4 6 8 10 12 14
-0.010 0.01
time (s)
1
0 2 4 6 8 10 12 14-0.10 0.1
2
0 2 4 6 8 10 12 14-0.50 0.5
3
0 2 4 6 8 10 12 14-0.50 0.5
4
0 2 4 6 8 10 12 14-0.5 0 0.5
5
0 2 4 6 8 10 12 14-0.50 0.5
6
0 2 4 6 8 10 12 14-0.050 0.05
7
0 2 4 6 8 10 12 14-20 2x 10
-3
8
0 2 4 6 8 10 12 14-20 2x 10
-3
9
0 2 4 6 8 10 12 14-1 0 1x 10
-3 Audio waveform
10
0 2 4 6 8 10 12 14
-0.8 -0.6 -0.4 -0.2 0 0.2 0.4 0.6
Audio waveform
am
pl
itu
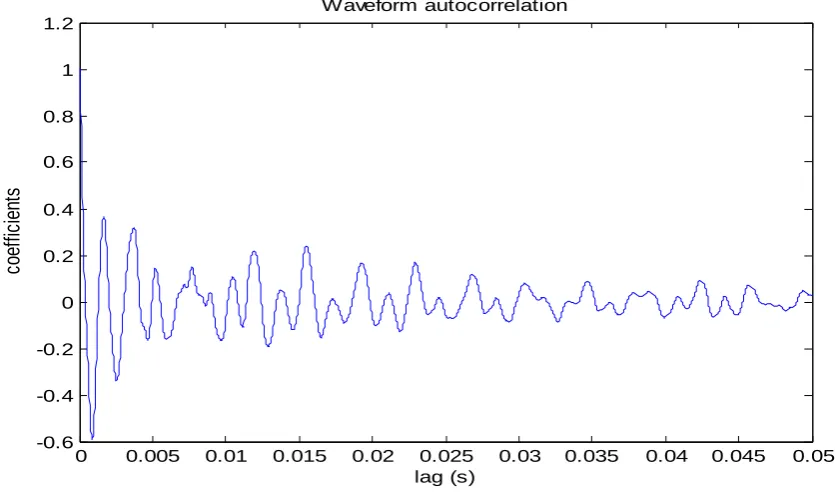
[image:4.595.80.494.359.662.2]Fig 3: Resultant waveform of autocorrelation computation
Hence when the lag j corresponds to a period of the signal, the signal is shifted to one period ahead, and therefore is exactly superposed to the original signal. Then the summation gives very high value, as the two signals are highly correlated.
5.2
Musical Note Extraction using SOM
This is a two-level process.Level I: The structure of Level I is based on Kohonen’s SOM model. It consists of 25 neurons arranged in a linear topology representing the 25 probable musical notes in three octaves within the range of a normal human singer, that is, notes from lower ‘P’ to upper ‘P’. This layer acts as the input layer. The input is the estimated frequencies obtained through the process described in Section 5.1. The neurons whose frequencies are closest to the dominant frequencies in the piece will have the maximum values of activation levels and will thus be declared the winners. However the winners may not always be sufficiently close to the actual dominant frequencies. Hence the winner neurons are allowed to modify some of their neighboring neurons in the hope of reaching sufficiently close to the actual frequencies. The neurons that constitute the neighborhood of the winners satisfy a criterion based on their frequency, that is, the difference in the frequency of the winner and of each neighbor falls within a threshold. The neighborhood neurons are modified so that their frequencies come closer to that of the winner. The activation levels of these modified neurons are recalculated and again a winner is chosen. The process of modifying the
neighborhood is repeatedly performed till the frequencies of the two extreme neighbors of the winner do not differ a lot.
The effect of this kind of modification is that the winner strengthens its neighborhood while strengthening itself in return. As a result, a set of neurons of Level I tune themselves a particular range of frequencies that correspond to a note. Minor variations in the frequency of the note being sung do not change the part of Level I that wins for the particular note. This leads to a feature map in Level I with each note causing only a particular set of neurons to win. The neurons of Level I thus cluster around some particular notes.
Thus the SOM is trained to converge to most prominent frequencies thereby eliminating extreme frequencies and zero values from the input. This results in a more pure data to be processed by the second level.
Level II: The input from level I is further processed to find the best-matching units for the target vector. The target vector is a 25x1 matrix containing the ideal frequencies of the probable musical notes in three octaves. The SOM returns the best matching units along with the quantisation errors (Fig 4). The notes with the quantisation errors below a threshold value are taken to be the notes constituting the raga contained in the input musical piece. The occurrence of a note may be in any of the three octaves and hence octave folding is applied to merge the occurrences of notes in three octaves into one octave thereby getting a fixed frequency value for a note. 0 0.005 0.01 0.015 0.02 0.025 0.03 0.035 0.04 0.045 0.05 -0.6
-0.4 -0.2 0 0.2 0.4 0.6 0.8 1 1.2
Waveform autocorrelation
lag (s)
co
ef
fic
ie
nt
Fig 4: Quantisation error graph
6.
RESULTS
[image:6.595.309.549.367.650.2]The proposed method successfully picked up the constituent notes and thereby identified four ragas, namely, ‘Sankarabharanam’, ‘Hamsadhwani’, ‘Mayamalavagowla’ and ‘Mohanam’. The samples used for testing were recordings of eminent artists of Carnatic music. The recordings were of varying audio quality. The method proved successful even with low quality recordings. This is an indication that the method can be adapted to real-time performances. Tables 1-4 show the results.
Table 1. Raga: Sankarabharanam
(SR2G3M1PD2N3S’: S’N3D2PM1G3R2S)
Note Extracted Frequency (in Hz)
Computed RPR
Ideal RPR
S 129 1 1
R2 145 1.12 1.125
G3 161 1.25 1.25
M1 170 1.32 1.33
P 197 1.52 1.5
D2 214 1.66 1.67
[image:6.595.48.287.431.589.2]N3 243 1.88 1.875
Table 2. Raga: Hamsadhwani
(SR2G3PN3S’: S’N3PG3R2S)
Note Extracted Frequency (in Hz)
Computed RPR
Ideal RPR
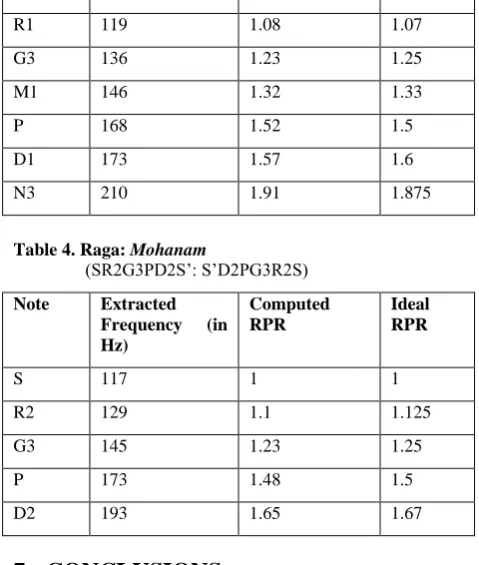
Table 3. Raga: Mayamalavagowla
(SR1G3M1PD1N3S’: S’N3D1PM1G3R1S)
Note Extracted Frequency (in Hz)
Computed RPR
Ideal RPR
S 110 1 1
R1 119 1.08 1.07
G3 136 1.23 1.25
M1 146 1.32 1.33
P 168 1.52 1.5
D1 173 1.57 1.6
N3 210 1.91 1.875
Table 4. Raga: Mohanam
(SR2G3PD2S’: S’D2PG3R2S)
Note Extracted Frequency (in Hz)
Computed RPR
Ideal RPR
S 117 1 1
R2 129 1.1 1.125
G3 145 1.23 1.25
P 173 1.48 1.5
D2 193 1.65 1.67
7.
CONCLUSIONS
0 5 10 15 20 25
[image:6.595.47.289.434.728.2]and Mohanam (pentatonic). The results shows the effectiveness of the proposed method for musical note extraction and thereby the recognition of the underlying raga of the musical piece under study. As future work, testing of the method on more ragas and recognition of notes for Vakra (kinky or irregular) ragas is proposed.
8.
REFERENCES
[1] Chordia, P., Rae, A. Raag Recognition using Pitch-Class and Pitch-Class Dyad Distributions. Proceedings of the 8th International Conference on Music Information Retrieval (ISMIR), Vienna, Austria, 2007
[2] Koduri, G.K., Miron M., Serra J., Serra, X. Computational approaches for the understanding of melody in carnatic music. 12th International Society for Music Information Retrieval Conference (ISMIR 2011), Florida, USA
[3] Krishnaswamy, A. On the Twelve Basic Intervals in South Indian Classical Music. Audio Engineering Society Convention Paper, 115th Convention, 2003 October 10-13, New York
[4] Klapuri, A.P. Automatic Music Transcription as We Know it Today. Journal of New Music Research. 2004, Vol. 33, No. 3
[5] Lapp, D.R. The Physics of Music and Musical Instruments. Wright Center for Innovative Science Education, Tufts University, Medford, Massachusetts
[6] Chakravorty, J., Mukherjee, B., Datta, A.K. Some studies on machine recognition of ragas in Indian classical music. Journal of Acoustic Society of India, Vol. XVII(3&4)
[7] Sahasrabuddhe, H.V., Upadhye, R. On the Computational Model of Raag Music of India. Workshop on AI and Music: 10th European Conference on AI, Vienna
[8] Pandey, G., Mishra, C., Ipe, P. Tansen: A system for automatic raga identification. Indian International Conference on Artificial Intelligence, Hyderabad, India, 2003
[9] Sinith, M., Rajeev, K. Hidden Markov model based recognition of musical pattern in South Indian Classical Music. IEEE International Conference on Signal and Image Processing, Hubli, India, 2003
[10]Sridhar, R., Geetha, T. Raga identification of Carnatic music for Music Information Retrieval. International Journal of Recent Trends in Engineering, Vol. 1(1), 2009
[11]Shetty, S., Achary, K.K. Raga mining of Indian music by extracting Arohana-Avarohana pattern. International Journal of Recent Trends in Engineering, Vol. 1(1), 2009
[12]Belle, S., Joshi, R., Rao, P. Raga identification by using Swara intonation. Journal of ITC Sangeet Research Academy, Vol. 23, 2009
[13]Koduri, G.K., Gulati, S., Rao, P., Serra, X. Raga Recognition based on Pitch Distribution Methods. Journal of New Music Research, Vol. 41(4), 2012
[14]Lippmann, R.P. An Introduction' to Computing with Neural Nets. IEEE ASSP Magazine, April, 1987
[15]Wasserman, P.D. Neural Computing: Theory and Practice. Van Nostrand Reinhold, Newyork
[16]Kohonen, T. Self-Organization and Associative Memory. Springer-Verlag, Berlin (1989)
[17]Mayer, R., Frank, J., Rauber, A. Analytic Comparison of Audio Feature Sets using Self-Organizing Maps. Workshop on Exploring Musical Information Spaces, 2009, Greece