Abstract—Collaborative planning, forecasting and
replenishment (CPFR) coordinates the various supply chain management activities including production and purchase planning, demand forecasting and inventory replenishment between supply chain trading partners. This study proposes a systematic way of analyzing CPFR supporting factors using fuzzy cognitive map (FCM) approach. FCMs have proven particularly useful for solving problems in which a number of decision variables and uncontrollable variables are causally interrelated. Hence the FCMs of CPFR are created to show the relationships between the factors that influence on effective implementation of CPFR in the supply chain.
Index Terms—Collaborative planning, forecasting and
replenishment, fuzzy cognitive map, information sharing, decision synchronization, incentive alignment.
I. INTRODUCTION
As companies move towards increased global competitiveness, supply chains face new issues and challenges. These include increasing demands to reduce costs, increase quality, improve customer service and ensure sustainability of supply chain. The supply chain environment is characterized by globalization, increased customer responsiveness, channel integration and advances in information and communication technologies.
Businesses with a supply chain strategy require integration, cooperation and collaboration, which in turn demand aligned objectives, open communication, sharing of resources, risks and rewards. Firms build capabilities by reflecting on the value of the work performed and applying integrative principles that allow multiple processes to be synchronized. Consequently, part of this process involves supplier evaluation and building relationships with suppliers, which changes financial performance. Similarly, inter- organizational relationships have become increasingly important in ensuring business success and a competitive advantage. Hence, both practitioners and academics are increasingly interested in supply chain collaboration [6], [13]. Supply chain collaboration is defined here as the ability to work across organizational boundaries to build and manage unique value-added process to better meet customer
1 Manuscript received March 23, 2009. This work was financially
supported by Galatasaray University Research Fund.
Gülçin Büyüközkan is with the Industrial Engineering Department, Galatasaray University, Istanbul, 34357, Turkey (phone: +90.212.227.4480;
e-mail: [email protected] ).
Zeynep Vardaloğlu is with the Industrial Engineering Department,
Galatasaray University (e-mail: [email protected] ).
Orhan Feyzioğlu is with the Industrial Engineering Department,
Galatasaray University (e-mail: [email protected] ).
needs.
Collaborative planning, forecasting and replenishment (CPFR) is one of the collaborative strategies in supply chains. It is the business practice that tries to reduce supply chain costs by promoting greater integration, visibility and co-operation between trading partners [1]. Since CPFR is a relatively new initiative, little research has been carried out on its use, though it apparently has had positive effects on supply chain performance [10]. Hence the aim of this study is to analyze important factors of CPFR using fuzzy cognitive map (FCM) approach to support its implementation effectiveness. FCMs are capable of modeling scenarios described in terms of significant events (or concepts) in the scenario and their cause-effect relationships. One of the most useful aspects of the FCM is its potential for use in decision support as prediction tool [16]. Given an initial state of a system, represented by a set of values of its constituent concepts, a FCM can stimulate its evolution over time to predict its future behavior. These features make FCM a very attractive tool for CPFR important factors analysis. To our knowledge, there is no previous study that uses FCMs for CPFR supporting factors assessment. We focused on information sharing sub-system particularly. The strengths of all relations between factors are determined by the expert. According to this expertise, we searched how the factors were influenced in information sharing sub-system when a slight change in firm’s technological capacity level occurs and the dynamical behavior is investigated.
This paper is organized as follows. Section 2 gives an overview of FCMs. This is followed in Section 3 by the detailed description of our model for CPFR. Experimental results are presented in Section 4. Dynamical behavior of information sharing FCM model is explained in Section 5, before the paper is concluded in Section 6.
II. FUZZY COGNITIVE MAP
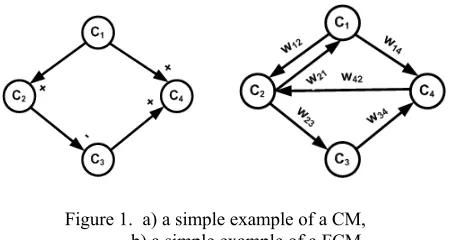
Cognitive maps (CMs) were introduced by Axelrod [2] in the 1970s. CMs are signed diagraphs designed to represent the causal assertions and belief system of a person (or group of experts) with respect to a specific domain, and use that statement in order to analyze the effects of a certain choice on particular objectives. Two elements are used when realizing CMs: concepts and causal belief. Concepts represent the variables that describe the belief system of a person, while the causal belief consists in the causal dependencies between variables. Such variables can be continuous, ordinal or dichotomous [2].
In signed cognitive maps, each relationship is linked to a sign that represents the sense of casual influence of the cause variable on the effect variable. Figure 1.a) shows a graphical
A Fuzzy Cognitive Map Approach for Modeling
CPFR Supporting Factors
representation of weighted cognitive maps in which the nodes are variable concepts and the edges are causal connections. If the edge from node C1to node C2 is positive, an increase or decrease in C1causes a change in the same direction in C2 . If the relationship is negative, the change that the effect variable undergoes is in the opposite direction. With cognitive maps, only centrality of concepts, and directions of the effect of one concept to another can be analyzed.
Figure 1. a) a simple example of a CM, b) a simple example of a FCM
Fuzzy cognitive map is a well-established artificial intelligence technique that incorporates ideas from artificial neural networks and fuzzy logic. FCMs were introduced by Kosko [16] to extend the idea of cognitive maps by allowing the concepts to be represented linguistically with an associated fuzzy set rather than requiring them to be precise. In order to describe the degree of the relationship between concepts it is possible to use a number between [0,1] and [-1,1], or use linguistic terms, such as “often”, “always”, “some”, “ a lot”, etc. The representation (Fig. 1.b) illustrates different aspects in the behavior of the system showing its dynamics [16] and allowing systematic causal propagation (e.g. forward and backward chaining). The interconnection strength between two nodes Ci and Cjis wij
∈
[-1,1] in this study.There are three possible types of causal relationships among concepts:
• wij > 0, positive causality between concepts Ci and Cj • wij < 0, negative causality between concepts Ci and Cj • wij = 0, no relationship between concepts Ciand Cj
The value of each concept is calculated, computing the influence of other concepts to the specific concept, by applying the following calculation rule:
⎟ ⎟ ⎟
⎠ ⎞
⎜ ⎜ ⎜
⎝ ⎛
+
=
∑
= ≠
+ N
j i j
ji k j k
i k
i f A A w
A
1 ) ( )
( )
1
( (1)
where Ai(k)being the value of concept Ciat iteration step k,
Aj(k-1) the value of the interconnected concept Cjat iteration
k-1,wijthe weighted arc from Ci and Cjand f a threshold function. Two threshold functions are usually used. The unipolar sigmoid function where λ > 0 determines the steepness of the continuous function f(x)=1/(1+e-λx). When concepts can be negative and their values belong to the interval [-1, 1] as in our case, function f(x)= tanh(x) is used. The initial values of each of the concepts of the input vector and the weighted arcs are set to a specific value based on the expert’s beliefs. Thereafter, the system is free to interact. This interactions continues until the model:
• Reaches equilibrium at a fixed point, with the output values, being decimals in the interval, stabilizing at fixed numerical values.
• Exhibits limit cycle behavior, with the output values falling in a loop of numerical values under a specific time period.
• Exhibit a chaotic behavior, with each output value reaching a variety of numerical values in a nondeterministic, random way.
III. FCM MODEL OF CPFR
A. CPFR Main Factors
Based on a detailed literature survey, the factors which influence CPFR success are determined.
A few suppliers or retailers may make deal and share information that can give harm to a partner. Thus, long term supplier partnership is trustworthy and reduces the potential for cullusive activities [3], [10]. It provides confidence among the partners and thus, collaboration between organizations in the same supply chain will be sustained [3], [11].Long term objective for organizations is also supporter to develop trust. Trust is an important component of alliances, and several studies confirm the importance of trust and coordination in cooperative relationships [19], [24], [25], [30], [31].
For success collaborative forecasting, organizations must establish their own internal forecasting process which are consistent, systematic and appropriate. Because it positively impact performance through decreased operations costs, improved customer service, increased sales and reductions inventory [20]. However, Joint decision making is also needed in the area of forecasting [3]. Most organizations develop forecasts based on orders receiving from their own customers and upon historical data. If this situation is considered in supply chain, there exists dramatic problems in demand that occurs in functionally oriented supply chains because of the fact that there are multiple forecasts developed trading partners and each with a small degree of error [15]. Organizations in a supply chain must have the same performance measures to be success in collaboration [3]. If not, the performance measures in place produce conflicting both internally and externally. If has, it helps organizations to improve overall performance [15]. By sharing performance metrics with customers and suppliers bottlenecks in the supply chain (inventory stockpiles and process gaps) can be identified.
purchasing, manufacturing, logistics), but also needs to include marketing [15] and R&D activities [9]. The other crucial factor is organizational readiness [1]. While the previous supply chain models used simple tools like spreadsheets in order to satisfy inventory levels and to manage replenishment planning, mature supply chain of today uses advanced planning software that employ cross-functional teams to serve for the same goal. Even latest organizations are characterized by robust process including consensus-based forecasting [1].
Understanding CPFR processes, the implications of change, potential benefits of CPFR and the importance of supporting such initiatives can be implemented in a company through the education of the personnel which is the another success key factor [1], [20]. From both an internal and external viewpoint, a culture of openness and honesty is needed too [33]. By the way it is provided trust, respect and commitment as a result of improved certainty and reliability. Good manager makes employees easier to be accustomed to sharing information with colleagues, customers and suppliers, or even making joint decision [15]. Segmentation is the other success factor. It is needed to collaborate with a small number of strategically important customers and suppliers [34]. Strategic elements including intra-organizational support, the corporate focus, demonstrating the business case and the role of the technology are to sustain the collaboration [3]. Participants in the collaboration must commit resources. Commitment to a relationship is most frequently demonstrated by committing resources to the relationship, which may occur in the form of an organization’s time, money, facilities, etc [24]. Several studies have found a relationship between resource commitment and the joint action or continuity between parties within inter-organizational relationships [12], [24], [35]. Intra-organizational support in the shape of top management support [15, 20] and in terms of gaining the supports of other parts of the organization e.g. purchasing and manufacturing is needed for a process focus for collaboration [15]. Technology connectivity can make collaboration closer to real-time basis for exchanging and utilizing shared information [15].
Communication processes and the sharing of information are fundamental to most aspects of organizational functioning. Two aspects of communication behavior that address the extent to which the information exchanged is effective in an alliance include information sharing, and the level of information quality and participation. A clear and broad lines of communication is also required [23], [33]. Establishing regularly scheduled meetings with the purpose of discussing the forecast is suggested [20].The transparency and quality of information flows aspects as the accuracy, timeliness [20], adequacy [3], and credibility plays an important role in supply chain collaboration [14]. Information participation refers to the extent to which partners engage jointly in planning and goal setting [22]. These two information attributes are closely related in a strategic supplier alliance and are critical in enabling both parties to coordinate their activities. For instance, the purchasing executive must commit to providing better and more accurate forecasts of requirements to suppliers, in order
to allow them to plan their available capacity more effectively [5], [27].
B. Conceptual Models For CPFR and Sub-systems
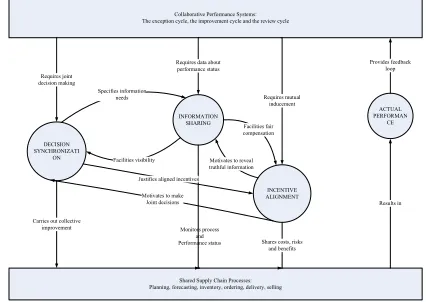
Based on the factors identified in the previous part, we develop some conceptual models for CPFR and sub-systems. Figure 2 represents a conceptual model for supply chain collaboration, in other words, a general model for CPFR [29].
We focus in this study three sub-systems of CPFR: Information sharing, decision synchronization and incentive alignment. These systems are required to facilitate the chain members engaging in a cross-organizational cooperation that enables them to realize better overall supply chain performance [29].
Collaborative Performance Systems: The exception cycle, the improvement cycle and the review cycle
DECISION SYNCHRONIZATI
ON
INFORMATION SHARING
INCENTIVE ALIGNMENT
ACTUAL PERFORMAN
CE
Shared Supply Chain Processes: Planning, forecasting, inventory, ordering, delivery, selling Requires joint
decision making
Requires data about performance status
Requires mutual inducement
Provides feedback loop
Specifies information needs
Facilities visibility
Facilities fair compensation
Motivates to reveal truthful information
Results in
Shares costs, risks and benefits Carries out collective
improvement
Justifies aligned incentives Motivates to make
Joint decisions
[image:3.612.321.534.210.361.2]Monitors process and Performance status
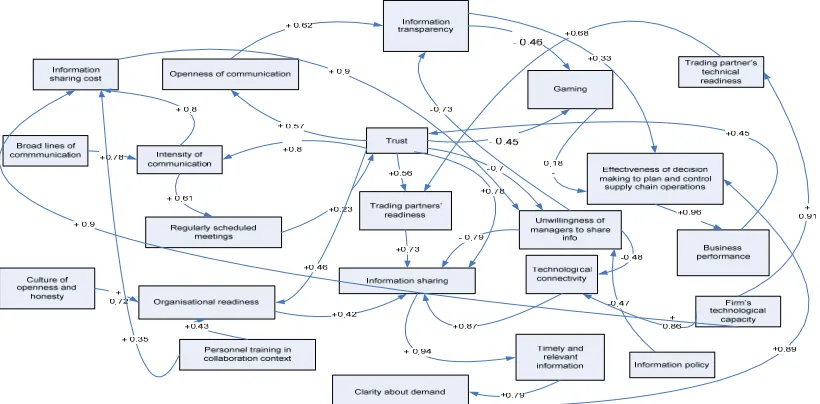
technological readiness depends on firm’s technological capacity. But to have an enough technological capacity requires investment that means cost. Intensity of communication is also another costly. In the map another loop includes openness of communication, information transparency, trust and gaming. If partners trust each other, they tend to communicate openly and it increases information transparency. Also, if trust between partners and information transparency are high, it decreases gaming. The main concepts and the relations between these concepts are showed in Figure 3.
Decision synchronization is operationalized as the degree to which the chain members become in joint decision making at the planning and operational levels. These joint decisions are used to guide logistics processes inside an individual chain member firm. The planning context integrates decisions about long-term planning and measures such as selecting target markets, product assortments, customer service level, promotion, and forecasting. The operational context integrates order generation and delivery process that can be in the forms of shipping schedule and replenishment of the products to the stores. Decision synchronization encourages the chain members that all decisions work toward a common goal of serving end customers. It reduces the gap between delivery requirements and actual delivery, thereby improving customers’ perceptions of fulfillment performance [26]. All these improvements have positive effects on the business performance. The causal relationship is represented in Figure 4.
Incentive alignment refers to the degree to which chain members share costs, risks, and benefits. The costs such as administration and technology need to be shared fairly amongst the chain members to sustain the commitment of each party to the collaborative efforts. Moreover, chain members commit to the collaborative efforts if they can realize benefits. Benefits of collaboration include both commercial gains such as increased sales, performance improvement, lowered inventory costs [7]. Risk sharing among the chain members, shared costs and benefits make the relationship strength in supply members. Collaboration implies working more closely with a shared vision and trust [17] to align processes and capacities of participants in collaborative efforts. Setting and applying appropriate incentives such as having common supply chain vision and objectives motivate the chain members to take decisions that align with the achievement of supply chain profitability [28]. Documented business, principles, policies and procedures by sharing in technological environment facilities defining roles of individual supply chain members and this improves entire business performance of shared supply chain processes. . The causal relationship is represented in Figure 5.
IV. APPLICATION
In the first stage, the factors and the relationships between factors are identified through the literature review and refined by the industrial experts. In the second stage, each expert, still have to supply causal connections and sign of causal connections for each of the factors identified in the first stage. After their level of agreement, FCMs are developed and evaluated the factors that affect the success of
CPFR. Each expert weights the relation of all causal connections. The union of different opinions is obtained with this formula;
∑
==
Kk k ij k
ij
v
w
w
1 (2) where Wij is the global FCM weight, is the credibility weight of expert k and Wijk is the single FCM weight vk of expert k. Such an example, we give the details of the information sharing sub-system in this section. The strength values of the causal relationships between the concepts are determined by one of the expert of CPFR. There are 22 factors in the information sharing map. The system is free to interact until 150 iterations. It is wanted to investigate what a positive change for factor “firm’s technological capacity” would affect the system. Thus, A15(0) is 0.5 and the others are 0. It means that the state vector is as follows: A=[0, 0, 0, 0, 0, 0, 0, 0, 0, 0, 0, 0, 0, 0, 0.5, 0, 0, 0, 0]. After 150 iterations the answer matrix is like that: K=[0.3 0.89 0 0.93 0.9 0 0.86 0.91 0.95 0.88 0.74 -0.78 0.97 0.95 0.1 -0.89 0.59 0 0.93 0.94 0 0.94].The 0.5 increase in the factor “firm’s technological capacity” highly positively affects the most “effectiveness of decision making to plan and control supply chain operations” factor with 0.97. The other factors are information transparency (0.3), openness of communication (0.89), intensity of communication (0.93), regularly scheduled meetings (0.9), organizational readiness (0.86), trust (0.91), trading partners’ readiness (0.95), unwillingness of managers to share information (0.74), the business performance (0.95), trading partners’ technological readiness (0.59), clarity about demand (0.93), timely and relevant information (0.94) and information sharing cost (0.94). But this is also affect negatively gaming (-0.89) and technologic connectivity (-0.78). Broad lines of communication, culture of openness and honesty, personnel training and information policy are not affected when a slightly positive change for factor “trust” occurs.
V. DYNAMIC BEHAVIOR OF FCM MODEL
Examining the behavior of simulated system, in which the system can present behaviors such as stabilizing to a fixed state, entering a limit cycle or a chaotic attractor, over time can be an approach in dynamic analysis of FCM. These possible behaviors can provide considerable information for the analysis.
Various “what-if” scenarios can be practice after inserting the necessary information to the simulation program. Because of the page limitation, only for information sharing sub-system is given to show the usefulness of the approach. We searched the 22 concepts of the information sharing model and the causal relationships that exist among these concepts. In our scenario, we investigate the case where the firm’s technological capacity is high. As investing in technology can result in high cost in the budget, a firm would prefer to evaluate how high level before deciding to invest in that technology. To reflect this, we set the different activation level of this concept as scenarios and the dynamical behaviors of the model are shown in figures.
Figure 3. The CM of information sharing
Figure 4. The CM of decision synchronization
[image:5.612.97.519.509.708.2]there is no considerable effect on the other concepts when firms makes this factor a little bit high. Figure 6 shows the behavior.
[image:6.612.90.277.69.605.2]In the other scenarios, the activation level is taken to 0.35 and 0.5 respectively. At first the systems are chaotic but then, it can stabilize. In both scenarios, the results are in the same values and are improved. The only difference between the scenario 2 and 3 is deal with how long it takes to increase and reaches this results. Figure 7 and Figure 8 shows the dynamic behavior of these scenarios.
[image:6.612.316.540.102.724.2]Figure 6. Simulation of the first scenario
Figure 7. Simulation of the second scenario
Figure 8. Simulation of the third scenario
VI.CONCLUSION
Many firms recognize the supply chain efficiencies and competitive advantage to be gained by implementing CPFR. Research shows that the adoption and utilization of CPFR in supply chain are limited and inefficient. Given the impact and benefits of CPFR, it is essential to ensure their successful implementation and adoption by supply chain partners. The aim of this study has been to provide a rich insight into context of CPFR success in supply chain. In order to do this, we have used the FCM approach to model the supporting factors for CPFR. The FCM approach has allowed us to identify and model both
qualitative and quantitative factors and their complex causal relationships in the context of successful CPFR adoption, based on the perceptions of industrial experts.
REFERENCES
[1] J. Andrews, “CPFR: considering the options, advantages and pitfalls”, Supply and Demand Executive, April/May 2008, pp. 8-12.
[2] R. Axelrod, “Structure of decision: the cognitive maps of political elites”, New York: Princeton, 1976.
[3] M.A. Barratt, A. Oliveira, “Exploring the experiences of collaborative planning initiatives”, International Journal of Physical Distribution and Logistics Management, vol. 31, no. 4, 2001, pp. 266-289.
[4] D. Boddy, C. Cahill, M. Charles, M. Fraser Kraus, and D. Macbeth, “Success and failure in implementing supply chain partnering: an empirical study”, European Journal of Purchasing and Supply Management, vol. 2, no. 2, 1998, pp. 143-151. [5] S. Chapman, P. Carter, “Supplier/customer inventory relationships under
just-in-time”, Decision Science, vol. 21, no. 1, 1990, pp. 35-51.
[6] M. Christopher, U. Juttner, “Developing strategic partnerships in the supply chain: a practitioner perspective”, European Journal of Purchasing and Supply Management, vol. 6, 2000, pp. 117–127.
[7] C.J. Corbett, J.D. Blackburn, L.N. van Wassenhove, “Partnerships to improve supply chains”, Sloan Management Review, vol. 40, no. 4, 1999, pp. 71-82. [8] L. Crewe, E. Davenport, “The puppet show changing buyer supplier relationships
within clothing retailing”, Transactions of the Institute of British Geographers, vol. 17, no. 2, 1992, pp. 183-197.
[9] A.E. Ellinger, “Improving marketing/logistics cross functional collaboration in the supply chain”, Industrial Marketing Management, vol. 25, 2002, pp. 85-96. [10] G. Fliedner, “CPFR: an emerging supply chain tool”, Industrial Management and
Data Systems, vol. 103, no. 1, 2003, pp. 14–21.
[11] P.S. Foote, M. Krishnamurthi, “Forecasting using data warehousing model: Wal-Mart’s experience”, The Journal, 2001.
[12] R. Friedmen, “Trust, understanding, and control: factors affecting support for mutual gains bargaining in labor negotiations”, Annual Meeting of the Academy of Management, Miami, FL, 1991.
[13] L. Horvath, “Collaboration: key to value creation in supply chain management”, International Journal of Supply Chain Management, vol. 6, no. 5, 2001, pp. 205-212.
[14] T. Huber, R. Daft, “The information environment of organizations”, Newbury Park, CA: Sage Publications, 1987.
[15] R. Ireland, R. Bruce, “CPFR: only the beginning of collaboration”, Supply Chain Management Review, September/October 2000, pp. 80-88.
[16] B. Kosko, “Fuzzy cognitive maps” , International Journal Man-Machine Studies, vol. 24, no. 1, 1996, pp. 65–75.
[17] H. Lee, C. Billington, “Managing supply chain inventories: pitfalls and opportunities”, Sloan Management Review, vol. 33, no. 3, 1992, pp. 65-73. [18] H.L. Lee, S. Whang, “Information sharing in a supply chain”, International Journal
of Technology Management, vol. 20, no. 3-4, 2000,, pp. 373-387.
[19] M. Madberger, “Interorganizational collaboration in supply chain management: what drives firms to share information with their trading partners?”, [Dig. 41st
Hawaii International Conference on System Sciences, 2008].
[20] S. McCharty, S. Golocic, “Implementing collaborative planning to improve supply chain performance”, International Journal of Physical Distribution and Logistics Management,, vol. 32, no. 6, 2002, pp. 431-454.
[21] M. McIvor, M. McHugh, “Partnership sourcing: an organization change management perspective”, The Journal of Supply Chain Management 2000,, pp. 12-20.
[22] J. Mohr, J. Nevin, “Communication strategies in marketing channels: a theoretical perspective”, Journal of Marketing, vol. 54, 1990, pp. 36-51.
[23] J. Mohr, R.E. Spekman, “Characteristic of partnership success: partnership attributes, communication behavior and conflict resolution techniques”, Strategic Management Journal, vol. 15, no. 2, 1994, pp. 135-152.
[24] R.M. Monczka, K.J. Petersen, R.B. Handfield, “Success factors in strategic supplier alliances: the buying company perspective”, Decision Sciences, vol. 29, no. 3, 1998, pp. 553-575.
[25] B. Pilling, L. Zhang, “Cooperative exchange: rewards and risks”, International Journal of Purchasing and Materials Management, vol.12, no.2, 1992, pp.2-9. [26] K. Ramadas, R.E. Spekman, “Chain or shackles: understanding what drives supply
chain performance”, Interfaces, vol. 30, no. 4, 2000, pp. 3-21.
[27] A.J. Raturi, J. Meredith, D. McCutcheon and J. Camm, “Coping with the build to forecast environment”, Journal of Operations Management, vol. 9, no. 2, 1990, pp. 230-249.
[28] T.M. Simatupang, R. Sridharan, “The collaborative supply chain”, International Journal of Logistics Management, vol. 13, no. 1, 2002, pp. 15-30.
[29] T.M. Simatupang, R. Sridharan, “Benchmarking supply chain collaboration”, An International Journal, vol. 11, no. 5, 2004, pp. 484-503.
[30] A. Smith, H. Aldrich, “The role oftrust in the transaction cost economics framework: transaction contexts and governance structures in U.S. manufacturer-supplier relations”, Academy of Management Meeting, Miami, 1991. [31] F. Smith, K. Carroll, S. Ashford, “Intra and inter organizational cooperation: toward
a research agenda”, Academy of Management Journal, vol. 38, 1995, pp. 7-23. [32] L. Sparks, “The logistic information of British retailing concepts and questions”,
The International Journal of Logistic Management, vol. 5, no. 2, 1994, pp. 53-62. [33] R.E. Spekman, J.W. Kamauff, N. Myhr, “An emprical investigation into supply
chain management: a perspective of partnership”, Supply Chain Management, vol. 3, no. 2, 1998, pp. 53-67.
[34] M. Tang,, J. Gattorna, “Developing an aligned supply chain operation strategy”, Supply Chain Management Handbook, 5th edition, London, 2003.
[image:6.612.104.267.450.570.2]