Abstract— This paper deals with the problem of texture feature extraction in digital mammogram. For texture feature extraction, gray level histogram moments statistical texture analysis method is normally used. Entropy is an important texture feature, which is computed based on this method, to build a robust descriptor towards correctly classifying abnormal and normal regions of mammograms. Entropy measures the randomness of intensity distribution. In most feature descriptors, Shannon’s measure is used to measure entropy. In this paper non-Shannon measures are used to measure entropy. Non-Shannon entropies have a higher dynamic range than Shannon entropy over a range of scattering conditions, and are therefore useful in estimating scatter density and regularity. Experiments have been conducted on images of mini-MIAS database (Mammogram Image Analysis Society database (UK)). The Results of this study are quite promising. This work is a part of developing a computer aided decision (CAD) system for early detection of breast cancer.
Index Terms— Breast cancer, Computer aided decision system, Digital mammogram, Non-Shannon entropies, Shannon entropy, Texture feature extraction.
I. INTRODUCTION
As one of the leading deadly diseases, cancer is one of the most common diseases which affect men and women around the world. Among the cancer diseases, breast cancer is especially a concern in women. According to the statistics, breast cancer is one of the major causes for the increase in mortality among middle-aged women in both developed and developing countries. However, the etiologies of breast cancer are unknown and no single dominant cause has emerged. Still, there is no known way of preventing breast cancer but early detection allows treatment before it is spread to other parts of the body. However, it is evident that the earlier breast cancer is found, the better chance a women gets for a full recovery. Moreover, the early detection of breast cancer can play a very important role in reducing the morbidity and mortality rates.
Manuscript received June 20, 2009. .Asterisk indicates corresponding author.
Amar Partap Singh Pharwaha is with the Department of Electronics and communications Engineering, Sant Longowal Institute of Engineering and Technology, Longowal-148106, Sangrur, Punjab, India (e-mail: [email protected] ).
* Baljit Singh is with the Department of Computer Science & Engineering and Information Technology, Baba Banda Singh Bahadur Engineering College, Fatehgarh Sahib-140407, Punjab, India ( phone: +919463446505; e-mail: baljitkhehra@ rediffmail.com).
Mammography [1], [2] is the single most effective, reliable, low cost and highly sensitive method for early detection of breast cancerous. Mammography offers high- quality images at low radiation doses and is the only widely accepted imaging method for routine breast cancer screening. It is recommended that women at the ages of 40 or above should have a mammogram every one to two years. Although mammography is widely used around the world for breast cancer detection, there are some difficulties when mammograms are searched for signs of abnormality by expert radiologists. Such difficulties are that mammograms generally have low contrast compared with normal breast structure and sign of early disease are often small or subtle. This is the main cause of many missed diagnoses that can be mainly attributed to human factors such as subjective or varying decision criteria, distraction by other image features, or simple oversight. As the consequences of errors in detection or classification are costly and since mammography alone can not prove that a suspicious area is tumorous, malignant or benign the tissue has to be removed for closer examination using breast biopsy techniques. Nevertheless, a false- positive detection causes unnecessary biopsy. On the other hand, in a false- negative detection an actual tumor remains undetected. Thus, there is a significant necessity for developing methods for automatic classification of suspicious areas in mammograms, as a means of aiding radiologists to improve the efficacy of screening programs and avoid unnecessary biopsies.
A typical mammogram contains a vast amount of heterogeneous information that depicts different tissues, vessel, ducts, chest skin, breast edge, the film, and the x-ray machine characteristics [3]-[5]. In order to build a robust diagnostic system towards correctly classifying abnormal and normal regions of mammograms, present all the available information that exits in mammograms to the diagnostic system so that it can easily discriminate between the abnormal and normal tissue. However, the use of all the heterogeneous information, results to high dimensioned features vectors that degrade the diagnostic accuracy of utilized systems significantly as well as increase their computational complexity, Therefore, reliable feature vectors should be considered the reduce the amount of irrelevant information thus producing robust mammographic descriptors of compact size[6]-[8].
Texture is one of the important characteristics used in classifying abnormal and normal regions in mammogram. The texture of images refers to the appearance, structural and
Shannon and Non-Shannon Measures of Entropy
for Statistical Texture Feature Extraction in
Digitized Mammograms
arrangement of the parts of an object within the image [9], [10]. Images used for diagnostic purposes in clinical practice are digital. A two dimensional digital image is made up of little rectangular blocks or pixels (picture elements). Each is represented by a set of coordinates in space, and each has a value, representing the gray-level intensity of that picture element in space. A feature value is a real number, which encodes some discriminatory information about a property of an object. Generally speaking, texture feature extraction methods can be classified into three major categories, namely, statistical, structural and spectral. In statistical approaches, texture statistics such as the moments of the gray level histogram, or statistics based on gray level co-occurrence matrix are computed to discriminate different textures [11]. For structural approaches, texture primitive, the basic element of texture, is used to form more complex texture pattern by grammar rules which specify the generation of texture pattern. Finally, in spectral approaches, the textured image is transformed into frequency domain. Then, the extraction of texture features can be done by analyzing the power spectrum. Various texture descriptors have been proposed in the past. In addition to the aforementioned methods, Law’s texture energy measures, Markov random field models, texture spectrum etc. are some other texture descriptors [12]-[14].
This paper deals with the problem of statistical approaches to extract texture features in digital mammogram. Gray level histogram moments method is normally used for this purpose. Entropy [15]-[17] is an important texture feature, which is computed based on this method, to build a robust descriptor towards correctly classifying abnormal and normal regions of mammograms. Entropy measures the randomness of intensity distribution. In most feature descriptors, Shannon’s measure is used to measure entropy. In this paper non-Shannon measures are used to measure entropy. Non-Shannon entropies have a higher dynamic range than Shannon entropy over a range of scattering conditions, and are therefore useful in estimating scatter density and regularity [18].
II. GRAY LEVEL HISTOGRAM MOMENTS Regarding the statistical approach for describing texture, one of the simplest computational approaches is to use statistical moments of the gray level histogram of the image. The image histogram carries important information about the content of an image and can be used for discriminating the abnormal tissue from the local healthy background. Considering the gray level histogram {hi, i =0, 1, 2,……….,Ng-1}, where Ng is the number of distinct gray levels
in the ROI (region of interest). If n is the total number of pixels in the region, then the normalized histogram of the ROI is the set {Hi, i=0, 1, 2,..., Ng-1}, where Hi=hi /n.
Texture measures based on histograms
Shannon-Entropy: It is a measure of randomness.
∑
( )
− =−
=
1 0 2log
g N i i iH
H
S
Non-Shannon measures of Entropy
a) Renyi’s entropy is defined as
0
,
1
log
1
1
1 0 2>
≠
⎟⎟
⎠
⎞
⎜⎜
⎝
⎛
−
=
∑
− =α
α
α
α g N i iH
R
b) Havrda and Charvat gave the measure of entropy
0
,
1
1
1
1
1 0>
≠
⎟⎟
⎠
⎞
⎜⎜
⎝
⎛
−
−
=
∑
− =α
α
α
α g N i iH
HC
c) Kapur’s entropy
0
,
0
,
log
1
1 0 1 0 2 ,>
>
≠
−
=
∑
∑
− = − =β
α
β
α
α
β
β α β α g g N i i N i iH
H
K
III. EXPERIMENTAL RESULTS
Experiments have been conducted on images of mini-MIAS database (Mammogram Image Analysis Society database (UK)). For implementation, MATLAB 7.0 has been used. The mammograms of about 200 images have been considered for simulating the proposed work. For the completeness of description several experimental results have been depicted in Table I and Table II at different values
of α ,β .The exact values of parameters are of less significant and hence the range values have been considered for true or best classification
From the above results it can be inferred that non-Shannon’s entropies (Renyi, Havrda & Charvat and Kapur) are useful parameters for normal and abnormal mammogram images classification. Specially, Havrda & Charvat is most suitable for this purpose. Experimental results indicate that, in non-Shannon entropies, the values of constants
α
,β
play important role for classification.So, selection of suitable values of these constants is necessary.Havrda & Charvat entropy at
α
= 0.5 give the best suitable results for classification. This in turn also helps in the diagnosis of palpable or microcalcifications or tumors in the breast. This work may be employed to develop a computer aided decision (CAD) system for early detection of breast cancer.TABLE I
ENTROPY MEASURE OF MAMMOGRAM IMAGES BASED ON
GRAY LEVEL HISTOGRAM MOMENTS AT
α
=0.5 FOR RENYI,α
=0.7 FOR HAVRDA & CHARVATAND
α
= 0.5,β
= 0.7 FOR KAPURImage samples
S R
α
=0.5HC
α
=0.7K
α,
β7
.
0
5
.
0
=
=
β
α
[image:3.595.302.542.57.528.2]Mam1 4.7658 6.9242 8.7940 7.9945 Mam2 5.1761 6.9060 9.0540 7.7959 Mam3 5.2400 7.0073 9.3439 7.8821 Mam4 5.1644 6.7166 8.6331 7.5718 Mam5 4.8436 6.7857 8.5198 7.8131 Mam6 5.1044 6.7977 8.7193 7.7227 Mam7 5.5805 7.0348 9.7094 7.7459 Mam8 4.2316 6.6505 7.8027 7.9252 Mam9 2.9738 6.1737 6.0264 7.9867 Mam10 4.1991 6.4753 7.3892 7.7603 Mam11 4.5951 6.7681 8.2881 7.9115 Mam12 4.9022 6.8990 8.8035 7.9257 Mam13 4.9559 6.8047 8.6226 7.7983 Mam14 4.4958 6.7285 8.1625 7.8909 Mam15 4.9878 6.9086 8.9161 7.8832
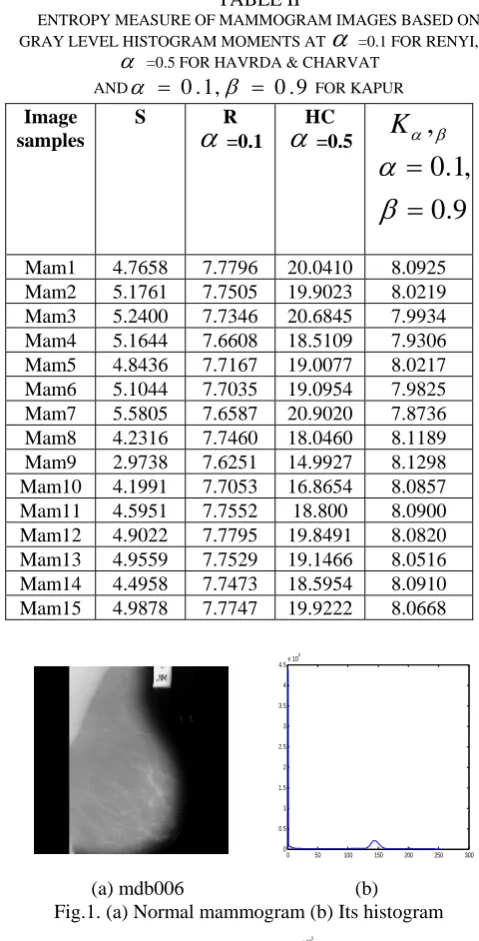
TABLE II
ENTROPY MEASURE OF MAMMOGRAM IMAGES BASED ON
GRAY LEVEL HISTOGRAM MOMENTS AT
α
=0.1 FOR RENYI,α
=0.5 FOR HAVRDA & CHARVATAND
α
= 0.1,β
= 0.9 FOR KAPURImage samples
S R
α
=0.1HC
α
=0.5K
α,
β9
.
0
,
1
.
0
=
=
β
α
Mam1 4.7658 7.7796 20.0410 8.0925 Mam2 5.1761 7.7505 19.9023 8.0219 Mam3 5.2400 7.7346 20.6845 7.9934 Mam4 5.1644 7.6608 18.5109 7.9306 Mam5 4.8436 7.7167 19.0077 8.0217 Mam6 5.1044 7.7035 19.0954 7.9825 Mam7 5.5805 7.6587 20.9020 7.8736 Mam8 4.2316 7.7460 18.0460 8.1189 Mam9 2.9738 7.6251 14.9927 8.1298 Mam10 4.1991 7.7053 16.8654 8.0857 Mam11 4.5951 7.7552 18.800 8.0900 Mam12 4.9022 7.7795 19.8491 8.0820 Mam13 4.9559 7.7529 19.1466 8.0516 Mam14 4.4958 7.7473 18.5954 8.0910 Mam15 4.9878 7.7747 19.9222 8.0668
0 50 100 150 200 250 300 0
0.5 1 1.5 2 2.5 3 3.5 4 4.5x 10
5
(a) mdb006 (b) Fig.1. (a) Normal mammogram (b) Its histogram
0 50 100 150 200 250 300
0 0.5 1 1.5 2 2.5 3 3.5 4 4.5 5x 10
5
(a) mdb312 (b) Fig.2. (a) Benign mammogram (b) Its histogram
0 50 100 150 200 250 300
0 0.5 1 1.5 2 2.5 3 3.5 4x 10
5
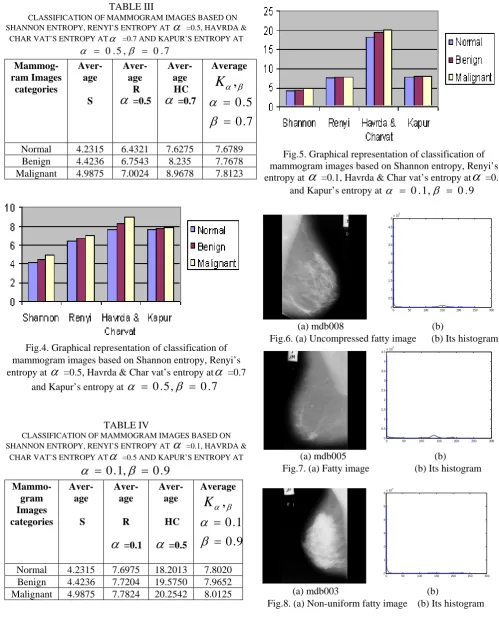
TABLE III
CLASSIFICATION OF MAMMOGRAM IMAGES BASED ON
SHANNON ENTROPY, RENYI’S ENTROPY AT
α
=0.5, HAVRDA &CHAR VAT’S ENTROPY ATα =0.7 AND KAPUR’S ENTROPY AT
7 . 0 , 5 .
0 =
= β
α Mammog- ram Images
categories
Aver- age
S
Aver- age
R
α
=0.5Aver- age HC
α
=0.7Average
β α
,
K
7
.
0
5
.
0
=
=
β
α
Normal 4.2315 6.4321 7.6275 7.6789 Benign 4.4236 6.7543 8.235 7.7678 Malignant 4.9875 7.0024 8.9678 7.8123
Fig.4. Graphical representation of classification of mammogram images based on Shannon entropy, Renyi’s entropy at
α
=0.5, Havrda & Char vat’s entropy atα
=0.7and Kapur’s entropy at
α
=
0
.
5
,
β
=
0
.
7
TABLE IV
CLASSIFICATION OF MAMMOGRAM IMAGES BASED ON
SHANNON ENTROPY, RENYI’S ENTROPY AT
α
=0.1, HAVRDA &CHAR VAT’S ENTROPY AT
α
=0.5 AND KAPUR’S ENTROPY AT9
.
0
,
1
.
0
=
=
β
α
Mammo-gram Images categories
Aver- age
S
Aver- age
R
α
=0.1Aver- age
HC
α
=0.5Average
β α
,
K
9
.
0
1
.
0
=
=
β
α
[image:4.595.46.323.66.391.2]Normal 4.2315 7.6975 18.2013 7.8020 Benign 4.4236 7.7204 19.5750 7.9652 Malignant 4.9875 7.7824 20.2542 8.0125
Fig.5. Graphical representation of classification of mammogram images based on Shannon entropy, Renyi’s entropy at
α
=0.1, Havrda & Char vat’s entropy atα
=0.5and Kapur’s entropy at
α
= 0.1,β
= 0.90 50 100 150 200 250 300
0 0.5 1 1.5 2 2.5 3 3.5 4 4.5 5x 10
5
(a) mdb008 (b)
Fig.6. (a) Uncompressed fatty image (b) Its histogram
0 50 100 150 200 250 300
0 0.5 1 1.5 2 2.5 3 3.5 4 4.5x 10
5
(a) mdb005 (b)
Fig.7. (a) Fatty image (b) Its histogram
0 50 100 150 200 250 300
0 1 2 3 4 5 6x 10
5
(a) mdb003 (b)
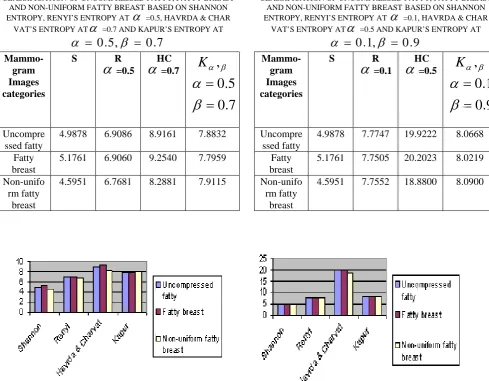
[image:4.595.305.542.263.648.2]TABLE V
CLASSIFICATION OF UNCOMPRESSED FATTY, FATTY BREAST
AND NON-UNIFORM FATTY BREASTBASED ON SHANNON
ENTROPY, RENYI’S ENTROPY AT
α
=0.5, HAVRDA & CHARVAT’S ENTROPY AT
α
=0.7 AND KAPUR’S ENTROPY AT7
.
0
,
5
.
0
=
=
β
α
Mammo-gram Images categories
S R
α
=0.5HC
α
=0.7K
α,
β7
.
0
5
.
0
=
=
β
α
Uncompre ssed fatty
4.9878 6.9086 8.9161 7.8832
Fatty breast
5.1761 6.9060 9.2540 7.7959
Non-unifo rm fatty
breast
[image:5.595.306.512.311.452.2]4.5951 6.7681 8.2881 7.9115
Fig.9. Graphical representation of classification of uncompressed fatty, fatty breast and non-uniform fatty breast
based on Shannon entropy, Renyi’s entropy at
α
=0.5, Havrda & Char vat’s entropy atα
=0.7 and Kapur’s entropyat
α
=
0
.
5
,
β
=
0
.
7
IV. CONCLUSIONS AND FUTURE WORK In this paper, an attempt is made to develop a new features descriptor based on non-Shannon’s entropies (Renyi, Havrda & Charvat and Kapur) for classifying normal and abnormal mammogram images. Experiment results have demonstrated that Havrda & Charvat entropy based feature for classifying normal and abnormal mammogram images works satisfactorily for normal, benign and malignant digital mammograms images and also for uncompressed fatty, fatty breast and non-uniform fatty breast mammogram images. In future work, Havrda & Charvat entropy based feature will be included with other existing statistical features to build a robust features descriptor for developing a CAD for early detection of breast cancer.
TABLE VI
CLASSIFICATION OF UNCOMPRESSED FATTY, FATTY BREAST
AND NON-UNIFORM FATTY BREASTBASED ON SHANNON
ENTROPY, RENYI’S ENTROPY AT
α
=0.1, HAVRDA & CHARVAT’S ENTROPY AT
α
=0.5 AND KAPUR’S ENTROPY AT9
.
0
,
1
.
0
=
=
β
α
Mammo-gram Images categories
S R
α
=0.1HC
α
=0.5K
α,
β9
.
0
1
.
0
=
=
β
α
Uncompre ssed fatty
4.9878 7.7747 19.9222 8.0668
Fatty breast
5.1761 7.7505 20.2023 8.0219
Non-unifo rm fatty
breast
[image:5.595.64.279.326.450.2]4.5951 7.7552 18.8800 8.0900
Fig.10. Graphical representation of classification of uncompressed fatty, fatty breast and non-uniform fatty breast
based on Shannon entropy, Renyi’s entropy at
α
=0.1, Havrda & Char vat’s entropy atα
=0.5 and Kapur’s entropyat
α
=
0
.
1
,
β
=
0
.
9
ACKNOWLEDGMENT
Authors are greatly indebted to the Department of Electronics and Communications Engineering, SLIET, Longowal-148106 (District: Sangrur) Punjab for providing excellent lab facilities that make this work feasible.
REFERENCES
[1] H.S. Sheshadri, A. Kandaswamy, “Experimental investigation on breast tissue classification based on statistical feature extraction of
mammogram,” Computerized medical imaging and graphics, vol. 31,
2007, pp. 46-48.
[2] I. Christoyianni, A. Koutras, E. Dermatas, G. Kokkinakis, “Computer aided diagnosis of breast cancer in digitized mammograms,”
[3] Brijesh Verma, Ping Zhang, “A novel neural-genetic algorithm to find the most significant combination of features in digital mammograms,”
Applied soft computing, vol.7, 2007, pp. 612-625.
[4] San-Kan Lee, Chien-Shun Lo, Chuin-Mu Wang, Pau-Choo Chung,Chein-I Chang, Ching-Wen Yang and Pi-chang Hsu, “A computer-aided design mammography screening system for detection
and classification of microcalcifications,” International journal of
medical informatics , vol. 60, 2000, pp. 29-57.
[5] H.D.Cheng, Xiaopeng Cai, Xiaowei Chen, Liming Hu, Xueling Lou, “Computer-aided detection and classification of microcalcifications in
mammograms: a survey,” Pattern recognition, vol. 36, 2003, pp.
2967-2991.
[6] H.D. Cheng, Muyi Cui, “Mass lesion detection with a fuzzy neural
network,” Pattern recognition, vol. 37, 2004, pp. 1189-1200.
[7] H.D. Cheng, X.J. Shi, R. Min, L.M. Hu, X. P. Cai, H.N. Du, “ Approaches for automated detection and classification of masses in mammograms,”
Pattern recognition, vol. 39, 2006, pp. 646-668.
[8] M. E. Mavroforakis, H.V. Georgiou, N. Dimitropoulos, D. Cavouras, S. Theodoridis, “Mammographic masses characterization based on localized texture and dataset fractal analysis using linear, neural and
support vector machine classifiers,” Artificial intelligence in medicine,
vol. 37, 2006, pp. 145-162.
[9] Brijesh Verma and John Zakos, “A computer-aided diagnosis system for digital mammograms based on fuzzy-neural and feature extraction
techniques,” IEEE trans. on information technology in biomedicine, vol.
5, no. 1, March 2001.
[10] Jong Kook Kim and Hyun Wook Park, “Statistical textural features for
detection of microcalcifications in digitized mammograms,” IEEE
Trans. on medical imaging, vol. 18, no. 3, March 1999.
[11] J.K. Kim, J. Mi Park, K. S. Song and H. W. Park, “Texture analysis and artificial neural network for detection of clustered microcalcifications on
mammograms,” Neural networks for signal processing [1997] VII,
Proceedings of the 1997 IEEE workshop, pp. 199-206.
[12] A Karahaliou, S Skiadopoulos, I Boniatis, P Sakellaropoulos, E Likaki, G Panayiotakis and L Costaridou, “ Texture analysis microcalcifications
on mammograms for breast cancer diagnosis,” British journal of
radiology, vol. 80, 2007, pp. 648-656.
[13] Yuan-Yuan Wan, Ji-Xiang Du, De-Shuang Huang, Zheru Chi, Yiu-Ming Cheung, Xiao-Feng Wang and Guo-Jun Zhang, “Bark texture
feature extraction based on statistical texture analysis,” Proceedings of
2004 international symposium on intelligent multimedia, video and speech processing, Oct 20-22, 2004, Hong Kong.
[14] M R Chandraratne, “ Comparison of three statistical texture measures
for lamb grading,” 1st international conference on industrial and
information systems,ICIIS2006, 8-11Aug 2006, Sri Lanka.
[15] J.N. Kapur, Measure of information and their applications, 1st edition
Wiley Eastern Limited, New Delhi, 1994.
[16] LI Yan, Fan Xiaoping and Li Gang, “An application of Tsallis entropy
minimum difference on image segmentation,” Proceeding of the 6th
world congress on intelligent control and automation, June 21-23, 2006, Dalian, China.
[17] M.Portes de Albuquerque,I.A.Esquef,A.R.Gesualdi Mello, “Image
Thresholding using Tsallis entropy,” Pattern Recognition Letters, vol.
25, 2004, pp.1059-1065.
[18] R. Smolikova, M.P.Wachowiak, G.D.Tourassi, A.Elmaghraby, J.M.Zurada, “Characterization of ultrasonic back scatter based on
generalized entropy,” Proceeding of the 2nd joint EMBS/BMES
conference, Houston, TX, USA, Oct 23-26, 2002.
Prof. (Dr.) Amar Partap Singh Pharwaha was born in 1967 at Sangrur, Punjab, India. He received the Bachelor of Technology degree in electronics engineering from Guru Nanak Dev University, Amritsar, Punjab, India in 1990 and the Master of Technology degree in Instrumentation from Regional Engineering College, Kurukshetra, Haryana, India in 1994. He also got the Ph. D. degree in Electronics and Communications Engineering from Punjab technical university, Jalandhar, Punjab, India in 2005.
He is working as Professor and Head in the Department of Electronics and Communications Engineering at Sant Longowal Institute of Engineering and Technology, Longowal, Sangrur, Punjab, India. He has published more than 60 research papers at various international and national level symposia/ conferences and journals. His research interests in virtual instrumentation, artificial neural networks and medical electronics.
He is a life member of the Institute of Engineers (India), Indian Society of Technical Education (India) and Punjab Academy of Sciences, Punjab, India.
Baljit Singh was born in 1974 at Ferozepur, Punjab, India. He received the Bachelor of Engineering degree in Computer Engineering from Punjab technical university, Jalandhar, Punjab, India in 1998 and the Master of Technology in Computer Science and Engineering from Punjabi university, Patiala, Punjab, India in 2005. Currently, he is pursuing the Ph.D. degree in the area of medical image processing from Sant Longowal Institute of Engineering and Technology, Longowal, Sangrur, Punjab, India.
He is an assistant professor in the Department of Computer Science & Engineering and Information Technology of Baba Banda Singh Bahadur Engineering College, Fatehgarh Sahib, Punjab, India. He has published more than 6 research papers in various international journals and refereed conferences. His main research interests are in image processing, medical imaging, artificial neural networks and genetic algorithms.