Abstract—Bulk phonon limited mobility in silicon based MOSFETs, have long been observed to demonstrate a -1/3rd dependence on the effective transverse field at room and higher temperatures. However, despite significant effort, existing phonon scattering models fail to reproduce this dependence. This paper reports on the impact of approximations used in the calculation of the intra-valley scattering rate in existing models which causes a much reduced dependence of phonon limited mobility on the effective field. An expression for scattering rate in the absence of such approximations is derived. The improvement of the new complex model is however, insufficient to match experiment. To improve the situation an empirical model is proposed with deformation potentials dependent on the inversion sheet concentration.
Index Terms— Phonon Mobility, MOSFET, Effective Field, Temperature Dependence.
I. INTRODUCTION
he electron-phonon scattering model for semiconductors dates back to the ‘80’s [1, 2], and can be primarily accounted for by acoustic and optical phonons, with intra- and inter-valley scattering rates for the MOS geometry given by [3-8]:
( )1
, 2 3
2 ,
int
j j
i l
B ac d j
i ra
E E F S
T k D m
E
(1)
and
( )1 1
2 2 1 2
1
, 2
, int
j o j
i o
o o
B o d j
i er
E E E F E f
E E f
N E
T k D m n E
(2)
) ( )
( 2
2
0
, dz z z
Fi j
i j
where md is the DOS mass at the bottom of conduction
band, Dac is the potential associated with acoustic phonons,
T
kB is the thermal energy of electrons at temperature T, and is the reduced Plank’s constant . Volume density of the substrate is denoted byand Sl is the longitudinal velocity of sound. Fi,j is the form factor appearing due to electron
quantization in the channel. The form factor depends upon the envelope function i
z of charge carriers in the confinedstate i.e. 2DEG. These envelope functions and the
a) Work done at De Montfort University, Leicester, UK, email:
corresponding quantized energies Ei in the ith subband are calculated by self consistently solving the Schrödinger and the Poisson equations [9].
x is the Heaviside step function. N0 is the phonon number calculated from the Bose-Einstein distribution, f
E represents the electron distribution function, nv is the number of available final valleys (see Table I). The optical phonon energy is given by0
E and the corresponding deformation potential is denoted by D0. For the emission process 1and for absorption
1
[image:1.595.48.294.411.586.2] .
Table I: Degeneracy factors appearing in the inter-valley scattering rate.
The simple model equation (1) for the intra-valley scattering rate is based on five primary assumptions viz.:
(i) Only the longitudinal phonon mode is considered. (ii) Isotropic deformation potentials are assumed. (iii) Conduction bands are parabolic in nature. (iv) Energy equipartition approximation is employed. (v) Elastic scattering is assumed.
Deformation potentials (Dac and D0) appearing in the above expressions (1) and (2) are critical since they exhibit the coupling strength between the charge carriers and phonons. The deformation potential for acoustic phonons in bulk silicon is known to be Dac 9eV [6] but in two-dimensionally confined MOS inversion layers, this bulk value gives effective mobility greater than measurements. This discrepancy has been traditionally overcome by using an “effective deformation potential”, i.e. by artificially increasing the value of the acoustic deformation potential from 9eV to upto 23eV, this is done on the basis that only Longitudinal Acoustic (LA) modes are taken into account in the scattering, whereas the relatively weaker Transverse Acoustic (TA) modes are ignored [4, 5, 8, 10, 11]. Hence, instead of computing scattering rates twice- once for LA phonons and then for TA phonons a “unimode” and isotropic scattering is assumed.
For silicon, the inter-valley deformation potentials (Do)
depend on f- and g-type scattering mechanisms and also on the corresponding phonon energies (Eo).Two widely used sets of inter-valley deformation parameters are those
Semi-Empirical Phonon Scattering Model
a)
Raheel Shah and
b)M. M. De Souza
T
0
1 1
f v
n
n
vg11
1
2
2 2
f v
n
n
vg22
1
4
2 1
f v
n
n
vg12
0
2
1 2
f v
included) [6] and Ferry (one f and one g process included) [12]. These along with other transport parameters have been computed/fitted using Monte Carlo (MC) codes through comparing simulated output with measurements [13, 14].
II. EFFECTIVE FIELD DEPENDENCE
Fig. 1 shows the measured phonon limited mobility, taken from ref. [4], made on a low doped sample (21016cm3)
for a range of effective fields below
cm MV
5 .
0 , where the
impact of surface roughness scattering is negligible [15]. Measured phonon limited mobility has a -1/3rd dependence on the effective field. Fig. 1 also displays the simulated phonon limited mobility using Dac 12eV (in expression (1)) and with inter-valley Jacoboni’s parameters (for expression (2)). It is evident that not only is the magnitude of simulated mobility higher than the experiment but the
eff
E dependency, is a complete mismatch with these simple model equations.
0.1 0.2 0.3 0.4 0.5 0.6
300 400 500 600 700 800 900 1000 2000 3000
0.05 0.0750.1 0.25 0.5 0.75 1 102
103
104
(100) Electron T= 300 K
Eeff-0.3
eff
(c
m
2/V
-s
)
Eeff (MV/cm) Eeff-0.09
With Approximations
Jacoboni's Parameters
Eeff-0.185
Without Approximations
Dac=12 eV
Eeff-0.3
Solid Lines: Simulated Circles: Measured
T=300 K
ph
(c
m
2/V
-s
)
[image:2.595.305.547.43.225.2]Eeff (MV/cm)
Fig. 1: Simulated and measured mobility from ref [4] versusEeff.
Inset shows the effective mobility for the entire range of Eeff [15]. Note the sharp drop in mobility after 0.5 MV/cm arising from surface roughness scattering.
The dependence of phonon limited mobility on Eeff
appears through the form factor Fi,jin equations (1) and (2). MathematicallyFi,j is a matrix entity with “i” number of rows and “j”number of columns. The form factor is a weak but complex function of Eeff; additionally, its components
show different dependence on Eeff. To analyse its impact on simulated mobility a simple approach is adopted i.e. the sum over initial and final subbands is computed and then the reciprocal of the resultant “form factor” is plotted against the effective field in fig. 2. These results reveal that the power law ( Eeff0.11 ) governing theoretical mobility arises
primarily between ladder-1 valleys.
0.1 0.2 0.3 0.4 0.5 0.6
3 4 5 6 7 8 9
T =300 K Si (100)
Eeff-0.04 Eeff-0.02 Ladder-2
Ladder-1---Ladder-2
Eeff-0.11 Ladder-1
[
i
j
Fi,j
]
-1 (1
0
-1
2 c
m
-1 )
Eeff (MV/cm)
Fig. 2: Plot of reciprocal sum of the form factor versus Eeff plotted to provide an understanding of the underlying causes of the -1/3rd
dependence of phonon limited mobility. The strongest dependence appears for transitions between ladder-1 valleys.
III. INTRA-VALLEY MODEL WITHOUT APPROXIMATIONS The failure of the electron-phonon scattering model has been explicitly reported earlier by Takagi et al [4] and Jungemann et al [5]. Since intra-valley scattering is the dominant scattering mechanism in electron-phonon interaction [11] it is therefore appropriate to review the assumptions made in arriving at the intra-valley scattering rate for expression (1). The impact of these approximations on the phonon limited mobility may be understood by deriving a relatively “complete” model equation for intra-valley scattering..
A. Inclusion of Anisotropy with LA and TA modes
The anisotropy of intra-valley deformation potential is introduced through the formulation given by Herring and Vogt, specifically [16].
Q d ucos2( Q)LA
(3a)
Q ucos( Q) sin( Q)TA
(3b)
where u and d are uniaxial-shear and dilation deformation potentials, respectively. The angle Q is
measured between the major axis of an ellipsoidal conduction valley and the 3D phonon wave vector Q. Without loss of generality, aligning the Cartesian coordinate axes along the major and minor axes of the ellipsoid, the longitudinal component Qlof the wave vector is given by (see fig. 3):
) cos( )
cos(
2 2
Q z Q l
q q Q Q
(4)
where qz and qare, respectively, the components of the
wave vector Q along the quantized direction (z) and the xy-plane. Mathematically qis given in terms of initial wave vector ki and the final (scattered) wave vector kj by, (see
fig. 4):
i
j k
k
q (5)
[image:2.595.48.290.309.487.2]Fig. 3: Schematic layout of three-dimensional wave vector Q in an ellipsoidal conduction valley is shown.
) cos( 2
2 2
2
j i j
i k k k
k
q (6)
Angles and give the relative separation between
i
k and kj. For the specific case of Si which has two different
ladders of valleys viz.: ladder-1 with major axis aligned with the quantization direction (z) and ladder-2 with major axis along one of the x or y direction. The longitudinal component
l
Q is given for the two ladders as:
1
q ladder
Ql z (7a)
2 )
cos( )
cos(
k k ladder
Ql j i (7b)
From the above description it is clear that the anisotropic longitudinal and transverse deformation potentials are function of electron energy, quantization vector qz, angles
and
. In order to keep the scattering rate independent ofq
z, and , and only dependent on electron energy it is reasonable to take the average value of the deformation potential over qz, and , defined as [17].
z z j i Q n j i avg j i n dq q d d F E D 2 , 2 2 0 2 0 , 3 2 , , ) ( ) ( ) 2 ( 1 ) (
(8)
where “n” stands for LA or TA mode and the electronic form factor i,j(qz)is related to the “usual” form factor Fi,jas
[17, 18]:
2 2 , 2
0
,j i ( ) j( ) 21 z ij( z)
i dz z z dq q
F
(9)
Replacing Dac2 in (1) by
2 , , (E)
Dnavgi j defined in (8), the intra-valley scattering rate reflects the anisotropy of the LA and TA modes i.e.:
( ) ) ( 1 , 2 2 , , ) 2 ( , int , j j i n B avg j i n d j i ra n E E F S T k E D gE
(10)
where (2 ) 2
d
d m
g is the two-dimensional density of
states. In the last equation, two approximations are removed i.e. both longitudinal and transverse modes of the acoustic phonons are considered and an anisotropic, electron energy dependent deformation potential is introduced. Evaluation of
Fig. 4: 2D wave vector qwith initial kiand final kj wave vectors shown.
anisotropic deformation potentials (expression (8)) is computationally expensive (both in terms of memory and CPU time) due to the appearance of triple integral. Jacoboni et al proposed an efficient scheme as an alternative to the expensive computation of anisotropic potentials, termed as “self-scattering” technique, unfortunately this can only be used in conjunction with Monte Carlo (MC) codes [6, 17].
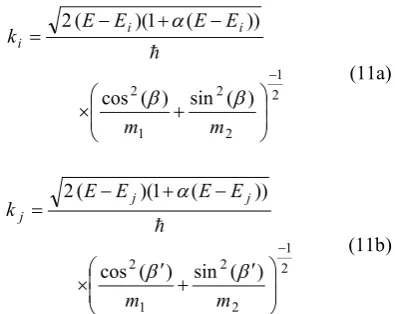
B. Nonparabolicity
In a nonparabolic conduction band, the initial and final wave vectors appearing in (7) are given as follows: [17] (and [19] with the assumptions stated therein):
2 1
2 2
1
2( ) sin ( ) cos )) ( 1 )( ( 2 m m E E E E
ki i i
(11a) 2 1 2 2 1
2( ) sin ( ) cos )) ( 1 )( ( 2 m m E E E E
kj j j
(11b)
where m1 mt and m2 mtorml for ladder-1 or ladder-2 valleys, respectively.
is the nonparabolicity factor, for Si1
5 .
0
eV
[6]. Nonparabolicity also affects the two-dimensional density of states g(2d), which increases accordingly as [20]:
1 2 ( , )
) 2 ( ) 2 (
,jd d k iavgj
i g E V
g (12)
0
, e (z)V(z) (z)dz
Viavgj i j (13)
where Viavg,j is the average potential energy over the substrate
depth. Ek is the initial electron kinetic energy
i.e. d i k m k E 2 2 2
. Thus (10) is modified to:
) ( )
( 1 i(,2jd) navg,i,j 2 B
E E F T k E D g
(14)
Q Q
Y Z X ) cos( Q l QQ
[image:3.595.352.550.362.519.2]The “nonparabolic” density of states is also introduced in the inter-valley scattering model i.e. (2) which now reads as:
( ) 1 1 2 2 1 2 1 , 2 ) 2 ( , , int j o j i o o o B o d j i j i er E E E F E f E E f N E T k D g n E (15)C. Equipartition and Elastic approximations
For obvious reasons the scattering rate is proportional to the number of phonons (Nq) emitted or absorbed by the
charge carriers. The Phonon “occupancy” number, Nq is
given by the Bose-Einstein distribution as:
1 1 ) ( T k q B
e
N (16)
With the assumption of a linear increase in acoustic phonon energy with the transferred wave vector q i.e.
q Sn
, the intra-valley scattering rate with the inclusion of emission and absorption events is then given by:
) ( ) 2 2 1 ( 8 ) ( 1 max min 2 , 2 , , 2 ) 2 ( , , int , j q q q j i k n d avg j i n d j i j i ra n E E dq q N F E S m E D g E
(17)The lower (qmin) and upper (qmax ) bound on qare calculated by mutually maintaining energy and momentum conservation [21]:
1 (2 )
2 )
cos(
k i d i E qk m k q (18)
The intra-valley scattering rate given by (17) is independent of the five stated approximations. With relatively improved intra-valley scattering rate and introduction of nonparabolicity factor in the inter-valley scattering rate, the results are displayed in fig. 1. It is observed that the dependence is now given as Eeff0.185 though
it still falls short of the experimental value of Eeff0.3. To resolve the discrepancy between measurement and the predicted mobility, Takagi et al have proposed higher values for intra- and inter-valley deformation potentials (stronger coupling ~2.4) [4]. This scheme helps reduce overestimated mobility but not the effective field dependence.
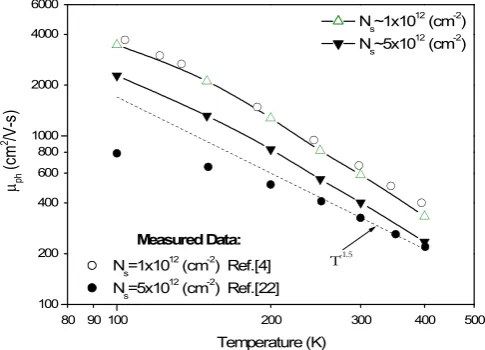
Fig. 5 shows the phonon limited mobility as a function of temperature compared with two sets of experimental data first from ref. [4] at sheet density of Ns 11012(cm2)and the second from ref. [22] at
N
5
10
12(
cm
2)
s
. Theexperimental data follows aT-1.75trend at low sheet density
and T-1.5for moderate N
svalues in comparison with simulated
slopes which are -1.73 and -1.65 respectively. However, even with relatively comprehensive model the simulated mobility is significantly overestimated.
80 90 100 200 300 400 500
100 200 400 600 800 1000 2000 4000 Measured Data:
Ns=1x10¹²
(cm-2
) Ref.[4]
Ns=5x10¹²
(cm-2
) Ref.[22]
ph (c m 2 /V -s )
Ns~1x10¹²
(cm-2
)
Ns~5x10¹²
(cm-2 ) T-1.75 T-1.5 T-1.73 T-1.65 Temperature (K)
Fig. 5: Using relatively complete model the simulated phonon limited mobility and its temperature dependence for two different sheet concentrations is shown. Experimental data are also given for comparison from [4] and [22].
IV. EMPIRICAL APPROACH
As a compromise between simplicity and computational complexity, an empirical approach whereby the intra- and inter-valley deformation potentials are assumed to be effective field (or inversion sheet concentration, Ns ) dependent is proposed. This assumption is based on the earlier work of C. Wu and G. Thomas who reported the effective field dependent deformation potential for a two-dimensional electron-phonon scattering when the electron channel density varies significantly over the lattice constant of the substrate [23, 24]. The basis for this assumption arises from the fact that at low effective fields the 2DEG is less confined to the surface (and would be more bulk-like) than at higher effective fields.
The proposed empirical relationship between Dac and
s
N is given by:
s s
ac N a b N
D ( ) (19)
The coefficients a&b which best match experiment are determined from two limits:
eV cm
D eV cm
Dac(11011 2)13 ; ac(51013 2)23 (20)
The inter-valley coupling (Do) appearing in equation (2)
is also increased in the same proportion as that of acoustic deformation potential i.e.
CP D N
Do( s) o (21)
where the Coupling Parameter (CP) with reference to bulk Si value is defined as:
) ( ) ( Bulk D N D CP ac s ac (22)
In fig. 6, improved mobility are plotted against Eeff for
three different lattice temperatures T 188K ,
K
T 300 and T 397K. Experimental data from refs. [4] and [15] are also displayed for comparison. At the higher temperature range (T 397K), the simulated mobility is now only underestimated by <15% over the entire range of
eff
[image:4.595.308.547.45.221.2]0.1 0.2 0.3 0.4 0.5 0.6 200
300 400 500 600 700 800 900 1000 2000
Eeff-0.3 weak coupling
simulated at 300K
s s
ac N a b N D ( )
T=188 K
T=397 K T=300 K
Lines: Simulated Circles: Measured
Jacoboni's Parameters
Eeff (MV/cm)
ph
(c
m
2 /V
-s
[image:5.595.47.290.45.219.2])
Fig. 6: Phonon limited mobility calculated with “simple modified” transport model. Mobility is given for three different lattice temperatures over the effective field range. Parameters aand b are calibrated at T300K. Measured data are from ref. [4] and [15].
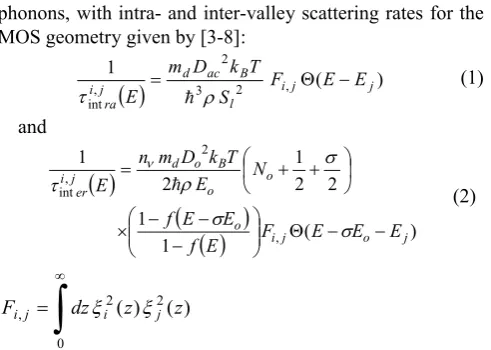
Temperature dependence of phonon mobility using the simplified empirical model is shown in Fig 7. Results in fig. 7 are significantly improved in comparison to fig 5.
80 90 100 200 300 400 500
100 200 400 600 800 1000 2000 4000 6000
Measured Data:
Ns=1x10¹²
(cm-2
) Ref.[4]
Ns=5x10¹²
(cm-2
) Ref.[22]
T-1.5
ph
(c
m
2 /V
-s
)
Ns~1x10¹²
(cm-2
)
Ns~5x10¹² (cm-2)
Temperature (K)
Fig. 7: A comparison of the temperature dependence of phonon limited mobility taken from experiment [4] and [22], and the proposed empirical model.
V. CONCLUSION
The limitations of the existing electron-phonon scattering models are explored. It is concluded that the Eeff0.3 trend is
not achieved using these phonon scattering models in the
eff
E range of 0.1-0.5 MV/cm, where surface roughness scattering is negligible. A new empirical scheme is introduced in which the scattering phonon deformation potentials are nonlinearly Ns dependent. Empirical fitted parameters successfully reproduce the reported field and temperature dependence.
REFERENCES
[1] P. J. Price, "Two-Dimensional Electron Transport in
Semiconductor Layers: Phonon Scattering," Annals of Physics, vol. 133, pp. 217-239, 1981.
[2] B. K. Ridley, "The electron-phonon interaction in quasi-two-dimensional semiconductor quantum-well
structures," Journal of Physics C: Solid State Physics, vol. 15, pp. 5899-5917, 1982.
[3] D. K. Ferry and S. M. Goodnick, Transport in Nanostructures: Cambridge University Press, 1999.
[4] S. I. Takagi, J. L. Hoyt, J. J. Welser, and J. F. Gibbons, "Comparative study of phonon-limited mobility of two-dimensional electrons in strained and unstrained Si metal-oxide-semiconductor field-effect transistors," Journal of Applied Physics, vol. 80, pp. 1567-1577, 1996.
[5] C. Jungemann, A. Emunds, and W. L. Engl, "Simulation of linear and nonlinear electron transport in homogeneous silicon inversion layers," Solid-State Electronics, vol. 36, pp. 1529-1540, 1993.
[6] C. Jacoboni and L. Reggiani, "The Monte-Carlo Method for the Solution of Charge Transport in Semiconductors with Applications to Covalent Materials," Reviews of Modern Physics, vol. 55, pp. 645-705, 1983.
[7] S. Yamakawa, H. Ueno, K. Taniguchi, C. Hamaguchi, K. Miyatsuji, K. Masaki, and U. Ravaioli, "Study of interface roughness dependence of electron mobility in Si inversion layers using the Monte Carlo method," Journal of Applied Physics, vol. 79, pp. 911-916, 1996.
[8] D. Esseni, A. Abramo, L. Selmi, and E. Sangiorgi, "Physically Based Modeling of Low Field Electron Mobility in Ultrathin Single- and Double-Gate SOI n-MOSFETs," IEEE
Transactions on Electron Devices, vol. 50, pp. 2445-2455, 2003.
[9] S. J. W.-K. Shih, G. Chindalore, " UTQUANT 2.0 User's Guide," University of Texas Press, Austin, 1997.
[10] H. Ezawa, "Inversion layer mobility with intersubband scattering," Providence, RI, USA, 1976, pp. 25-32.
[11] S. Kawaji, "The two-dimensional lattice scattering mobility in a semiconductor inversion layer," Journal of the Physical Society of Japan, vol. 27, pp. 906-8, 1969.
[12] D. K. Ferry, Semiconductors: Macmillan, 1991.
[13] W. Fawcett and E. G. S. Paige, "Negative Differential Mobility of Electrons in Germanium - Monte Carlo Calculation of Distribution Function, Drift Velocity and Carrier Population in (111) and (100) Minima," Journal of Physics Part C Solid State Physics, vol. 4, pp. 1801-&, 1971.
[14] C. Jacoboni, F. Nava, C. Canali, and G. Ottaviani, "Electron drift velocity and diffusivity in germanium," Physical Review B, vol. 24, p. 1014, 1981.
[15] S.-i. Takagi, A. Toriumi, M. Iwase, and H. Tango, "On the universality of inversion layer mobility in Si MOSFET's: Part I - effects of substrate impurity concentration," IEEE
[image:5.595.47.290.330.505.2]theory for many-valley semiconductors with anisotropic scattering," Physical Review, vol. 101, pp. 944-961, 1956.
[17] M. V. Fischetti and S. E. Laux, "Monte-Carlo Study of Electron-Transport in Silicon Inversion-Layers," Physical Review B, vol. 48, pp. 2244-2274, 1993.
[18] K. Tomizawa, Numerical Simulation of Submicron Semiconductor Devices: Artech House Publishers, 1993.
[19] F. Stern and W. E. Howard, "Properties of Semiconductor Surface Inversion Layers in the Electric Quantum Limit," Physical Review, vol. 163, pp. 816-835, 1967.
[20] J. A. Lopez-Villanueva, F. Gamiz, I. Melchor, and J. A. Jimenez-Tejada, "Density of states of a two-dimensional electron gas including nonparabolicity," Journal of Applied Physics, vol. 75, pp. 4267-4269, 1994.
[21] E. Pop, R. W. Dutton, and K. E. Goodson, "Analytic band Monte Carlo model for electron transport in Si including acoustic and optical phonon dispersion," Journal of Applied Physics, vol. 96, pp. 4998-5005, Nov 1 2004.
[22] Z. Ren, M. Fischetti, E. Gusev, E. Cartier, and M. Chudzik, "Inversion channel mobility in high-k high performance MOSFETs," International Electron Devices Meeting, pp. 793-796, 2003.
[23] C. Y. Wu and G. Thomas, "Two-dimensional electron-lattice scattering in thermally oxidized silicon surface-inversion layers," Physical Review B, vol. 9, pp. 1724-1732, 1974.
[24] S. S. Paul, A. K. Ghorai, and D. P. Bhattacharya, "Lattice scattering of a two-dimensional electron gas at low
![Fig. 1: Simulated and measured mobility from ref [4] versusEeff.](https://thumb-us.123doks.com/thumbv2/123dok_us/1312990.661429/2.595.48.290.309.487/fig-simulated-measured-mobility-ref-versuseeff.webp)