1977--1978
*T. K. WHITAKER, M.SC. (ECON.), D.ECON.SC., LL.D., President of the Institute. *J. F. MEENAN, M.A., B.L., Chairma~ of the Council.
R. D. C. BLACK, PH.D., Professor, Department of Economics, The Queen’s University,
Belfast.
*F. B. CHUBB, M.A., D.PHIL.,Professor, Department of Political Science, Trinity College,
Dublin.
N. J. GIBSON, B.SC. (ECON.), PH.D., Professor, Department of Economics, The New
Univers~ity of Ulster, Coleraine.
PATRICK A. HALL, B.E., M,S., DIP. STAT., Director of Research, Institute of Public
Administration.
¯ *W. A. HONOHAN, M.A., F.I.A.
THE MOST REV. JAMES KAVANAGH, M.A., S.T.L., Bishop of Zerta.
*KIERAN A. KENNEDY, M.ECON.SC., B.PHIL., PH.D.,Director of the Institute. IVOR KENNY, M.A., Director General, Irish Management Institute.
MICHAEL J. KILLEEN, B.A. (MOD.), B.COMM., D.P.A., Managing Director, Industrial
Developn.~ent Authority.
T. P. LINEHAN, B.E., B.SC., Director, Central Statistics Office.
*P. LYNCH, M.A., M.R.I.A., Professor of Political Economy, University College, Dublin. CHARLES MCCARTHY, B.L., Chairman, Human Sciefices Com~nittee.
EUGENE MCCARTHY, M.SC. (ECON.), D.ECON.SC., Federated Union of Employers. *M. D. MCCARTHY, M.A., PH.D., D.SC., President, University College, Cork.
G. A. MEAGHER, B.COMM., D.P.A., Secretary, Department of the Environment. *C. H. MURRAY, LL.D., Governor, Central Bank.
J. C. NAGLE, M.COMM.
D. NEVIN, Assistant General Secretary, Irish Congress of Trade Unions. THE MOST REV. J. NEWMAN, M.A., D.PH., Bishop of Limerick. TADI-IG O CEARBHAILL, Secretary, Department of Labour.
REV. E. F. O’DOHERTY, M.A., B.D., PH.D., Professor, Department of Logic and
Psychology, University College, Dublin.
D. P. O’MAHONY, M.A., PH.D., B.L., Professor, Department of Economics, University
College, Cork.
LABHRAS O NUALLAIN, D.ECON.SC., Professor of Economics, University College,
Galway.
*W:J. L. RYAN, M.A., PH.D., Professor of Political Economy, Trinity College, Dublin. REV. L. RY’AN, M.A., D.D., L.PH.,Professor, St. Patrick’s College, Maynooth. T. WALSH, D.SC., Director, An Foras Taluntais.
*REV. C. K. WARD, B.A., S.T.L., PH.D., Professor, Department of Social Science,
University College, Dublin.
NOEL WHELAN, B.COMM., M.ECON.SC., PH.D., Secretary, Department of Economic
Plimning and Development.
Irish Educational Expenditures
--Past, Present and Future
Copies of this paper may be obtained from The Economic and Social Research Institute (Limited Company No. 18269)
Registered Office: 4 Burlington Road, Dublin 4.
Price £4.50
Irish Educational Expenditures
Past, Present and Future
A. DALE TUSSING
©THE ECONOMIC AND SOCIAL RESEARCH INSTITUTE DUBLIaN, 1978
In conducting the research and writing this paper, I received ad~ce, assist~ ance, and information from a large number of people throughout Ireland. It seems unlikely that, at one sitting, I’ can remember them all; so it is appro-priate to begin my acknowledgements with an apology to thos6 inadvertantly omitted.
My permanent position is Professor of Economics at Syracuse University, in S~racuse, New York~ I spent the academic year 1972173 as the guest of Professor Patrick Lynch, in the Science’Policy Researc.h Centre, University College, Dublin, engaged in work unrelated to the present paper. It is fair to say that Professor Lynch was responsible for my first coming to Ireland, and for this I am eternally grateful. In addition, as an acknowledged authority in the subject matter of this paper, he provMed invaluable aid and aavice in the research for this paper.
In 1975/76, I was able to return to Ireland, to spend fifteen months as visiting Research Professor of Economics at The Economic and Social Research Institute, at which time most of the research for the present paper was conducted. The topic of the paper was suggested by Professor Kieran A. Kennedy, Director of the Institute, who also provided support and encour-agement. Other members of the Institute’s professional staff also provided me with aid and advice. Professor Robert O’Connor, Deputy Director of the Institute, helped with school matters, whilst J. G. Hughes was especially helpful in the areas of migration and population. Both read the entire manu-script, and suggested a great many covection~ and imprgvements: John i Mc.Gregor and Brendan Whelan gave advice, and their own !about on
techm".-cal matters dealing with statistitechm".-cal" technique and computer programming. Finola Kennedy, who had in connection with a previous ESRI paper done some exploratory research in the subject matter of Chapter 5, provided me with her notes and encouraged me to proceed. Agnes Breathnach also pro-vided invaluable assistance in research on that chapter.
Many others, both inside and outside the Institute, provided vital informa-tion, advice, and assistance.‘ Some are acknowledged in fog tnotes. However,
some require special mention here. These include Dr Kenneth Milne, then Secretary, the Church of Ireland General Synod Board of Education; Fr. Leo Quinlan, then Director, the Catholic Primary School Managers’ Association; Fr. John Hughes, S.J.,. then Director, the Secretariat of Catholic Secondary Schools; Roy Johnston, of Trinity College, Dublin;Joy Rudd, then of the Department of Labour, now of Trinity College, Dublin; William Hyland, of
the Department of Education; John Horgan TD; and, finally, Margaret Larminie, a remarkable person (as is suggested by the fact that she was, when this research was conducted, administrative assistant to Fr. Hughes, in the Secretariat of Catholic Secondary Schools, and is now successor to Dr Milne, as Secretary to the Church of Ireland General Synod Board of Education), whose aid and advice were always available and often required.
Chapter. 1
Chapter 2
Chapter 3
CONTENTS
General Summary
Page
11
Introduction
Structure of the System. The Future of Enrolment. The Future of Educational Expenditures. Determinants of Expenditure Differentials. Private Educational Expendi-tures. What is not Covered. Plan of the Work.
16
The Structure of the System
National Schools. Private Primary Schools. Secondary Schools. Vocational Schools. Comprehensive and Community Schools. Third Level.
21
Sources and Resources of the System
The Early Period. The Managerial System. How Could Ireland Afford the System? The End of Cheap
Education. Spartan and Frugal System. The Interest of the Church. Contributions of the Religious. Technical Content. The Recent Period. The Near Future. "Baumol’s Disease."
43
Chapter 4
Chapter 5
Chapter 6.
Enrolments and Expenditures. The Coming Explosion
Enrolments. Population. Participation Rates. Enrolment Numbers. Pupils, Types of School and Teachers.
Expenditures. What can be Done?
Private Current Expenditures on Education
Other Estimates. Household Budget Survey. Investment in Education Estimates. CPSMA Survey. Other CPSMA Data. Convent Primary Schools. Survey Results. Private Primary Schools. Protestant National Schools, 1974175. Private Expenditures. National Schools. National Schools, New Grants Scheme, 1975. Regression Analysis. Secondary Schools, 1974-75. Regression Analysis. Estimated Total.Expenditures on Secondary Schools. Conclusions.
Summary and Concluding Remarks
First Level. Secondary Level. Third Level. Policy Recommendations. Concluding Remarks.
72
115
Adjustments to Published Population Estimates and Predictions
Underestimate of Numbers of Schoolchildren. Decline in Number of Births. Net Migration Assumptions.
APPENDIX 4.B.
Alternative Enrolment Forecasts for i986 from New Population Projections.
APPENDIX 4.C.
Teacher Requirements
National Schools. Second-Level Schools.
179
181
182
APPENDIX 4.D.
Assumptions and Methods used in Illustrative Expenditure Forecast.
184
Table
LIST OF TABLES
Page
2.1
2.3
2.4
2.5
3.1
3.2
3.3
4.2
4,3
Number of Persons Receiving Full-time Education on 1st February 1974, by Type of Institution, and Number as Per Cent of Total.
Types of Expenditure Financed from Public and Private Sources, National Schools, Private Primary Schools, Secondary Schoo!s, Comprehensive, Community and Vocational Schools,
1975/76.
Geographic Distribution of Private Primary Schools and Pupils, by Religious Affiliation, 1975/76.
Secondary Schools by Ownership or Affiliation, 1973/74~ (Unofficial Tabulation).
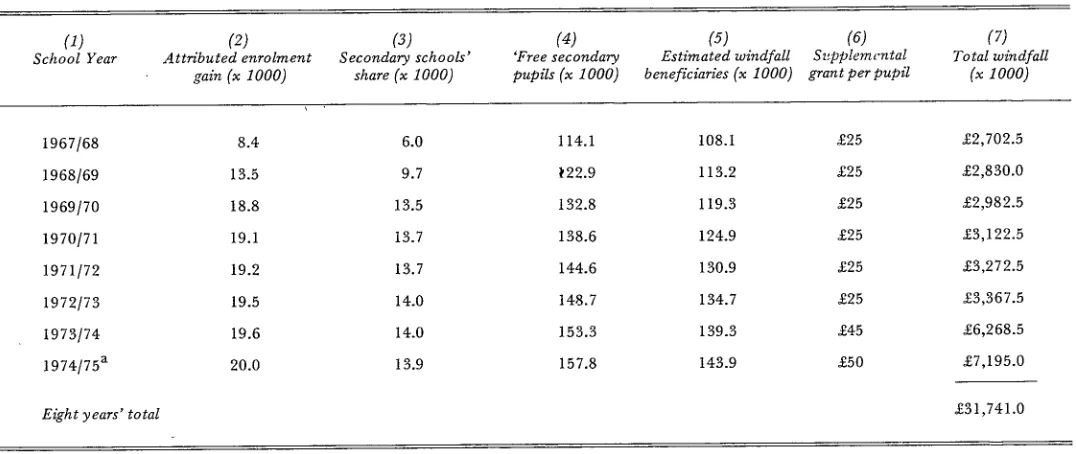
Estimated Windfall Transfers to Families of Secondary School Pupils Benefiting under ’Free Scheme’.
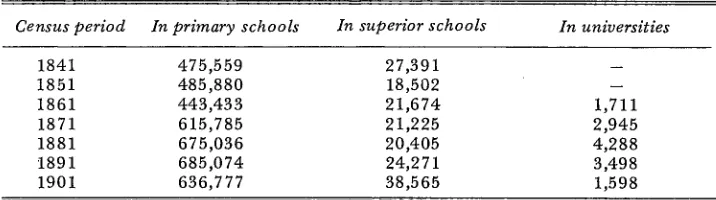
School Enrolments in Ireland (32 Counties), Census Years 1841-1901.
Number and Percentage of Persons Five Years Old and Upwards in Population in Ireland able to Read and Write, Census Years
1841-1911.
Attendance and Enrolment of Children Aged 6 -- 14 in Ireland (26 Counties), 1925/26 -- 1963
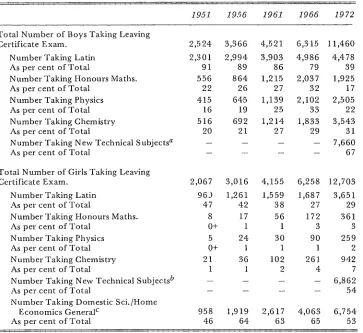
Selected Statistics, Leaving Certificate Examinations, 1951-72.
Estimated Population, 1974, and Predicted Population, 1976, 19_81, and 1986: Selected Ages and Age Groups.
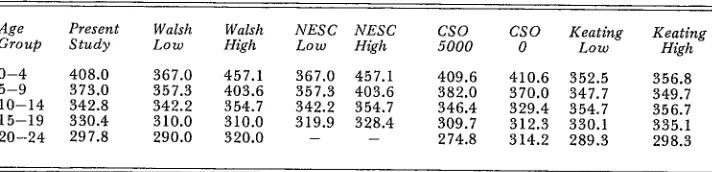
Comparisons of Forecasts of School-age Population, 1986 by Walsh, NESC, CSO and Present Study (x 1,000).
School Participation Rates, First, Second and Third Levels, Actual and Predicted, Seldcted Places and Years.
22
25
28
28
35
53
53
54
71
78
79
4.4
4.5
Full-time School Participation Rates, First, Second arid Third Levels, Ages 15-18, OECD Countries, Selected Years.
Full-time School Participation Rates, First, Second and Third Levels, Ages ¯19-24, OECD Countries, Selected Years.
4.6 Enrolments and School Participation Rates, 1966, 1971, and 1974, and Predicted, 1976, 1981, and 1986, by Age. : 4.7 Predicted SchoolParticipation Rates and Enrolments, 1986,
by Type of School and Age. 4.8
4.9
4.10
4.11
Required Number of Teachers, and Students per Full-time Teacher, 1974 and 1986.
Public Educatioxi Expenditures, Year Ending March 31, 1974 (x £1,000); Current (1974) Prices
Public Education Expenditures, Year Ending March 31, 1974 (x £1,000), Constant (1970) Prices.
Predicted Public Education Expenditures, Calendar Year 1986 (x £1,000), Constant (1970) Prices.
5.1 Education Expenditure as Reported in National Income and
Expenditure 1974 (x £1,000).
5.2 Household Education Expenditure as Reported in Household
Budget Survey 1973.
5.3 Summary Of Results of CPSMA Surveys of National Schools, Selected Areas, Years.
Per-Pup’fl Expenditures, Results of Survey of Non-Aided Primary Schools, by Catholic and Protestant Affiliation, 1974/75.
5.5 Estimated Per-Pupil and Total Expenditures, Non-Aided Primary Schools by Catholic and Protestaiit Affiliation, .1974/75.
5.6 Summary of Results of Survey of Protestant National School Income and Expenditure, 19 74/751
93
94
96
99
101
103
104
107
119
121
125
128
128
Table
5.7
5.8
5.9
Public, Private, and Total Primary School Current Expenditure, Nine Months Ending December 31, 1974, and Twelve Months Ending December 31, 1975, with Public and Private National School Expenditures, Twelve Months Ending March 31, 1974. Summary of Results Of Survey Of National School Income and Expenditure, 1975.
Regressions of 1975 National School Income and Expenditure, Selected Concepts on Selected Independent Variables.
¯ Page
131
133
137
5.10
5.11
Secondary School Expenditure, Various Concepts, 1974/75, 141 from Sample of Audited Accounts, and Supplementary Survey
by Type of School, Totals for the State.
Secondary School Expenditure, Various Concepts, 1974/75, 144 from Sample of Audited Accounts, Day Schools, Free Scheme
Only, by Area.
5.12 Regression Results: Secondary School Expenditures, Various Concepts, Regressed on Selected Independent Variables,
1974/75, All Secondary Schools.
145
5.13 Regression Results: Secondary School Expenditures, Various Concepts, Regressed on Selected Independent Variables,
1974/75, Catholic Sch’ools Only.
149
5.14
5.15
5.16
Regression Results: Secondary School Expenditures, Various Concepts, Regressed on Selected Independent Variables, 1974/75, Catholic Day Schools Only.
Regression Results: Secondary School Expenditures, Various Concepts, Regressed on Selected Independent Variables, 1974/75, Schools Accepting Boarders Only.
+
Regression Results: Secondary School Expenditures, Various Concepts, Regressed on Selected Independent Variables,
1974/75, All Secondary Schools.
153
155
158
5.17 Total Secondary School Expenditures, Various Concepts, 1974/75, Estimated from Estimating Equations in Table 5.16, Together with Numbers of Students, Total and Selected Categories.
5.18 Public, Private, and Total Secondary School Current Expenditure, .Nine Months¯ Ending December 31, 1974 and
Twelve Months Ending December 31, 1975.
160
Figure
IV.1 School Participation Rates, Ages 4 and 5: Actual, 1963-74, and Predicted, i976-86.
IV.2 School Participation Rates, Age 14: Actual, 1963-74, and Predicted, 1976-86.
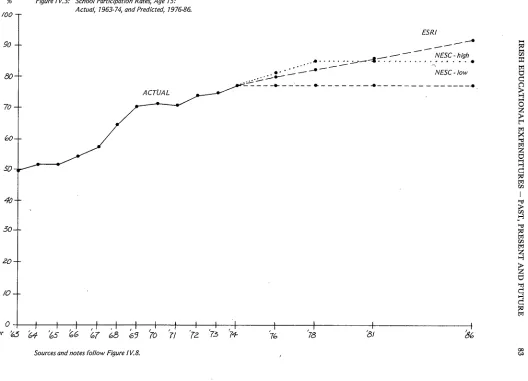
IV.3 School Participation Rates, Age 15: Actual, 1963-74, and Predicted, 1976-86.
IV.4 School Participation Rates, Age 16: Actual, 1963-74, and Predicted, 1976-86.
IV.5 School Participation Rates, Predicted,. 1976-86.
Age 17: Actual, 1963174, and
/
IV.6 School Participation Rates, Age 18: Actual, 1963-74, and Predicted, 1976-86.
IV.7 School Participation Rates, Age 19: Actual, 1963-74, and Predicted, 1976-86.
IV.8 School Participation Rates, Age 20+: Actual, 1963-74, and Predicted, 1976-86.
V.1 Sources of Local Contributions to National School Funds, as Per Cent of Total, 1975.
81
82
83
84
85
General Summary
T
his study examines educational expenditure in the Republic of Ireland. It reviews the structure of the Irish school system, with principal atten-tion to quesatten-tions of finance. It reviews the origins and recent history of the system, to uncover likely sources of changes to come. It examines the future of enrolments and expenditures, and makes recommendations for ways to deal with anticipated pressures and events. It looks for causal determinants of differences in educational expenditures as among regions of the country; the rich and the poor; pupils attending schools under Catholic and Protestant management, etc., and it makes estimates of private (i.e., non-State-financed) expenditure, on first and second-level schooling.In our review of the structure of the system, four points stand out. First, the system is essentially an "aided" one. That is, relatively few schools are owned and operated by public authorities. Most schools are denominational in ownership and management. However, the State, through the general. exchequer, provides the vast bulk of funds. Second, in terms of participation, the system is a pyramid, with a very large base and a very small peak.
Con-sidering first, second, and third-level pupils combined, two-thirds are in primary schools; roughly thirty per cent are in second-level schools; and fewer than four per cent are in third-level institutions.
Third, the school system in the Republic of Ireland is broadly and deeply developed. Participation is approximately one hundred per cent in the primary age groups, and very nearly so in the junior cycle of second level. Participation rates in second-level education exceed those in England and Wales, in Scotland, and in Northern Ireland.
The fourth point regarding structure is of a different order. In our study of financing, we reviewed the effects of the ’free scheme’ for second-level schools, introduced in 1967/68. Our analysis shows that the main effect of the scheme was to relieve a great many parents from paying fees which they would otherwise have had to pay and, hence, to permit windfall increases in the levels of living of these families, rather than to provide the schools with more income. That is, most of the funds did not find their way into the educational system. Between the initiation of the ’free scheme’ and 1974/75, we estimate that £31.7 million had gone in windfall benefits to the parents of Secondary School pupils.
No nation in Europe has a more firmly and deeply established education--al tradition than Ireland, and the highly developed system of today
The schools were for several centuries an important arena for struggles over religion, language, and nationality. These two influences, devout Catholicism and the struggle over foreign rule, individually and in combination, produced today’s aided, ’managerial’ system. It has been remarked that the aided, de-nominational character of the Irish school system, which is, to a considerable extent, a reflection of the Roman Catholic hierarchy’s traditional suspicion of the State and its institutions, serves today, perhaps ironically, more to protect the interests of the five per cent of pupils who are Protestants than to protect Catholic education from State influence.
When Ireland was still essentially a peasant society, every parish had at least one primary school, and some had more than one;the vast majority of children attended these schools, and learned something. Today, with the lowest income levels in the European Economic Community, Ireland has an educational system which is highly developed and, as noted, one whose parti-cipation rates are higher than those in Britain. These are remarkable achieve-meats. The study examines how they came about.
Socially, the system was not developed for the purpose of encouraging economic growth. Individually, its main function was not seen as preparing pupils for careers. Rather, the major functior~ of primary education, and of secondary education also, was religious, moral, and intellectual instruction. One implication is that education of girls has always been considered to be as important as education of boys, thus accounting for higher female (and hencetotal) participation rates than in most other countries Another implication is that instruction has traditionally been overbalanced in favour of such subjects as English literature, religion, Irish and Latin -- highly verbal subjects, with low technical and quantitative content.
How could Ireland afford such a highly developed system? A review of the development of the system suggests four kinds of answers. First, Ireland has operated the schools in a spartan and frugal manner, especially at the primary level, in the National Schools, with historically extremely large classes, taught by poorly paid teachers, in ill-equipped and poorly maintained schools. To say this is not necessarily a criticism; the alternative, in many cases, was not to have schools at all, or (as in other countries) to educate only an elite. Second, the Catholic Church, with its great interest in education, has had a major role in marshalling the nation’s resources for .educational purposes. An extremely large (but unknown) amount of money
for education has come from (or through) the Church.
IRISH EDUCATIONAL EXPENDITURES -- PAST, PRESENT AND FUTURE 13
qualifications) means ’ploughing back’ their salaries into the schools them-selves. In some schools, religious work more hours per day and days per week than lay teachers. In a number of cases, especially in convent schools, religious have served as wholly unpaid assistant teachers.
And fourth, the Irish system of education has economised by having emphasised in the curriculum subjects with low technical content or which for various reasons have required little in the way of costly equipment.
It is worth considering these four sources and resources, first, because they have permitted extensive development of the system; second, because they have vitally influenced the character of Irish education, in nearly every non-financial respect as well; and third, for the very important reason that each of the four appears today either to be fading or to be entirely disappear-ing. As they go, Ireland will be left with a high developed and expensive --school system.
Teachers’ salaries are now almost in line with the rest of Irish incomes. Class sizes are falling, and the standard of amenity in National Schools is rising. There are signs of Church acceptance of an increasing State role in education, and of a corresponding decline in relative Church financial contri-bution. The most dramatic as well as the most easily quantified changes concern the decline in relative numbers of religious teachers. In Secondary ¯Schools, religious as a percentage of all teachers was about 50 per cent as recently as ¯1966; the figure fell to 31 per cent by 1974 (and still lower if Comprehensive and Community School teachers are included); and, we pre-dict, this number will fall to about 20 per cent by 1986, in the absence of a sudden and sharp reversal of existing trends. In National Schools, the per-centage falls from about 23 per cent in 1966 to 15 per cent in 1974, and (we predict) to 9 per cent by 1986. And, finally, the ’arts’ component of Irish education, and in particular the classical component, appears to be in decline, while the technical component is rising. A more costly education, per pupil, is implied.
These are important trends, which will affect not only the financing of education but its content and character as well. In the study, we point to still further reasons, arising out of special historic events, for increases to. occur in per pupil educational costs in the coming decade. All of these
changes appear to be coming at about the same time as enrolments are expected to rise very sharply, thus implying very considerable increases in overall educational expenditures.
populations. The second was the shortfall in births, beginning in 1975, as compared with ’predicted numbers, presumably a consequence of the severe world-wide recession. Third, we rejected the assump’tion, made in several population forecasts, that zero net emigration for the State as a whole implies zero net migration in each age group as well. Instead, our predictions are based on the assumption that recent migration patterns, by age group, will persist in the future, though with moderating force. The results of these assumptions show Ireland to be one of the few.States in Europe with a rapidly rising youth population.
If adequate school pla~es are provided, we expect school participation rates to grow the fastest in senior cycle, second level, and in third level. Between
1974 and 1986, we predict an "increase in enrolment in all three levels of 188,700, or a gain of 23 per cent over the twelve years. This breaks into~ growth of 80,200 (14 per cent growth) in the group aged through 12 years; 36,800 (23 per cent) in the group aged 13 through 15; 35,400 (50 per cent) in the group aged 16 through 18; and 36,300 (159 per cent) in the group aged 19 and over.
The expected increases in per-pupil costs, together with the predicted increases in enrolments, point to explosive growth in educational expendi-tures. First- and second-level total public expenditures, when adjusted .for inflation, are expected almost to double in the twelve years, 1974-1986. In addition, it appears likely that third-level expenditures, also adjusted for inflation, will far more than double over the same time period.
Because’these enrolment and expenditure pressures are liable to precipitate efforts to economise wherever possible, the study calls for a major national debate on educational priorities. It is suggested that careful consideration be given to the differences between public and private benefits from education, and that public funds go primarily for public purposes. A scheme based on this and other principles, and which involves extensive changes in the financ-ing of senior cycle, second-level, and third-level education, is offered, mainly
as background to the hoped-for national debate.
The study concludes with estimates of private expenditures on education, as well as some analysis of the determinants of differentials in per pupil ex-penditures. In 1973/74, we estimate total locally (i.e., privately) financed current expenditures of National Schools to have been approximately £1.4
IRISH EDUCATIONAL EXPENDITURES - PAST, PRESENT AND FUTURE 15
per pupil in National Schools and £95 per pupil in Private Primary Schools. In the calendar year 1975, approximately £50.7 million in public funds were spent on Secondary School education. We estimate private expenditure at £4.6 million, or 8.3 per cent of combined public and private spending of £55.3 million. In these figures, boarding expense, estimated at approximateIy £3.0 million, is excluded. If it were included, the private component would rise to £7.5 million, or 13.0 per cent of total Secondary School expenditures.
Our study shows regional differences in per pupil expenditures in Second-ary School, even when size of school, denominational affiliation, and other influences are held constant. Most striking, perhaps, is the difference within the high and low income sections of Dublin City and Dun Laoghaire. More is spent than elsewhere in the high income parts of Dublin, in Kildare] Wicklow and probably in Laois/Offaly/Carlow. Less is sRent in the lowincome parts of Dublin, in Louth/Longford/Cavan/Mea~r~/Monaghan’ in
Leitrim/Roscomlnon/Mayo/Sligo/Donegal, and (with respect to Catholic
Day Schools only) in Tipperary and probably Clare/Limerick. In addition, significantly more is spent in respect of eduction of Protestant than Catholic Secondary School pupils, even where other variables - including the use of religious teachers, and the presence of a boarding component -- are controlled for.
Our study also shows the influence on per pupil and per school current expenditures of a number of other variables. Of particular interest is the fact that the per cent of lay staff is strongly and positively related to both per pupil and per school expenditures, even where an imputed charge is included for the services of religious. We interpret this as a clear indication, if not measure, of the economic contribution of religious to education in Ireland. In addition, pupils per teacher, an indicator of class size, is positively related to both per school and per pupil expenditures, as regards Catholic day schools. We also find that schools not in the free scheme, i.e., fee-charging schools, spend very considerably more than schools in the scheme, on both per-school and per-pupil bases, even where other influences are controlled for.
In tro duc tion
T~he
purpose of this study is to examine educational expenditures in the J- Republic of Ireland. Educational expenditure data are routinely publish-ed in a humber of places1 , and it is not our purpose to duplicate this effort. In recent years, two studies of education expenditures in Ireland have been published: the important two-volume survey, Investment in Education2, which itself is a milestone in Irish educational history; and, more recently, The National Economic and Social Council, Report No. 12. Our purpose is to add to this literature, by focusing on unknown, unexplored, or ill-understood questions concerning educational expenditures in Ireland.Among these questions are the following:
1. Structure of thesystem.
While the 26-county State of Ireland is small, as is its educational system, the system is none the less exceedingly complex. This is particularly true of the financing of Irish education. Essentially, the system is an ’aided’ one. That is, the educational institutions are not themselves ’public,’ in the usual sense, but they are provided with substantial amounts of public funds. One evident need in the literature of Irish educational expenditures has been a working out Of the essential structure of the system, especially as regards finance, in sufficient detail as to be useful and realistic, and yet without excessive legalistic complexities.
In working out the structure, a number of anomalies -- inefficiencies, inequities, and what can only be called peculiarities -- came to light. These anomalies were not the object of the study; but they are reported also.
2. The future of enrolment.
The implications of population growth have been widely discussed in Ireland since the publication of The National Economic and Social Council Report No. 5. One major purPose of the present study is to investigate the implications of probable future patterns of population growth for enrolment in Irish schools, particularly first and second levels, as well as third level.
In the process of working up enrolment forecasts, we discovered other
1. The Department of Education publishes expenditure data periodically in its Tuarascail StaitistfuiL Educational expenditure data ~e also found in the annual Estimates and in Appropriation Accounts
(see Chapter 4, below); and in National Income and Expenditure (annually) and the Household Budget
Survey (see Chapter 5, below). Information on grants from the Higher.Educa.tion. _Au~ofity. to the
universities and certain other third-level institutions are contained in the Authority s x~t~ rrogress
Report and in its Annual Accounts. All the foregoing are published by the Stationery Office, Dublin.
See also Kevin McDonagh, "The Way the Money Goes," Oideas 17, 1977, which was received after the present manuscript had been completed.
2. Investment in Education, Dublin, Stationery Office, 1965. See Chiipter 3, below.
IRISH EDUCATIONAL EXPENDITURES -- PAST, PRESENT AND FUTURE 17
interesting phenomena, such as the (then) unexpectedly large occurrence of child immigration,3 which has obvious significance for enrolments.
3. The future of educational expenditures.
The large expected growth in child population in Ireland has obvious and important implications for educational expenditures. Our considerations of the subject of the future of educational expenditures turned up a number of other important sources of rather explosive potential future growth in the demand for resources.
To put the matter most succinctly, Ireland has had, for a variety of historic reasons, an unusually cheap school system. Its cheapness, in turn, encouraged a deep and broad expansion of the system. But the historic reasons for its cheapness are, one by one, falling away, threatening to leave Ireland with a highly developed, and extremely costly, education system, at just the same
time as its largest enrolment growth ever is occuring. For example, the decline in religious vocations of the recent past is now catching up with the school system, implying higher expenditures in a variety of ways. For another, Irish education has traditionally been high on verbal and low on technical content; but today’s labour markets require school leavers with at least technical potential, if not technical skills.
On top of these forces, there are special circumstances applicable only in the next few years, which will account for additional cost rises. Among these are the coming of equal pay in education, and a ’bulge’ in the age distribution of second-level teachers, which will travel up the increments structure and bring disproportionately large salary increases.
4. Determinants of expenditure differentials.
It was decided to use as much cross-sectional data on the schools as was available, in order to see whether statistical methods would indicate sources of differences in educational expenditures. Our questions were such as these: Are there regional variations in per-pupil school expenditures? If so, are these explained by region (and, by implication, by regional income differ-ences); or are they explained by other variables, such as school size, religious affiliation, extent of boarding function, etc.? Is more spent per pupil in Private Primary Schools than in National Schools? In Protestant than Catholic Schools? And so on. Our regression analysis also permits us to examine the net economic contribution of religious teachers.
Our purpose in the regression analysis is not hypothesis testing per se. Instead, it provides us with a more useful and rigorous way of reading the data. The method permits us to look at the relationship between expenditures
3. The Population Office of the Central Statistics Office makes intercensal population estimates by age group. The Department of Education collects data on school enrolment annually, by year of age. We discovered that in many age groups, actual reported enrolments exceeded estimated numbers of cl/fldren in the State; and, moreover, annual increases in school enrolments in age cohorts wei’e fairly
and each of a number of other variables, whilst holding constant (’controlling for’) the influence of the other variables. Thus it is a high-powered alternative to tables with endless cross-tabulations. As there is no record of any prior ’determinants’ studies of Irish educational expenditures, the results are of considerable interest. The data include some heretofore unavailable informa-tion on private sources of funds, adding further novelty and interest to the material. We examine not only the determinants.of per-school and per-pupil school expenditures, but also the determinants of per-pupil and per-school expenditures out of non-public funds, which reflects the differential ability of schools in different circumstances to raise and spend funds from other sources.
5. Private educational expenditures.
There are virtually no data on private educational expenditures. All education expenditure data published on a regular basis occurs as a
by-product of budgeting for and operating the system. None of it is specially collected for purposes of publication. As a consequence, public education expenditure becomes a proxy for total, social educational expenditure. Of course, this is true not only in the Republic of Ireland, but in many, perhaps the majority, of other countries. What is different is that in most of these other countries, public expenditure is a good proxy for total expenditure, as their school ¯systems are primarily public. In Ireland, publicly-owned, operated, and supported schools are exceptional; as noted, the system is an ’aided’ one. This means, at least potentially, that public expenditure is not a good surrogate for total expenditure.
We set out to gather information about private expenditure of three sorts: the local contribution to the operating costs of National Schools; the total costs of operating Private Primary Schools, which receive no public funds; and the total expenditures, less State grants, of Secondary Schools. We were provided access to the audited accounts of Secondary Schools affiliated with the Catholic .Secretariat of Secondary Schools. In addition, valuable survey. data were given us by the Catholic Primary ScHool Managers’ Association, and the Conference of Convent Primary Schools. These data were supple-mented by our own surveys of income and expenditures of Catholic National Schools, Protestant National Schools, Private Primary Schools, lay Catholic Secondary Schools, and Protestant and Jewish Secondary Schools.
What is not Covered
There still remains much primary work to be done on education expendi-tures in Ireland. Limitations on time, resources, and data, together with our own set of priorities, precluded examination of a number of important sub-jects.
IRISH EDUCATIONAL EXPENDITURES -- PAST, PRESENT AND FUTURE 19
survey, or a considerable improvement in household income data in conjunc-tion with educaconjunc-tional attainment data. Some such kind of survey is well worth doing, to focus primarily on the question: What are the educational determinants, controlling for background (socioeconomic status, sex, region, etc.) variables, of success in the labour market? For example, is the recent criticism of the ’arts’ emphasis in Irish education justified? That is, what is the differential return to different kinds of education in Ireland?
We have not been able to develop estimates of future educational require-ments in the labour force, though we devoted some time and effort to the question. In order to develop such estimates, one requires fairly accurate forecasts of the pattern of future economic growth; and no such forecasts were available, though we were led to believe that they exist, in the Depart-ment of Finance. Moreover, in spite of the criticism we heard repeatedly of the curricula of the Irish educational system, we arrrived at the judgement that product demand, both domestic and export, together with macro-economic problems, constitute the present limits to Irish macro-economic growth, and that educational requirements scarcely enter in. That is, restructuring of Irish education along lines of forecast requirements seems unlikely to influence growth or employment significantly.
None the less, an improved use of both educational and labour resources could be brought about by an improved monitoring of current labour market developments, and perhaps anticipation of specific, near-term developments, and communication of these to the schools and universities, and through them to the students. The openness of the Irish economy, especially as regards migration, has permitted education and the labour market to develop somewhat independently. Where the education system provides trained personnel not needed by the economy, they can simply emigrate. Where the economy needs skills n6t provided by the education system, they can be attracted from abroad. While some such cross-emigrational pattern is inevit-able in any case, and perhaps even desirinevit-able, there is very considerinevit-able latitude for bringing the education system and the economy into harmony. Complete success in this endeavour may require educational institutions to surrender some of their independence; but some progress could be made simply by the Department of Labour providing all second- and third-level institutions with quarterly or semi-annual reviews of prospects and problems in the labour market-areas with inadequate or excessive supply, relative to demand.
Irish educational resources, something which has ne/,er been done (though
parts of the system have been subject to very searching examination); and
such an assessment would be invaluable to the makers of educational
/ .
decisions and policies, not only in the government, but in the educatxonal institutions, and in the country at large.
Plan of the Work
An attempt has been made to make this study useful to specialists, and accessible and, possibly, even interesting to non-specialists. Thus an effort is made to explain the analytical and statistical techniques used. Similarly, the study is addressed primarily to the Irish reader, but an effort has been made, in terms of the discussion of the history, curriculum, institutional structure, etc., to make the study accessible and meaningful to the non-Irish reader.
The plan of the work is as follows:
Chapter 2 is titled, ’The Structure of the System.’ It discusses each major type of educational institution, at each level, with particular attention to the role of public and private funds. Chapter 2 also includes an analysis of the distributional consequences of the ’free scheme’ in second-level education.
Chapter ] concerns ’Sources and Resources of the System.’ It is argued~n Chapter 3 that the characteristics, resources, and circumstances which made Irish education cheap and which, hence, induced its very considerable development, are in the main disappearing. The historical roots of a number of the characteristics of the unique Irish school system are also surveyed in the process. Recent educational policy changes are also discussed.
Chapter 4 deals with ’Enrolments and Expenditures: the Coming Explo-sion.’ In order to forecast school enrolments in all three levels, Chapter 4 examines and modifies population projections prepared by others, and by predicting a future pattern of school participation rates, produces predicted enrolments. An illustrative plausible pattern of teacher requirements and expenditures is also set forth. As the title of the chapter suggests, the next decade is seen to be one of explosive growth in per pupil costs, in enrolments, ,,and inthe product of the two, educational expenditu_res.
Chapter 5 is titled, ’Private Current Expenditures on Education.’ It presents estimates of total current expenditures on private, non-aided, primary schools; total and private National School current expenditures; and total and private Secondary School expenditures. This chapter alsoexamines educational expenditure data as published in National Income and
Expendi-ture, and the Household Budget Survey. And Chapter 5 also presents the
results of cross-sectional multiple regression analysis of Secondary School expenditures, under the following headings: all Secondary Schools; Catholic Secondary Schools; Catholic day Secondary Schools; and all boarding Secondary Schools.
Chapter 2
The Structure of the System
T
he Irish system of education has points of difference and similarity to systems in other countries. In this chapter the system will be described and discussed, with special focus on economic aspects, particularly sources and use of funds.Like most education systems, the Irish system can be described as consist-ing of three levels:
Fb’st level (or primary), beginning at the age of six (the age of compulsory
attendance) and consisting of six years of study (in addition to which there is, usually in the same schools, a non-compulsory pre-primary or inf~mts’ division beginning at the age of four attended by some 85 per cent of children aged 4 and 5);
Second level (or post-primary - the term ’secondary’ is reserved in the Irish
system for a particular type of second level institution), consisting of two sub-levels or ’cycles’, viz: \
Junior cycle normally requiring three years of study (compulsory schooling
ends at age 15), culminating in examinations for the Group Certificate after two years, and/or the Intermediate Certificate after three years’ study ; and
Senior cycle, normally requiring two years’ study beyond the Intermediate
Certificate, and culminating in the Leaving Certzficate;
Third level (or post-secondary), whose time requirements vary, depending on
the degree or qualification sought.
The schools making up these categories are listed, with their 1973/74 enrol-ments4 and relative importance in the system, in Table 2.1. While a great many types of institutions are listed, it is evident from Table 2.1 that only five types merit extended attention on grounds of size alone: National Schools, which enrolled 62.8 per cent of the full-time pupils at all levels in the StateS; Secondary Schools, which between junior and senior cycle enrolled 20.4 per cent; Vocational Schools, which enrolled 7.4 per cent in junior and senior cycles; Private Primary Schools, which enrolled 2.9 per
4. As this is written, the most recent published data on enrolments, etc. is for 1973/74 as con-tained in the Department of Education’s Tuarascail StaitistLd, which ceased annual publication in 1967/68 and has been published (with annual data) only twice in the subsequent six years.
5. If Secondary Tops (second-level courses offered in National Schools) are included, the figure rises to 63.1 per cent.
Table 2.1 : Number of persons receiving full-time education on 1st February 1974,
by type of institution, and number as per cent of total
Type of bzstitution Number attending As per cent of students, As per cent of at same levele students, all levelse First Level:
National Schools 512,461
Special Schools 7,018
Special Classes 1,689
Private Primary Schools 23,260
Others 11
To tal first level 544,437
Second Level:
Secondary Schools, Junior Cycle 114,916 Secondary Schools, Senior Cycle 51,680 Secondary Tops, Junior Cycle 1,924 Secondary Tops, Senior Cycle 325 Comprehensive Schools, Jr. Cy. 4,322 Comprehensive Schools, Sr. Cy. 1,374 Community Schools, Jr. Cycle 3,154 Community Schools, Sr. Cycle 956 Vocational Schools, Jr. Cycle 48,927 Vocational Schools, Sr. Cycle
General 5,757
Secretarial 3,997
Technical 353
b
Regional Technica! Colleges 526
Other Aided 1,416
Non-Aidedc 2,030
Total second level: 241,679
Third Level:
Universities ,20,360
Aided Teacher Trainingd 2,368
Vocational Teclmological 2,907
Regional Technical Colleges 1,600
Other Aided 1,491
Non-Aided Teacher Training . 232
Non-Aided Religious 787
Total third level: 29,640
Grand Total: 815,763
94.1 62.8 1.3 0.9 0.3 0.2 4.3 2.9 0a 0a 100.0 66.7 47.5 21.4 0.8 0.1 1.8 0.6 1.3 0.4 20.2 2.4 1.7 0.1 0.2 0.6 0.8 100.0 68.7 8.0 9.8 5.4 5.0 0.8 2.7 100.0 14.1 6.3 0.2 0a 0.5 0.2 0.4 0.1 6.0 0.7 0.5 0a 0.1 0.2 0.2 29.6 2.5 0.3 0.4 0.2 0.2 0a 0.1 3.6 100.0
Source: Dept. of Education, Statistical Report, 1972173, 1973]74.
Notes: a: less than 0.05 per cent
b: General, 201 pupils; secretarial, 165; technical, 160. c: Commercial, 1,738 pupilsi religious, 20; radio schools, 272.
IRISH EDUCATIONAL EXPENDITURES -- PAST, PRESENT AND FUTURE 28
cent; and Universities, which enrolled 2.5 per cent. In addition, it is appro-priate to attend somewhat to Comprehensive and Community Schools, and Regional Technical Colleges, because of their rapid rates of recent (and anticipated future) enrolment growth. The other types of institutions will not receive much discussion below. In their relationship to public authorities, the institutions listed in Table 2.1 can be described as in three categories: public, aided; and non-aided. The non-aided institutions in Table 2.1 are the Private Primary Schools and the handful of institutions listed as ’non-aided’ in second and third levels. All of these combined enrolled only about 3 per cent of all pupils, and their share is declining. Comprehensive, Community, and Vocational Schools and Regional Technical Colleges, among them enroll-ing fewer than 10 per cent of all students, may be described as public institutions. More than 87 per cent of pupils, then, attend ’aided’ institutions. It is fair, then, to describe the system as essentially a State-aided one. In important respects, however, the structure of the system has been such as to blur the distinction between public and private, and this blurring regret-tably has also affected the nature Of statistical data available. The domplex interweaving of publ-ic and private is summarised in Table 2.2 and is suggested by a description of the system.
National Schools: With minor exceptions, the National Schools are owned
direct appointees. To muddy the waters still further, the teachers public employees in private institutions - are appointed by the Committees of Management. The Department, in negotiation with INTO (The Irish National Teachers’ Organisation) sets salaries. It als0 establishes the curriculum and must approve all text books used.
The Constitution (Article 44.4) guarantees that "The Stateshall provide for free primary education". Current provisions, however, require substantial amounts of expenditure on National Schools from ’local sources’, i.e., raised by Committees of Management from sources other than the Exchequer. Since 1975, the State provides a grant of £6.00 per pupil, provided that there is also a contribution of at least £1.5.0 per pupil from local sources. At time of writing the scheme has been in effect only one school year, little is known about how the £1.50 is raised;but from our own survey it is indicated that many schools ask parents to ’contribute’ £1.50 per pupil.6 Moreover, local sources must pay about 15 per cent on average, of school construction costs and 100 per cent of site acquisition costs. There is nothing in the-Constitution or statute which limits organisation of National Schools to religious bodies; but these burdensome local costs of establishing a school make it difficult for an unaffiliated group of local parents or neighbours to organise a scho01.7 In addition, it is not automatic that a new school is recognised as a National School by the Minister. (Prior to this scheme, the State paid grants toward cleaning, heating, and painting of schools, and any shortfall in covering the costs of running the school was made up by local Sources; the new scheme required a local contribution that had in many cases
already regularly been made.)s
There are no centrally-collected data on privately-raised funds for current National School expenditures or on actual school expenditures (as opposed to State expenditures); and the data on privately financed portions of capital expenditures are limited to the ’matching’ portion of construction expense. These gaps in the published data are particularly serious because the system is an aided rather than a public one. Prior to 1975, National School Managers were not even required to keep separate books as between school and parish (or religious community) accounts; the new requirement that separate accounts, subject to inspection and audit, be kept, will make it possible in
6. The survey, which is discussed in Chapter 5, indicates that just under 20 per cent of local funds are from parents’ or pupils’ contributions.
7. There might seem to be antagonism between these required forms of local contribution and the constitutional guarantee of free primary education. Evidently the interpretation of the statement, ’The¯
" " ’ " t
State shall prowde for free primary education, m tha the State will assure that every child can without
charge receive a primary education, not that the State wiU necessarily pay for that education. So long
as a free primary education is available to all children, the constitutional guarantee may b said to be
full’flied, at least according to this interpretation.
8. According to a 1973/74 sample survey of Catholic National Schools, government grants under ¯ the old system covered only about 20 per cent of the year’s expenditures for medium and large schools
(six to nineteen classrooms), about 25per cent for smaller schools and about 16 per cent for larger schools. The survey was conducted by Rev. Leo Qululan, Secretary of the Catholic Primary School Managers’ Association and the results are published under the heading, ’The Cost of Running a
Table 2.2: Types of expenditure financed from public and private sources, national schools, private primary schools,
secondary schools, comprehensive, community, and vocational schools, 1975/76
Current expense Capital expense Type of school
Public Private Public Private
Classification National schools Teacher salaries. Current expense in excess of grant 84 per cent of construction costsa 16 per cent of construction costsa; £6 per pupil per year toward other aid, equal to at least £1.50 per 100 per cent of site acquisition costs
current expenses, pupil per year.
Capitation National schools
Private primary schools
Free secondary schools (Catholic)
Fee-charging secondary schools (Catholic)
Secondary schools (Protestant)
Comprehensive and Community schoolsc (State schools)
Vocational schools (Vocational Education Committee schools)
Same as above in all respects except additional capitation grant (see text) paid to school instead of direct payment of teacher salaries.
None
’Incremental’ teacher salary and restmnsibility allowances. Capitation Grant of£18-£24 per pupil in attendance previous year; plus
Supplemental grant of £50 per pupil in current year (amount payable for boarding students in low-fee (£265 boarding fees) boarding schools).
Incremental salary and Capitation grant, same as preceding, but no Supplemental grant.
Incremental salary and Capitation grant, same as Catholic schools, above.
Block grant equivalent in total funds to Supplemental grant, given to inter-church committee which distributes aid according to pupil means.
All current expenditures paid by State
Of all current expenditure, for salaries, administration, main-tenance, or whatever purpose undertaken by VEC’s, the sources are as follows:
Rates, approximately 13 per cent
Grant from Department of Education to VEC’s, 85 per cent
All private
’School salary’, £400 p.a. All current expense in excess of grant aid.
Same as preceding
Same as Catholic schools
No private expendituresd
Fees - collected only from post-secondary students and evening adult students, about 2 per cent
Same as above
None
80 per cent of building equip-ment costs.
All private
20 per cent of building, equipmetat costs; 100 per cent of site costs;
I00 per cent of costs of boarding facilities
These schools eligible for building grants same as preceding, but in practice less often receive them.
These schools eligible for building grants but do not always agree to design specifications and hence do not always receive aid. Otherwise, same as Free secondary schools (Catholic) above.
All capital expenditures are by State.
All capital expenditures are bY State
Nominal private expenditures by religious orders
Note: ’Public’ expenditures are those financed by taxes, rates, or borrowing by the state or by local authorities; ’private’ expenditures are those financed by fees, contributions, fund-raising events, etc., and by grants, subventions, etc. from church bodies, religious orders, etc.
Foo tno tes: a: Figures given are effective average; State share can vary between 66 per cent and 99 per cent. b: Depending on number of students, number of attendances per year
c: There are differences in ownership, organisation between Comprehensive and Community schools but they are similar with regard to matters contained in this Table.
future to collect and publish data on school expendittlres and on local sources. There has been no announcement that such data collection is con-templated, but it is most desirable that the State begin to collect and publish data on school expenditure. In 1978 it is none too soon to begin to report such fundamental type of data. Our own estimates of private expenditure on first and second-level education are reported in Chapter 5.
In 1973/74, 150,482 pupils or 29.4 per cent of the total attended convent or monastery National Schools and of these 52,227 (or 10.2 per cent of all National School pupils) attended institutions in which the State paid a capitation grant to the school, rather than paying salaries to the teacher. (In
that year the grant ranged from £41.80 to £43.27V2 on the first 100 pupils and from £27.92V2 to £29.40 on the remainder.) The capitation option arose originally out of the needs of religious whose vow of poverty prevented them from taking salary cheques; in addition, these schools have been able to employ teaching religious who lack full qualifications. The 140 teachers in capitation monastery and convent schools in 1973/74 are presumably not even de facto State employees;that is, the State does not, either as employer or ’agent’ give them salary cheques.
The State bears the full expense for operating a small number of schools. There are eight ’Model National Schools’ managed just as others are, but fully financed by the State.9
Table 2.1 also indicates a-number of pupils attending Special Schools and Classes: these are for such handicapped as deaf, blind, emotionally disturbed, physically handicapped, and mentally impaired.
Private Primary Schools receive no State funds of any kind. As a
con-sequence, the State collects no data concerning them, except their enrolments. Thus, there are no available data on either their current or their capital expendituresJ° And, accordingly, there is no State control or supelMsion over curriculum, teacher qualifications, number of hours per day or days per year in instruction, etc. Even in these most private of private-sector schools, however, there is a certain blurring with the public and aided sectors, in that the vast majority of private primary schools are operated jointly, and share school grounds, with National Schools or aided Secondary Schools. More-over, in many cases parents are said to eniol children in these Private Primary Schools, rightly or wrongly, to be more certain of securing a place in a Secondary School when the child is older. Thus the fees they pay are viewed by them as an entry charge which will subsequently gain the child access to a second-level education. Not only are Secondary School places limited in
9. These eight Model Schools are remnants of the system established here between 1831 and 186i by the Board of National Education, which were the first public primary schools established anywhere under the Crown, and are regarded as a ’pilot’ for the British system. They were to be multi-denomi-national in character. The Irish Catholic Hierarchy opposed the Model Schools, which eventually numbered 28, both on the grounds of their mulfi-denominationality and on the grounds that they
were State schools. They were boycotted by Catholics and ultimately the National Schools’ system under denominational management was established. See Chapter 3.
28 THE ECONOMIC AND SOCIAL RESEARCH INSTITUTE
[image:29.485.11.441.32.580.2]some areas, but some Secondary Schools, even in the ’free scheme’ will not admit National School pupils. Pupils from lay National Schools have the lowest rate of entry into Secondary School.I: In some cases, religious orders, who run most Private Primary Schools, are said to use superannuated teachers from other schools in their Private Primary Schools, thus implying another link.
Table 2.3: Geographic distribution of private prima~ schools and pupils,
by religious affiliation, 19 75- 76
Place-County
Number of schools Number of pupils
Catholic Protestant Total Catholic Protestant Total Schools Schools Schools Schools Schools Pupils
Dublin 70 9 79 15,070 1,158 16,228
Louth/Kildare/
Wicklow 12 1 13 " * * 2,259
Cork 11 1 12 * * 1,858
Rest of Country 15 2 17 * * 1,348
Total 108 13 121 20,355 1,338 21,693 *Withlaeld to preserve confidentiality.
Source: Department of Education
Table 2.4: Secondary schools by ownership or affiliation, 1973/74
(unofficial tabulation)
Ownership, affiliation No. of schools Ownership, affiliation No. of schools
Orders of Nuns
Sisters of Mercy Presentation Sisters Loreto Sisters
Irish Sisters of Charity
Holy Faith Sisters Dominican Sisters Others, fewer than I0 each
Total
Orders of Brothers
Christian Brothers De La Salle Brothers Presentation Brothers Others, fewer than l0 each
Total
Orders of Priests
108 Society of Jesus 4
53 Holy Ghost Fathers 6
22 Others, fewer than 5 each 24
14
Total 34
12 10
81 Diocesan Colleges, total 35
3OO
Lay Catholic, total 32
85
20 Protestant, total 26
11
14 Jewish 1
130 Total 558
Source: Compiled from information furnished by Catholic Secondary Schools’ Secretariat.
As Table 2.1 indicates, the Private Primary Schools enrolled only 4.3 per cent of first level pupils, and but 2.9 per cent of all pupils, in 1973/74. More-over, both percentages have been, and seem destined to continue, dropping. But they are none the less important institutions. Table 2.1 also shows that they enrolled more students in 1973/7.4 than the Universities, a somewhat striking statistic. Table 2.3 which is based on 1975/76 data, shows the Private Primary Schools to be clustered in two main areas: County Dublin and its immediate environs, Counties Louth, Wicklow and Kildare, and to a lesser extent in County Cork. Indeed, 65 per cent of the schools and 75 per cent of the pupils are in County Dublin alone, and 76 per cent of the schools and 85 per cent of the pupils are in Dublin, Louth, Wicklow "and Kildare. When County Cork is added, the figures rise to 86 per cent and 94 per cent of the pupils. Three reasons might be offered for this concentration. First, these areas contain more wealthy persons who might be able to afford fees more easily. Secondly, certain middle-class families, especially in Dublin City, might not wish their children to mix with economically disadvantaged and educationally deprived children, who would be found in a relatively greater concentration in National Schools in those areas. Thirdly, there is more demand for Secondary School places relative to supply, and hence more competition for entry, in these areas than in the rest of the ~ountry, and hence more motivation for parents to seek secure places by enrolling children in affiliated Privat~ Primary Schools. Whatever the reason, these schools obviously enrol a much larger percentage of all first level pupils in Dublin, its environs, and Cork, than would be suggested by the 4.3 per cent figure for the State.
Secondary Schools: Until the fairly reccnt introduction of Comprehensive
and Community Schools, second-level schooling in the Republic of Ireland had been (with small exceptions) either in voluntary Secondary Schools, which have emphasised academic or ’arts’ education, similar to that in gram-mar schools in other countries, and Vocational Schools, which have emphasised trade and technical education. In 1963/64, Secondary Schools (with Secondary Tops) enrolled 73 per cent of all second-level pupils; in
1973/74, the figure was 70 per centJ2 Since Secondary School leavers have
traditionally been stronger in verbal areas (English, Irish, Latin, history, non-laboratory science) than in technical areas, the domination of second level by these schools has meant an ’arts’ emphasis greater in Ireland than else-where in Europe, and one which has been the object of considerable criticism. Critics contend that the system has traditionally produced ample numbers of able candidates for such positions as civil servant or bank clerk but too
3O THE ECONOMIC AND SOCIAL RESEARCH INSTITUTE
few technically and technologically competent leavers. The curriculum also strongly reflects University matriculation requirements.
¯ In the event, second-level education began to change in a number of respects, essentially beginning in the late 1960s. Vocational Schools’ curricula were expanded to include Intermediate and Leaving Certificate courses (q.v., below), and in theory a vocational pupil can today take a programme of study similar to that found in Secondary Schools. The examinations them-selves, as well as the Secondary School curriculum, began to be altered, to
provide for more technical content, a point to which we shall return in the next chapter. And Comprehensive and Community Schools, incorporating
both ’arts’ and ’vocational’ education, were established for the first time. Secondary Schools are denominational with minor exceptions -- e.g., three schools are regarded as ’non-denominational Protestant’ - and are of five
general types. The most numerous are owned and maintained by Catholic¯ religious orders, who have long dominated Irish second-level education. In 1973/74, 443 of a total of 534 Secondary Schools accounted for were operated by religious. Second, there are parochial or diocesan schools, called "Diocesan Colleges" of which there were 31 in 1973/74, which were original-ly established to prepare boys for seminary, and still serve that purpose. Third, there were 33 ’lay Catholic’ Secondary Schools, owned and operated, in effect, as businesses by individuals.13 Fourth, there were 26 Protestant Secondary Schools, many of them associated with the Church of Ireland. And fifth, there is one Jewish Secondary School, in Dublin.
An unofficial tabulation indicating ownership or affiliation of these Secondary Schools is provided in Table 2.4, which shows that three orders --the Sisters of Mercy, --the Presentation Sisters, and --the Christian Bro--thers, among them maintained 246 Secondary Schools, or 46 per cent of the total. Accordingly, these three orders have had, and continue to have, an exceeding-ly important educational and cultural impact in Ireland. Table 2.4 indicates far more schools run by orders of nuns than of brothers. The former, unlike the latter, often tend to accept both boys and girls. Moreover, most of the schools operated by orders of priests and the overwhelming majority of Diocesan Colleges serve only boys.14 As might be expected, there is a degree of controversy over the domination of Secondary education by religious orders. The issues raised include alleged or real religious contribution to sectarian nationalist traditions, to excessive ’arts’ (as contrasted with tech-nical) emphasis in the curriculum, and to Church domination of Irish Society. We do not treat any of these issues in this study. There has been a certain amount of economic significance of the heavy participation of religious, not only in Secondary Schools, but in primary education as well, on whichwe
13. That is, they took a proprietary form; no invidioiJs connotation is intended.
do comment. On the one hand, the religious as individuals have had what might be called privileged positions with regard to certain matters. There is a built-in bias in their favour in recruitment, not only in Secondary but in
National Schools, and the least qualified religious entering teaching is typically less able than the least qualified lay person. In time of recession and depression, this bias has meant that religious are fairly certain of employ-ment, while lay people have far greater difficulty finding teaching posts. In Secondary Schools run by religious, the highest position available to lay teachers is that of Vice Principal, as Principalships, with higher pay and responsibility, almost always are reserved for religious,is On the other hand, there is no doubt that the religious, and in particular members of the three large teaching orders already referred to, have made very substantial personal sacrifices in order, in effect, to ’subsidise’ the nation in the education of its children, particularly in second level. Since the number of teaching religious are today in decline, meaning in effect that this ’subsidy’ is being withdrawn, we will have occasion further to consider the economic contribution of the religious.
It is impossible safely to generalise about schools operated by the religious. In some, members of religious orders live what appear to "the outsider to be very comfortable lives indeed, with extensive grounds and well-cared for gardens, and buildings of great beauty and character. Other religious evident-ly have lived frugalevident-ly, both out of conviction and to devote the saved resources to education. Some have endeavoured to serve the poor. Others, especially the orders of priests, have concentrated on the relatively ~lite, and their schools, in the main, have not joined the ’free scheme’ to which refer-ence is made below.
While it can be stated that the exchequer Contributed to Secondary Schools in five clearcut defined ways, the extent to which finance of Second-ary Schools is ’public’ or ’private’ is an exceedingly complex matter, and there is no generally applicable answer. Each teacher receives a ’school salary’, in recent years set at £400 per year, paid by the school and not the State. In addition, the State directly pays recognised, qualified teachers a so-called ’incremental salary’, ranging in 1973/74 from £911 to £1,821 for women andunmarried men, and £1,150 to £2,341 for married men, with additional allowances for children, special qualifications, and duties. These added responsibility allowances loom large in arriving at total salaries. Obviously, the ’school salary’, while not trivial, is far smaller than the so-called ’incremental salary’. The State has historically provided the Schools with aid in the form of grants, as discussed presently, from which the ’school salary’ i~ paid, so both parts have a State origin. The reason for dividing the salary in this fashion and for calling the larger State share ’incremental’, is to support the theory that Secondary teachers are private not public employees.
32 THE,ECONOMIC AND SOCIAL RESEARCH INSTITUTE
State grants to Secondary Schools for running expenses are in two parts. The first is the so-called ’capitation grant’, paid to all recognised Secondary Schools, which in effect means all Secondary Schools. In 1975/76, as shown in Table 2.2, this was set at £18-£24 per pupil (slightly more where instruc-tion is in the medium of Irish). The grant is received in the year following their attendance. All types of schools listed in Table 2.4 are eligible to receive this aid; irrespective of form of ownership (e.g., including ’lay’ or proprietary schools), and irrespective of whether they charge fees. Thus Some rather 6hte institutions which charge fairly high fees and which would be wholly private in many :countries do receive public funds in the Republic of Ireland, as well as being favoured by State payment of incremental ~alaries. In 1967/68 the Department of Education introduced the so-called ’scheme for free post-primary education’, whereby a supplementary grant (originally
£15/£25 per pupil; £50 in 1975/76) would be paid to all schools willing to
forgo fees. (Grants are also paid on behalf of boarding pupils at so-called ’low fee’ boarding schOols~ defined in i975]76 as those with boarding fees
of no more than £265 per year.) In 1975/76, 72 of the 534 schools account-ed for in Table 2.4 chargaccount-ed fees. These includaccount-ed all Protestant Schools, which, however, had a variant on the ’free scheme’ discussed later. Unlike the capitation grants, the in-lieu-of-fees grants are payable on this year’s, rather than last year’s, enrolments.
It will be noted that neither the capitation grant nor the supplemental grant in lieu of tuition is based in any way on outlays or on a matching
’local’ contribution. Thus it is possible that some schools, with higher than average costs, cannot function without additional private sources of funds. Others may do fairly well, and indeed may, in a number of years, operate at a surplus,t6 It is hence impossible to generalise concerning the mix of public and private funds in secondary education.
The situation involving the religious is one step more complex. Until ’1974/75, most of the schools run by religious orders (withthe notable exception of ChristianBrothers’ schools) operated on a financial system which Father John Hughes, S.J., until recently Director of the Secretariat of Catholic Secondary Schools, has called ’the bucket’: all funds coming in were seemingly poured into one bucket, and all payments came out of that, same bucket, irrespective of whether they were on the account Of the school or the religious community. No line was drawn between the community and the school. While agreement among the Association of Secondary Teachers’ Ireland (ASTI), the Secondary Schools, and the Department of Education
called for a school salary of £400 per teacher, that salary was only ’deemed’ to be paid to religious. Moreover, as members of religious communities, these teachers routinely turned their incremental salary cheques over to their orders, i.e., to the "bucket". Since at that point community and school accounts were co-mingled, it cannot with any certainty be estimated to what