warwick.ac.uk/lib-publications
A Thesis Submitted for the Degree of PhD at the University of Warwick
Permanent WRAP URL:
http://wrap.warwick.ac.uk/79695
Copyright and reuse:
This thesis is made available online and is protected by original copyright.
Please scroll down to view the document itself.
Please refer to the repository record for this item for information to help you to cite it.
Our policy information is available from the repository home page.
for Defect Detection in Aerospace Superalloys
by
Robert R. Hughes
Thesis
Submitted to the University of Warwick
for the degree of
Engineering Doctorate
The Department of Physics
Contents
List of Tables vi
List of Figures viii
Acknowledgments xv
Declarations xvi
Abstract xviii
Abbreviations xix
Chapter 1 Introduction 1
1.1 Nomenclature . . . 1
1.2 Motivation . . . 2
1.3 Non-Destructive Testing (NDT) . . . 4
1.4 Review of NDT Techniques . . . 4
1.4.1 Visual and Optical Inspection . . . 5
1.4.2 Penetrant Testing . . . 6
1.4.3 Thermography . . . 7
1.4.4 Ultrasonic Testing (UT) . . . 8
1.4.5 Radiography . . . 10
1.4.6 Magnetic Flux Leakage (MFL) . . . 11
1.5 Summary . . . 13
Chapter 2 Eddy-Current Techniques 14 2.1 Introduction . . . 14
2.2 Electromagnetic Coils . . . 14
2.2.1 Coil Design . . . 15
2.2.2 Coil Sensitivity . . . 18
2.2.3 Mode of Operation . . . 20
2.2.4 Eddy-Current Instrumentation . . . 23
2.2.5 Eddy-Current Excitation . . . 24
2.3 Other Magnetic Field Sensors . . . 27
2.3.1 Magneto-Resistors . . . 28
2.3.2 Superconducting Quantum Interference Device (SQUIDS) . . 28
2.3.3 Hall probes . . . 29
2.4 Eddy-Current Signal Analysis . . . 29
2.5 Inspection & Application Considerations . . . 31
2.5.1 Frequency Selection . . . 31
2.5.2 Material Noise in Ti6-4 . . . 34
2.5.3 Inspection Noise . . . 37
2.6 Summary . . . 38
Chapter 3 Eddy-Current Theory 39 3.1 Introduction . . . 39
3.2 Electromagnetic Induction . . . 39
3.2.1 Self-Inductance . . . 41
3.2.2 Eddy-Current Induction . . . 42
3.3 The Skin Effect . . . 44
3.3.1 Standard Depth of Penetration . . . 45
3.4 The Proximity Effect . . . 52
3.5 Modelling Eddy-Current Behaviour . . . 54
3.6 Eddy-Current Measurement . . . 56
3.6.1 Electrical Impedance . . . 56
3.7 Equivalence Circuit Model . . . 58
3.7.1 Q-Factor . . . 61
3.7.2 Sources of Capacitance . . . 62
3.7.3 The Transformer Model . . . 67
3.8 Summary . . . 72
Chapter 4 Eddy-Current Array Benchmark Study 73 4.1 Introduction . . . 73
4.2 Probe Design . . . 74
4.2.1 Array Operation . . . 74
4.2.2 Normalisation . . . 75
4.3 Positional Sensitivity Study . . . 76
4.3.1 Experimental Method . . . 76
4.3.2 Results . . . 80
4.3.3 Discussion . . . 82
4.4 ECA Probability of Detection . . . 83
4.4.1 Experimental Method . . . 83
4.4.2 Results . . . 84
4.5 Conclusion . . . 85
Chapter 5 Resonance Behaviour: Preliminary Investigations 88 5.1 Introduction . . . 88
5.2 Theory . . . 89
5.3 Co-axial Cable Length . . . 91
5.3.2 Experimental Results . . . 93
5.3.3 Discussion & Analysis . . . 95
5.4 Inductive Resonance Shifting . . . 96
5.4.1 Experimental Parameters . . . 97
5.4.2 Lift-off Behaviour . . . 99
5.4.3 Material Discontinuities . . . 103
5.4.4 Errors . . . 106
5.4.5 Resonant Noise . . . 107
5.5 Conclusions . . . 107
Chapter 6 Near Electrical Resonance Signal Enhancement (NERSE)110 6.1 Introduction . . . 110
6.2 Experimental Methods . . . 111
6.2.1 Experimental Apparatus . . . 111
6.2.2 Excitation Methods . . . 113
6.3 Chirp NERSE Excitation . . . 117
6.3.1 Experimental Parameters . . . 117
6.3.2 Experimental Method . . . 118
6.3.3 Results & Analysis . . . 119
6.3.4 Defect Geometry Study . . . 126
6.3.5 Results & Discussion . . . 128
6.3.6 Abnormalities, Errors & Uncertainty . . . 132
6.4 Harmonic NERSE Excitation . . . 133
6.4.1 Experimental Setup . . . 134
6.4.2 Experimental Procedure . . . 135
6.4.3 Data Analysis Method - Maximised Real Component . . . 139
6.4.4 Results & Discussion . . . 142
6.5.1 Experimental Procedure . . . 149
6.5.2 Results & Discussion . . . 150
6.6 Conclusions . . . 151
Chapter 7 Conclusions & Future Work 155
7.1 Introduction . . . 155
7.2 Thesis Review . . . 155
7.2.1 High Sensitivity ECAs . . . 155
7.2.2 Near Electrical Resonance Signal Enhancement (NERSE) . . 156
7.3 Future Work . . . 158
Appendix A Probability of Detection 161
A.1 Probability of Detection (PoD) . . . 161
A.1.1 PoD Specimens . . . 161
A.1.2 Signal Response Data PoD . . . 162
List of Tables
3.1 Circuit model: Impedance and phase of ideal circuit components. . . 57
4.1 ECA scan calibration parameters. . . 76
4.2 Minimum statistically-reliable defect size detectable by the ECA probe
as calculated via Probability of Detection analysis, comparing
differ-ent athresh levels. . . 84
5.1 Physical properties of RG58, 50Ω coaxial cable, RS Part 6655870
-RG58 C/U PVC [1]. . . 92
5.2 Physical properties of load coil,ZL. . . 93
5.3 Physical and electrical properties of eddy-current probe used to
mea-sure inductive resonance shifting phenomenon,ZL. . . 97
5.4 Physical properties of RG174, 50Ω coaxil cable, RS Part 6655855
-RG174 A/U PVC [2]. . . 98
5.5 Key properties of electrical resonance for the system in air, and
po-sitioned at zero lift-off on the surface of undamaged Ti6-4. . . 99
5.6 Key properties of electrical resonance for the system in air, and
po-sitioned at zero lift-off on the surface of undamaged Ti6-4. . . 105
5.7 Key factors affecting the electrical resonance of an ECT inspection
probe. . . 109
quency sweep measurement of 3 long discontinuities of varying depth
in Titanium 6-4. . . 118
6.2 Key properties of experimental raw frequency spectrum data from
the frequency sweep measurement of the Ti6-4 calibration slots. . . . 121
6.3 SNR peak details in experimental data for three discontinuities of
increasing depth with reference to SNR at 1MHz. . . 125
6.4 Machined defect dimensions. . . 128
6.5 Physical and electrical properties of eddy-current probe used to carry
out probability of detection (PoD) study on NERSE single frequency
excitation. . . 135
6.6 Time for 1000 cycles of excitation frequencies and capture depth of
measurements. . . 138
6.7 Probability of detection (PoD) study results showing the a90/95 for
the three measurement methods. . . 143
List of Figures
1.1 Fluorescent Dye penetrant crack indication in Nickel alloy bar. . . . 6
1.2 Magnetic flux leakage diagram showing magnetic flux lines within a
magnetically permeable test material containing a surface defect. . . 11
2.1 Top down and cross-sectional diagrams of three eddy-current coil
de-signs with eddy-current density at a constant depth. . . 15
2.2 Diagram of probe position relative to the surface of the test material. 16
2.3 Example diagram of eddy current flow in material surface in the
pres-ence of discontinuities. . . 19
2.4 Defect signal response of eddy current measurement in the presence
of discontinuities smaller than the diameter of the probe as a function
of probe position. . . 20
2.5 Circuit configurations for three modes of operation for EC probes. . 21
2.6 Schematic of a Wheatstone impedance bridge. . . 23
2.7 Schematic diagrams of impedance bridge types for eddy-current
in-spection measurements. . . 24
2.8 Example pulsed eddy-current signal responses in the time domain. . 26
2.9 Lissajous (complex plane) plot of ECT defect signal showing the
var-ious measurements possible. . . 31
2.10 Calculated plane-wave skin-depth as a function of frequency for
typ-ical values of four industrial materials. . . 32
frequency curve, lift-off and defect signal directions for a non-ferromagnetic
material. . . 33
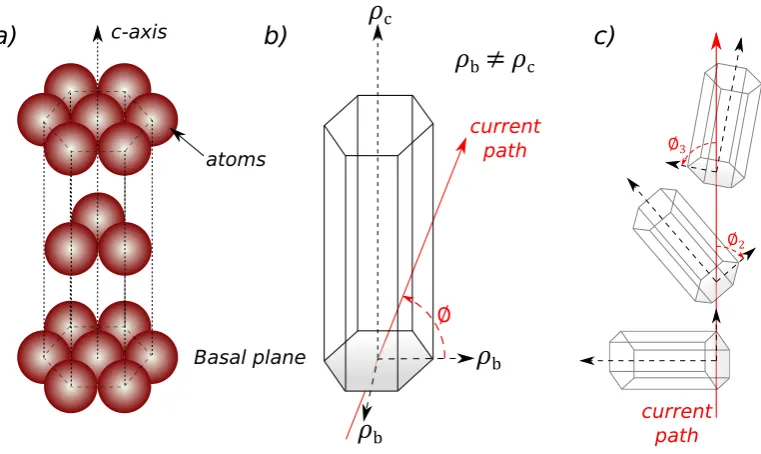
2.12 Diagram of hexagonal close-packed crystallographic structure and it’s
electrical resistivity. . . 35
2.13 Examples of grain noise in Titanium alloys. . . 37
2.14 Examples of comparable ECT inspections of sub-millimetre fatigue
defects in 2024 Aluminium (a) and Ti6-4 (b). . . 38
3.1 Induction of eddy currents within a metal block by an ECT coil. . . 44
3.2 Current density depth profile: Decay of magnitude and change in
phase of current density as a function of depth for plane wave excitation. 47
3.3 Diagram representing the skin effect in a slab section of a conducting
half-space of electrically conducting material. . . 48
3.4 Wire cross-section diagram showing surface confinement of electrical
current within a wire. . . 50
3.5 Diagram of eddy-current path induction in wire cross-section
demon-strating the current crowding effect. . . 53
3.6 Cross-sectional diagram of a delta-function coil above a conducting
half-space showing the parameters used in the Dodd and Deeds
ana-lytical solution. . . 54
3.7 Example Argand diagram showing the resistive and reactive
compo-nents on the complex impedance. . . 57
3.8 Simplified equivalent circuit for an eddy-current probe in free space
with a coaxial cable connection. . . 59
3.9 Electrical Resonance: Peak in an eddy current testing (ECT) coil
showing the magnitude and phase of impedance as it passes through
the resonant frequency,f0. . . 60
plex impedance for the ECT probe in Air showing the real, imaginary,
magnitude and phase of impedance from 1-5MHz. The system goes
through electrical resonance af0 = 3.93±0.01M Hz. . . 61
3.11 Cross-sectional diagram of a) layered coil windings around a core, and
b) assumed pathx(θ) of an electrical field line at an angle θbetween
two coil turns. . . 63
3.12 Geometry of a coaxial cable, showing core diameter and the shields
inner diameter. . . 64
3.13 Equivalence circuit model for inductively loaded coaxial cable
trans-mission line. . . 65
3.14 The transformer circuit model. . . 67
3.15 Simplified equivalence circuit model for material coupled coil and
cable system. . . 71
4.1 Transmit-Receive eddy-current array (ECA) coil configuration of a
commercially available probe designed to detect a 0.75 mm surface
notch in Titanium 6-4. . . 74
4.2 Screenshots of Lissajous plots for three different modes of
measure-ment on Titanium 6-4. . . 75
4.3 Transverse mode of transmit-receive measurements in a two staggered
row array element configuration showing the defect orientation it is
designed to be most sensitive to. . . 76
4.4 Cross-sectional diagram of ECA scanning stage showing the scanning
range. . . 77
4.5 Image of ECA scanning system setup, using Eddyfi’s Ectane ECA
controller and linear stage scanning system. . . 78
notch of 0.75 mm. . . 79
4.7 Example vertical height measurement used to record defect signals
from ECA scans. . . 79
4.8 ECA signals response to 0.75 mm target notch at different positions
under the array elements. . . 81
4.9 Example of probe drag effect causing increased lift-off and tilt on
array elements thereby decreasing sensitivity on back row elements. . 82
4.10 Size, a, vs signal response, ahat in log-log space showing linear best
fit and confidence bounds as produced using MH1823 software in R. 85
4.11 Probability of detection curve for athresh = 0.2 mV as calculated
using MH1823 software in ”R”. . . 86
5.1 Experimentally measured impedance,|Z|, magnitude between 1-5MHz,
of an ECT probe in air and at zero lift-off above undamaged Ti6-4
showing the impedance maximum at electrical resonance of each system. 90
5.2 Impedance magnitude frequency spectrum of load coil in air with a)
No cable (0m), and b) a coaxial cable length of 5.86 m. . . 93
5.3 Simulated map of coaxial cable length vs impedance magnitude
fre-quency spectrum, log(|Z(f)|), of a) coil loaded and b) shorted, coaxial
cables of different lengths. . . 94
5.4 Fundamental resonant frequency of the system as a function of cable
length for coil loaded and shorted systems showing experimental and
transmission line simulated results. . . 95
5.5 Residuals: Deviation of experimental measurements from simulated
resonant frequency predictions for coil loaded (blue circles) and shorted
coaxial cables (green cross). . . 96
probe coil around a ferrite core and surrounded by a ferrite shield. . 98
5.7 Experimentally measured magnitude and phase of complex impedance
for the ECT probe in Air (blue) and with zero lift-off above Ti6-4 (red). 99
5.8 Schematic diagram of lift-off investigation experimental setup. . . 100
5.9 Experimentally measured resonant frequency (a), impedance
magni-tude (b) and Q-factor (c) of the ECT probe as a function of lift-off
from the surface of undamaged Ti6-4. . . 101
5.10 Experimental impedance peak magnitude vs resonant frequency as a
function of lift-off from the surface of undamaged Ti6-4. . . 102
5.11 Calibration block. Image of a Ti64 test specimen and the three
notches of increasing depth. . . 103
5.12 Impedance magnitude frequency spectrum of ECT probe on
undam-aged Titanium 6-4 and above 3 long slots of varying depth in the
same material. . . 104
5.13 Experimental impedance peak magnitude vs resonant frequency as a
function of discontinuity depth in Ti6-4. Plot shows the linear path
of the impedance peak due to small lift-off distances (red dotted) and
indicates the probe resonance peak at industrial zero lift-off. . . 105
5.14 Difference in the impedance frequency spectrum of the ECT probe
above 3 long slots of varying depth in the same material. . . 106
6.1 Schematic diagram of the experimental set up for a 2D ECT scan. . 112
6.2 Schematic circuit diagram of a basic Howland current source design. 113
6.3 ExampleVin (a) and Vout (b) signals for a constant amplitude chirp
excitation function, sweeping from 1-5MHz, and exciting a probe
res-onating at 4.8MHz (peak in b). . . 115
amplitude (τ = 0.5e−3s) chirp excitation function(1-5 MHz), exciting
a probe resonating at 4.8MHz. . . 116
6.5 Titanium 6-4 calibration block surface Magnitude C-scan image of
the background subtracted frequency summation signal between 1-4
MHz (∆S1−4M Hz). . . 119
6.6 Raw frequency spectrum data for varying depth slots on Titanium
6-4 measured using a frequency sweep approach. . . 120
6.7 Background subtracted defect signal frequency spectra. . . 121
6.8 Background subtracted discontinuity magnitude signals relative to
background signal. . . 122
6.9 Background subtracted chirp frequency spectrum of 3 large
disconti-nuities in Ti6-4 of increasing depth. . . 124
6.10 Signal-to-Noise Ratio’s of 3 large discontinuities in Ti 6-4. . . 125
6.11 Near Electrical Resonance Signal Enhancement (NERSE)
signal-to-noise ratio (SNR) plot. . . 126
6.12 Diagram of machined defect dimension geometry. . . 127
6.13 Peak amplitude, Smax, verses area under the background-subtracted
frequency-sweep curve, A, for large machined defects (l dout) of
varying dimensions and defects of finite length (l≈dout). . . 129
6.14 Area under the background-subtracted frequency-sweep curve
(fre-quency summation) for machined defects of varying dimensions given
in table 6.4. . . 130
6.15 Experimental measurement of peak frequency verses peak amplitude
of chirp measurements for the four groups of machined defects
(de-fined in table 6.4). . . 132
6.16 Schematic of probe 2a . . . 136
surement of three calibration slots in Ti6-4. . . 137
6.18 Comparison of background frequency sweep signals of probe 2
con-nected with two different co-axial cable lengths. . . 138
6.19 Harmonic excitation data analysis process showing a C-scan of the
real component at each stage. . . 141
6.20 Log-log plot of crack size verses signal response. . . 143
6.21 Probability of detection curve for probe setup 2a operated at a
fre-quency of 4.0 MHz (within the NERSE operating range for that setup).144
6.22 Example arbitrary area of background material, B, used for
back-ground noise level measurements. . . 145
6.23 Percentage standard deviation of recorded noise values about their
mean value for 3 noise measurement methods. . . 146
6.24 Diagram of grain boundary interfaces for a hexagonally close-packed
material crystal lattice structure. . . 148
6.25 Photo of Ti-685 sample showing the 39.00×26.45mm area of ECT
scan. . . 149
6.26 C-scan images of the large grain Ti-685 sample. . . 151
6.27 C-scan images of the large grain Ti-685 sample showing overlaid
transparent images of the local variance of SRAS surface velocity. . . 152
A.1 Schematic of 3-point bend technique for the generation of fatigue cracks.162
A.2 Image of PoD sample and it’s dimensions. . . 162
A.3 Example of a-hat vs a log-log plot showing normal distributions around
predicted defect signal responses (a) and a Probability of Detection
(PoD) curve (b), with 95% confidence band (blue-dotted line). . . . 163
Acknowledgments
I would like to dedicate this thesis to coffee, without whom none of this would
have been possible. I would also like to thank the following for their support and
contributions to the work herein.
From the University of Warwick: Tobias Ericsson for his assistance in the
tedious task of taking the probability of detection (PoD) measurements while I
went for job interviews. Yichao Fan for his advice and technical support in the
development of the NERSE experimental setup and the design and manufacture of
in-house eddy-current probes. Rachel Edwards for her thorough and encouragingly
ruthless feedback on reports and thesis drafts. And Steve Dixon for his unwavering
support, guidance and frank words of encouragement throughout the EngD.
From Rolls-Royce plc, Aerospace NDE Lab, I wish to thank: Gian-Luca
Piroddi for his assistance in characterising eddy-current arrays. Kit Lane for his
infallible industrial support, practical advice and encouragement throughout. Tony
Dunhill for the funding, passion and enthusiasm he had for the work I carried out.
And Chris Batten for his advice and lessons on eddy-current probe design.
I would also like to thank Jethro Coulson for supplying the SRAS grain
boundary data and always being up for a pint on EngD courses.
Final thanks go to my family and friends for their encouragement, support
and assistance, throughout my EngD. Without their continued support I would have
slipped another few rungs on the ladder toward sanity.
Please Note: If it wasn’t for the Rugby World Cup, this would have been
finished many weeks earlier.
Declarations
I, Robert Hughes, do declare that the work presented in this thesis is my original
research. Every effort is made to clearly indicate where contributions from others
were involved, with due reference to the literature, and acknowledgement of
collab-orative research and discussions. The work was performed under the guidance of:
Prof. Steve Dixon from the Department of Physics, at the University of Warwick,
and Dr. Kit Lane, NDE Lab, Rolls-Royce plc., during the period between October
2011 and September 2015.
No part of this work has been previously submitted to the University of
Warwick, or any other academic institution, for the admission to a higher degree.
Some of the work has already appeared in the forms of publications, and those are
listed below.
Published Papers
• R. Hughes and S. Dixon, Developments in Near Electrical Resonance Signal
Enhancement (NERSE) Eddy-Current Methods, AIP Conference Proceedings,
Vol. 1650, 2015, Pages 345-352
• R. Hughes and S. Dixon,Near Electrical Resonance Signal Enhancement (NERSE)
For Sub-Millimetre Detection In Aerospace Superalloys, International Journal
of Aerospace and Lightweight Structures (IJALS), Vol. 4, No. 2, 2014, Pages
107-120.
• R. Hughes, Y. Fan, and S. Dixon,Near Electrical Resonance Signal
Enhance-ment (NERSE) in Eddy-Current Crack Detection, NDT & E International,
• R. Hughes and S. Dixon, Eddy-Current Crack Detection at Frequencies
Ap-proaching Electrical Resonance, AIP Conference Proceedings, Vol. 1581, 2014,
Pages 1366-1373
Submitted Papers
• R. Hughes, Y. Fan, and S. Dixon,Investigating Electrical Resonance in
Eddy-Current Array Probes, AIP Conference Proceedings, A Review of Quantitative
Non-Destructive Evaluation (QNDE), Minneapolis, MN, July 2015.
Abstract
Industrial eddy-current testing (ECT) inspections of aerospace superalloys, such as Titanium 6Al-4V, must reliably detect sub-millimetre surface breaking de-fects. The sensitivity of such measurements is hindered by the materials’ low con-ductivity and high coherent background material noise, making the high sensitivity standards required by industry harder to achieve.
It is demonstrated herein that using eddy-current array (ECA) technology also introduces inspection ”blind-spots”, whereby small defects could be missed. This supports the motivation to develop techniques for enhancing the sensitivity of typical ECT and ECA measurements. The early stage research and development of a novel ECT measurement method is presented, and shown to improve the standard measurement sensitivity of industrial ECT inspections.
A defect signal enhancement phenomenon within a band of frequencies close to the electrical resonance of an ECT probe, termed near electrical resonance signal enhancement (NERSE), was observed and characterised. This phenomenon was demonstrated to be a direct result of the shifting resonant frequency of the probe in the presence of material discontinuities.
Frequency sweeping chirp signals were used to generate electrical resonance traversing frequency spectra measurements of the inspection probe in the presence of material discontinuities. Critical feature analysis of the results demonstrated a correlation between defect dimensions and peak NERSE amplitude, but failed to draw any conclusive trends between discontinuity dimensions and the resonant frequency shift. This was attributed to the relatively small defect sample set used and the size of many of the machined defects being smaller than the diameter of the inspection coil.
An ECT probe was excited at a single frequency carefully selected to cor-respond to the NERSE peak frequency. A study was performed to statistically analysis the sensitivity of this NERSE measurement compared to a standard exci-tation frequency measurement used in industry. The results demonstrated that a NERSE frequency inspection was able to reliably detect a defect size of 0.82 mm, compared to 1.09 mm achieved by a standard operating frequency.
Abbreviations
NDT = Non-Destructive Testing
NDE = Non-Destructive Evaluation
EC = Eddy-Current
ECT = Eddy-Current Testing
ECA = Eddy-Current Array
PEC = Pulsed Eddy-Current
UT = Ultrasonic Testing
PoD = Probability of Detection
NER = Near Electrical Resonance
NERSE = Near Electrical Resonance Signal Enhancement
RF = Radio Frequency
AC = Alternating Current
DC = Direct Current
HVM = High Value Manufacturing
FE = Finite Element
Ti6-4 = Titanium 6Al-4V
Introduction
1.1
Nomenclature
Below is a list of some of the common symbols used within this thesis. Vectors are
represented in bold and scalars are in plain text.
t= Time (s)
f = Frequency (Hz)
ω= 2πf = Angular frequency (rad·s−1)
ε=εrε0 = Permittivity (F m−1)
εr = Relative Permittivity
ε0= Permittivity of free space (F m−1)
µ=µrµ0 = Permeability (Hm−1)
µr = Relative Permeability
µ0 = Permeability of free space (Hm−1)
σ = Conductivity (Sm−1)
ρ= 1/σ= Resistivity (Ωm)
A= Magnetic Vector Potential (V sm−1)
H= Magnetic field (Am−1)
B=∇ ×A=µH = Magnetic flux density (T)
E= Electric field (V m−1)
D=εE= Electric displacement Field (Cm−1)
J=σE= Current Density (Am−2)
R = Resistance (Ω)
L= Inductance (H)
C = Capacitance (F)
i=√−1 = Complex number
Z = Impedance (Ω)
X=={Z}= Reactance (Ω)
1.2
Motivation
High strength superalloys are used to make safety critical industrial components
that are routinely subjected to intense stresses, strains and extreme environments.
Jet engine turbine components are a perfect example, whose mechanical failure can
come at significant financial and human cost [3, 4, 5, 6]. Development engineers
care-fully design these components so as to minimise failures, thus ensuring its economic
viability and increasing its service life [7]. However, if left unchecked, even very small
discontinuities within these structures could result in disastrous consequences. This
leaves engineers with the important challenge of locating and detecting small
de-fects before they can propagate and become critical. This must be done without
compromising the functionality of the components, and so, are therefore inspected
using methods from the field of non-destructive testing (NDT).
There are many NDT techniques to choose from when inspecting for defects.
Each has its advantages and disadvantages that will determine its suitability for a
certain type of inspection. Some inspections are purely surface techniques (dye
probe the bulk of the material (ultrasonics and radiography). Many factors must be
considered when choosing a technique. Foremost amongst these are the location and
dimensions of the cracks being inspected which ultimately determines the minimum
resolution required of the inspection. Other limiting factors include; cost, speed of
inspection, ease of use, type of indications produced and any material limitations
(e.g. material conductivity or grain structure) [8].
Eddy current testing (ECT) is used for the surface and near surface
inspec-tion of jet engine components made of high strength superalloys such as Titanium
6Al-4V (Ti6-4), a workhorse material of the aerospace industry. High inspection
standards for these safety-critical components stipulate that the techniques used
must achieve certain threshold sensitivities. However, advances in manufacturing
design (single part components with complex geometry), microstructure, electrical
anisotropy and defect growth counter measures (shot-peening and coatings) have
made reaching these sensitivity targets more complicated [9, 10, 11]. As a result,
the limits of traditional ECT inspection sensitivity are being reached, and so more
advanced methods must be explored in order to meet the sensitivity requirements
set by industry.
In addition, there is an increasing trend towards the use of multiple ECT coil
elements in eddy current array (ECA) probes in order to improve inspection speeds.
However, array probes often compromise on sensitivity in favour of coverage.
The aim of this EngD project is to:
1. Understand the limitations of typical ECA probe designs and operating modes
so as to assist in the development of high sensitivity inspection techniques for
complex jet engine components.
2. Investigate the application of novel eddy-current measurement techniques on
aerospace superalloy materials in an effort to develop improved sensitivity to
1.3
Non-Destructive Testing (NDT)
Many industry sectors, such as energy and aerospace, depend on the reliable
per-formance of material components. The failure of one of these components can be
costly and even cause a halt to normal operations resulting in a significant financial
toll on the company while the failure is identified and fixed. There are two main
maintenance approaches that can be employed by industry to mitigate the costs of
critical component failure. They are, corrective (fixing components when they fail)
or preventative (routine inspection of component quality). The approach applied
to any given component is dependent on many factors to do with the cost of
man-ufacture and impact a components failure would have on the sectors operations.
Non-destructive testing (NDT) is the general name given to a field of engineering
methods that can be used to evaluate a component’s quality or structural integrity
without impairing it’s future use. NDT is an essential preventative tool in the
manu-facture and maintenance of high risk and high cost industrial components, otherwise
known as high value manufacturing (HVM). There are numerous techniques that can
be used to inspect critical HVM parts depending on the requirements and limitations
of the application. In the following section the main NDT techniques implemented
in the Aerospace industry are summarised along with their benefits and limitations.
1.4
Review of NDT Techniques
There are a whole range of NDT techniques that can be used to inspect components.
Each has their own advantages and disadvantages of use depending on the type of
inspection required, and so rarely will one technique be used alone to inspect a
component. Instead multiple techniques are used to compliment one another so
that a complete evaluation of a component can be made. What follows is a brief
overview of the some of the most common methods in industrial NDT, detailing
1.4.1 Visual and Optical Inspection
Visual inspection counts as the oldest, simplest and therefore most widely used NDT
method around [7]. It involves the direct visual examination of a part or object to
see if there is any visible signs of damage. It is therefore often the cheapest
in-spection available to NDT engineers. It is used every day in a range of different
contexts, from checking food quality standards before they are sold in shops to
in-specting the outside of an aircraft before take-off. They all use a form of visual
inspection. However, due to the inherently subjective nature of visual inspection,
the technique requires special training and validation of inspectors to ensure that a
reliable standard of inspection is performed [8, 12]. As a result visual inspections
are more often used as a guide for other NDT methods in identifying areas where
potential degradation may have occurred but where further analysis is required to
evaluate the extent of the damage. In the case of dye penetrant inspection however,
visual inspection is used to locate and measure defects from this method (see
sec-tion 1.4.2).
One of the disadvantages of visual inspection, which is common across many
NDT techniques, is ease of access to the surface. There are many more advanced
techniques derived from direct visual inspection, making use of optical aids such as
mirrors, lenses, microscopes, borescopes and digital cameras that can be used to
solve these issues [12].
More recent research and development has lead to other optical methods
such as shearography (or shearing interferometry) whereby a coherent light source
is reflected off the surface of a material through an interferometer lens system to
pro-vide information about the vibrational behaviour of the component which changes
with load and the presence of defects [13].
The main disadvantages of visual inspection are that the inspection is only
capable of identifying surface damage. For some component surfaces this may
struggles to identify hairline fractures and is better suited to large area damage.
1.4.2 Penetrant Testing
Penetrant testing is a widely used NDT method for locating and sizing
surface-breaking defects [8]. In the aerospace industry, typical tests involve the application
of a fluorescent liquid dye to the surface of a sample, which seeps into any
surface-breaking cracks via capillary action. The excess dye is removed and a developer
is then used to draw the liquid from the crack and the sample is examined under
appropriate lighting (i.e. UV light for fluorescent penetrants) to locate and size
cracks [12]. Penetrant testing is sensitive to small surface breaking cracks of all
orientations and is unconfined by the properties of the material or its geometry.
Large areas can be inspected relatively rapidly using penetrant testing and deliver
an accurate indication of the size and shape of cracks (Figure 1.1).
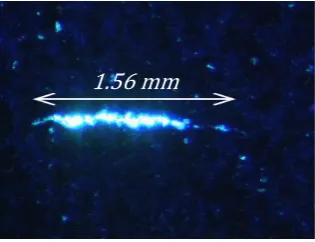
[image:27.595.242.400.394.515.2]1.56 mm
Figure 1.1: Fluorescent Dye penetrant crack indication in Nickel alloy bar [Rolls-Royce plc. NDE lab stock photo].
However, penetrant testing has its limitations. It is unable to detect
non-surface-breaking cracks and does not give information as to the extent or shape of
the crack within the bulk of the material. It is also inefficient at detecting closed or
partially-closed discontinuities which can lead to misrepresentation of the full extent
of the defect.
Penetrant testing requires the removal of any coatings and the component
take place. Such preparations prolong the length of time the component is
out-of-service and make the process more expensive. The reliability and sensitivity of
penetrant testing is often dependant on the precise application and careful storage
and treatment of the penetrant chemicals.
1.4.3 Thermography
Thermography is used in the aerospace industry for the rapid inspection of large
areas. There area a number of methods for performing thermography measurements
however the basic principle involves heating a component’s surface using flash lamps,
hot-air guns or sometimes eddy-current heating, and then using infra-red cameras
to measure the heat dissipation as a function of time after initial heating. The rate
of dissipation depends on the thermal properties of the material being inspected as
well as the component structure. Defects, such as cracks or voids in a material form
an insulating air gap within the parent material, slowing the dissipation of heat in
that region and trapping heat at the surface for a longer period. This appears as a
localised ”hot-spot” on the infra-red image of the surface and signal-analysis can be
performed on the time-domain infra-red images to investigate the rate of dissipation
and phase of hot-spots within an inspection. The deeper the defect is, the longer it
will take for the heat to dissipate from the surface and reach the defect. This can
be used to calculate the depth of defects [12, 14, 15, 16].
Thermography inspections are dependant on the area of the discontinuity
parallel to the heated surface. Tight cracks perpendicular to the surface of thermal
excitation will not obstruct the diffusion of heat down into the material and are
unlikely to be detected [17]. Although technically a non-contact technique, test
samples often require a dark coating to be added so that the heat is absorbed by the
material and not reflected from the surface [18]. Depending on the test material, high
frame rate infra-red cameras may be needed in order to capture the rapid diffusion
expensive [12, 16].
1.4.4 Ultrasonic Testing (UT)
UT inspections can be performedin situand are capable of detecting discontinuities in both the surface and bulk of components [19]. There are multiple methods for
generating and detecting ultrasound in materials; piezoelectric transducers, laser
ultrasonics and Electromagnetic Acoustic Transducers (EMATs) being the most
commonly used [19, 20, 21, 22].
Piezoelectric transducers use piezoelectric elements that will mechanically
vibrate when supplied with a voltage impulse and will similarly generate a voltage
response when they mechanically vibrate. In this way piezoelectric-transducers are
used to transmit and receive vibrations into and from a material. However,
piezo-electric transduction UT is traditionally limited by its need for direct contact with
the sample, often requiring a coupling layer between the transducer and the test
material [22]. As a result, contact conditions can be highly variable, reducing
re-peatability and making rapid inspections prone to error. Contact transducers are
not suitable for inspections in extreme environments or where insulating coatings
protect the component [22, 23].
EMATs generate and detect ultrasound in conducting materials through
electromagnetic induction, and so do not require direct contact with the material.
This makes EMATs suitable for high speed, repeatable inspections, and for
inspec-tions in hostile environments or through coatings and rough surfaces [23]. However,
EMATs suffer from a comparatively low generation and detection efficiency
com-pared to piezoelectric transducers [21]. This is in part due to the stand-off from the
component surface which rapidly reduces the electromagnetic coupling required for
ultrasonic generation and detection. Although, contact is not necessary for
ultra-sonic generation, EMATs must still be within a few millimetres for electromagnetic
Another non-contact ultrasonic technique is laser UT. There are two laser
UT generation regimes, thermoelastic and ablation. The former uses a high-power
laser impulse to locally heat a point on the surface causing sudden thermal
expan-sion and relaxation, thereby generating ultrasonic pulses within the material. The
ablation method locally heats the material beyond its boiling point, evaporating a
small amount of material, and generating ultrasound by the recoil effect of the
ma-terial loss [19, 24]. The frequency content of the ultrasonic waves is dependant on
the generation regime. Ultrasonic detection can be done by measuring the
displace-ment of the material using a number of methods including laser interferometry. For
further details on the exact mechanisms of laser UT generation and detection the
reader is directed to Scruby and Drain [24]. Laser UT is a high resolution technique
that does not require material contact. However, the limitations are that the
ma-terial surfaces must often be highly polished for sensitive ultrasonic detection, and
the laser systems are often expensive and carry certain safety considerations with
them.
UT techniques are sensitive to both surface and sub-surface flaws, and can be
used to inspect large areas with a single probe [25]. Many authors have demonstrated
the use of surface ultrasonic waves for the detection of surface defects [20, 26, 27].
UT bulk wave inspections are capable of resolving defects of sizes equivalent to
the wavelength of the ultrasound generated. Reducing the wavelength (increasing
the frequency) will therefore allow a greater sensitivity to smaller features, but
ultrasound becomes highly attenuated as the wavelength tends towards the grain
size of the material (or fibre layup in composite materials) [22, 28]. Many high
strength, super alloys used in industry such as Inconel, Waspaloy and Titanium
6Al-4V, have coarse grain structures, leading to greater attenuation of higher frequency
ultrasonic signals, thus limiting the smallest defects detectable [7]. High strength
alloys are frequently used in safety critical components, and in harsh environments,
by processes such as shot peening or burnishing which generates a layer of residual
stress within the surface that will allow cracks to close themselves. Ultrasound can
be transmitted through closed cracks [28] making the detection of very tight defects
even more difficult.
1.4.5 Radiography
One of the most widely used and revealing NDT techniques is Radiography.
Pen-etrating radiation (X-ray or gamma-ray) is directed at a specimen and developed
on film or imaged on a sensor after having passed through the target sample. The
intensity of the radiation is attenuated by its passage through the material leading
to reduced irradiation of the developing film. The result is a two-dimensional
inten-sity profile related to the deninten-sity of the material that the radiation passed through.
Cracks are equivalent to a reduction in the amount of material the radiation
trav-els through, and thus show up as a darker region to the surrounding material (i.e.
more radiation gets through leading to greater exposure). Radiographic images are
often produced for multiple orientations of the component to fully characterize any
defects. The contrast between defects and the surrounding material allows the
op-erator to accurately locate, classify (i.e. porosity, crack, inclusion etc.) and size
defects [8, 31].
Although Radiography is capable of accurately detecting and sizing
de-fects anywhere within a specimen, it is dependant on the orientation of the dede-fects.
Defects in plane with the radiation propagation can go undetected. The highly
penetrating radiation is also a considerable health risk. Radiographic NDT must
therefore be performed in strictly controlled environments where safety is the key
concern. While in situ inspections can be performed using radiography, the prac-ticality is limited by safety regulations. As such, most inspections are performed
in shielded rooms to protect operators during inspection. Any specimen being
along with other safety precautions, makes Radiography a relatively expensive
tech-nique.
1.4.6 Magnetic Flux Leakage (MFL)
Magnetic flux leakage (MFL) is an electromagnetic technique whereby a uniform
magnetic field is applied to a magnetically permeable test material. This can be
done with a permanent magnet or electromagnet. Discontinuities obstructing the
magnetic flux lines within the test material cause the flux contained within it to find
other routes around the discontinuity and so cause the magnetic flux to leak out of
the surface. A diagram of how MFL works is shown in figure 1.2.
Magnetic flux lines
Figure 1.2: Magnetic flux leakage diagram showing magnetic flux lines within a magnetically permeable test material containing a surface defect.
The magnetic flux that leaks out of the surface can be detected either with a
magnetic field sensor i.e. inductive coil, hall effect sensor etc (see section 2.3) [32],
or using magnetic particle fluids which contain ferromagnetic particles in solution
which are attracted to the leaked field. The latter method is known as magnetic
particle inspection (MPI). MFL measurement methods are limited to ferromagnetic
and magnetically permeable materials and is only capable of detecting near surface
discontinuities orientated perpendicular to the direction of magnetic flux [8, 12, 33].
1.4.7 Eddy-Current Testing (ECT)
ECT techniques offer an attractive alternative for the surface inspection of high
strength alloys. ECT is a very repeatable, non-contact inspection technique, which
electrically conducting materials. ECT uses a similar principle of electromagnetic
induction to EMATs to measure the electrical properties of the test material, and
as such the technique is not subject to the variable contact conditions experienced
by piezoelectric UT [19]. Eddy-current technology is relatively cheap compared to
many of the other NDT inspection methods discussed above. However, ECT
tech-niques do have their disadvantages. They are limited to the inspection of electrically
conducting materials, are highly sensitive to variations in lift-off (distance between
the probe tip and the surface of the test material) and tilt of the probe, and can be
inefficient at detecting closed or partially contacting cracks. This is a common issue
for many NDT including X-ray, UT and penetrant inspections.
ECT works by supplying a coil with alternating current while positioned
above an electrically conducting material, thereby inducing localised electrical charge
flow (eddy-currents) within the surface of the material (figure 3.1). The mutual
interaction between the magnetic fields of the eddy-currents and the coil can be
measured via the electrical properties of the coil and will change when the
eddy-currents are obstructed by a discontinuity [34, 35]. While UT inspection techniques
often require sophisticated analysis to extract defect positions from complicated
time-traces [36], ECT only detects surface or near surface discontinuities1 directly
beneath the probe, which makes locating defects straight-forward. ECT gives an
im-mediate quantitative indication of defect size and position during inspection which
can also be used to size defects [37]. However, single probe inspections of large areas
can be time consuming to perform. Due to the localized nature of the generated
eddy-currents, the probe must scan over the whole of the whole inspection surface.
Arrays of eddy current elements (see section 2.2.3 can be used to achieve greater
coverage thus allowing larger areas to be scanned in one sweep, further increasing
the speed of inspection [38]. Although highly sensitive to small defects, ECT
in-spections are limited to surface and near-surface inin-spections due to the skin-effect
(see section 3.3) [39] which is dependant on the material conductivity, permeability
and the frequency of excitation.
1.5
Summary
In this chapter the main NDT techniques were presented and their advantages and
disadvantages discussed. Due to the high quality standards required, ECT methods
are commonly relied upon for the surface inspection of safety critical superalloys
in the aerospace industry. However, the uptake of more advanced ECT methods
within industry has been poor over the past decade, and the sensitivity limits of
these techniques are plateauing. Developments, and industrial interest, in
multi-coil, arrayed eddy-current probes has provided the ideal opportunity for a critical
examination of ECT/ECA technique sensitivity and the development of more
ad-vanced, higher-sensitivity eddy-current techniques.
The following chapter discusses the field of eddy-current testing in greater
Eddy-Current Techniques
2.1
Introduction
Eddy-current inspection measurements can be performed using a wide variety of
probe designs and operational techniques. The basic principles for performing an
ECT inspection require the measurement of the secondary magnetic field generated
by the eddy-currents in the inspection material. In this chapter a detailed
explana-tion and review of the main ECT measurement probes and methods is presented.
The latest advances in novel ECT research methods are also highlighted where
ap-propriate and a summary of the relevant properties for the ECT inspection of the
material of interest, Titanium 6Al-4V (Ti6-4), are detailed.
Due to the many variations of ECT inspection methods for different
inspec-tion geometries, materials and defect properties, this chapter will concentrate
pre-dominately on reviewing surface inspection methods for detecting surface breaking
defects on nominally flat, non-ferromagnetic materials.
2.2
Electromagnetic Coils
The first ECT inspections used electromagnetic coils to generate and detect
eddy-currents in the surface of materials. These simple probes are still most commonly
used method of inducing eddy-currents in a test specimen and for measuring their
magnetic fields. This is due to coils offering good sensitivity at high frequency at
low cost. There are many different types and approaches to consider when designing
an electromagnetic coil ECT inspection, the most significant of which are presented
in the following sections.
2.2.1 Coil Design
The size, shape, material backing and drive frequency of a coil all affect the
eddy-current density profile generated within the test material and will influence how
sensitive the probe is to defects. When a coil is energized above a conducting
materials surface, localized eddy-currents are induced within the footprint of the
wire. Larger coil footprints offer a greater area of coverage at the expense of defect
sensitivity [42]. Figure 2.1 shows schematic, top-down diagrams of three different
coil designs (spiral pancake, solenoid, and meander). Also shown are cross-sectional
views of the coils above a conductive material surface, the corresponding mirror
eddy-current flow and the magnitude of eddy-current density at a constant depth
z,|Je|z=const, as a function of radial surface distance (x-direction).
𝐽
𝑧=𝑐𝑜𝑛𝑠𝑡𝐽
𝑧=𝑐𝑜𝑛𝑠𝑡𝐽
𝑧=𝑐𝑜𝑛𝑠𝑡a)
b)
c)
Solenoid-Type Coils
Solenoid coils have their axis perpendicular to the surface of the test sample. Solenoid
coils are cylindrical turns of wire, often a few layers thick. They generate strong
mag-netic fields in their footprint, producing high eddy-current densities in the material
directly beneath the coil turns and thus exhibit good signal strength (figure 2.1.b).
Solenoids are therefore very sensitive to small cracks. Solenoid coils are ordinarily
very sensitive to tilt and lift-off (see figure 2.2) from the material surface which are
the major contributors to noise in EC surface inspections [43].
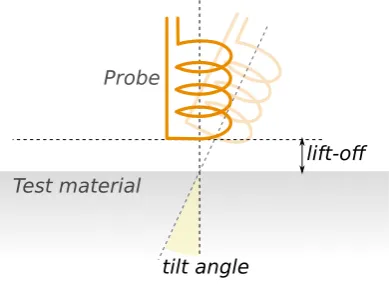
lift-off
tilt angle Probe
[image:37.595.223.418.292.434.2]Test material
Figure 2.2: Diagram of probe position relative to the surface of the test material.
Solenoid-type coils are commonly used as encircling probes where they are
wrapped around or within test bars or tubes. The encircling probe generates ECs
in the azimuthal direction of the sample bar axis, making them sensitive to
dis-continuities parallel to the axis of the coil but insensitive to defects orientated
cir-cumferentially. Pipes are often inspected for internal damage using encircling coils
pulled through the interior [44]. The inductance of a simple solenoid coil ofN turns,
cross-sectional areaAand axial length l, can be estimated using the equation [45],
L=µN 2A
l (2.1)
Pancake-Type Coils
Pancake coils also have their axis perpendicular to the surface of the sample, but
are wound in flat spirals as shown in figure 2.1.a. They offer better coverage than
solenoids but suffer a loss in intensity of eddy-current density, resulting in reduced
signal strength. The increased coverage of pancake coils, compared with solenoid
coils, also comes at the cost of spatial resolution [42]. Depending on the coil size, if
a small crack (smaller than the footprint of the coil) is picked up by a spiral coil it
cannot be determined exactly where within the footprint the defect will be.
Rectangular coils
In the past decade the use of rectangular coils in ECT has increased [38, 46, 47].
Their directional properties and ability to generate uniform EC distributions makes
them an attractive option for certain inspections. Rectangular coils also offer good
sensitivity to scratches and other minor surface damage, as well as being easily
manufactured by printed circuit techniques [47]. One innovative approach to EC
inspection using rectangular coils has been pioneered by the company Jentek Sensors
Inc. [48]. A transmit-receive probe (see section 2.2.3) floods a relatively large area
of test material with eddy currents by generating a spatially periodic magnetic
field. This is achieved using a single primary meander coil (figure 2.1.c) excited
with alternating current. Rectangular receiver coils, closely following the loops of
the primary coil, pick up any changes in the magnetic field due to discontinuities
[48, 49, 50]. The simple design of the coils makes it easy to model the system and
provides a much larger effective dipole giving better insensitivity to lift-off. However,
due to their low turn number, much higher currents must be used in order to achieve
Ferrite Cores
The sensitivity of an ECT coil is dependent on the inductance,L, of the coil, which
can be raised significantly by using a core with a high magnetic permeability (µ).
Ferrites are ceramic compounds of iron oxides, which are ferrimagnetic but
non-conductive. These can be used as coil cores offering a very high permeability, even
at high frequencies, unlike iron or steel. Their low conductivities, many orders of
magnitude less than that of metals, suppress the generation of eddy-currents within
the ferrite [45]. Higher permeability cores concentrate the magnetic flux of the coil,
promoting greater flux linkage between the coil and the material, which improves
lift-off sensitivity and the dynamic range of the probe [51]. Ferrites are even effective
when used as a backing to pancake-type coils [52].
Low core conductivity is important for reducing losses within a core.
Eddy-currents and magnetic hysteresis are key mechanisms of loss represented by an
imag-inary component of impedance [51]. When designing ECT coils with ferrite cores
it is important to select a ferrite material that has a small imaginary component of
permeability at the frequencies being operated at, so as to minimise losses. However,
the complex permeability is also dependent on the dimensions of the material [53]
such that the apparent permeability of smaller cores can be significantly different
from that of a larger core. This dimensional effect is caused by the combination of
intrinsic permeability and permittivity. All of these factors make modelling and
de-termining the complex permeability of ferrite cores complicated, with many authors
carrying out research in the area [53, 54, 55, 56, 57, 58].
2.2.2 Coil Sensitivity
In NDT it is often important to be able to accurately evaluate the size of defects.
Janousek et al. [59] describe a novel ECT approach for sizing defects, using two
probes generating differing eddy-current distributions in order to gain increased
penetration to characterise defect depths, and Yusa et al. [61] have developed a
method of extending the ECT sensitivity to defects much deeper than the depth
of penetration making it possible to distinguish between EC signals from defects of
different depths. Yusa et al. [61] use coils perpendicular and parallel to the material
surface in conjunction to send and receive eddy-currents respectively. The set up
reportedly overcomes some of the limitations of conventional ECT. For typical ECT
inspections in the aerospace industry, a high risk component will fail an inspection if
any defects are detected above a pre-determined detection threshold. It is therefore
vital to use highly sensitive inspections for these components.
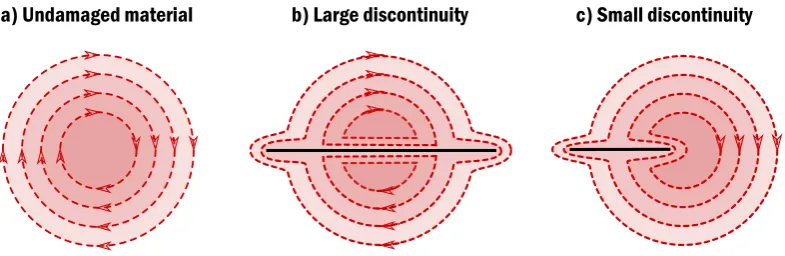
[image:40.595.126.519.304.432.2]a) Undamaged material b) Large discontinuity c) Small discontinuity
Figure 2.3: Simplified eddy current flow in material surface when a) No defect is present, b) a deep defect greater than the diameter of the coil is present, c) a defect smaller than the diameter of the coil is present, and d) a defect smaller than the diameter of the coil and parallel to the flow of current.
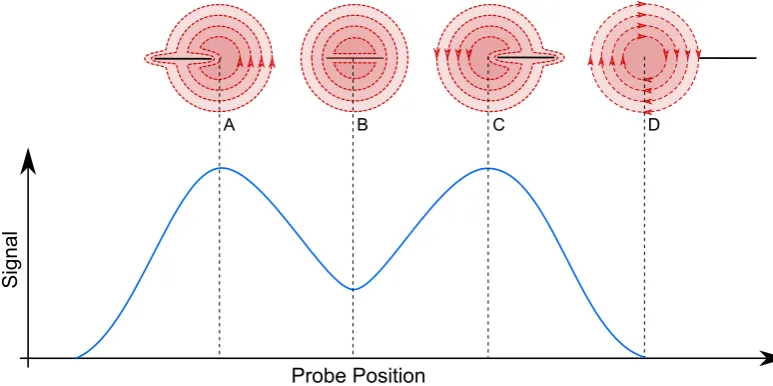
It should be noted that defects smaller than the size of the probe will produce
double peaked defect indications as demonstrated in figure 2.4.
One of the main limits of ECT sensitivity is the coil size. When eddy-currents
encounter a crack comparable to the diameter of their circular path they are forced
to find a new path around or under the defect. Any cracks smaller than this
di-ameter can be directly beneath the coil and still leave the eddy-currents relatively
unperturbed therefore producing negligible signal (figure 2.3.c). The sensitivity is
also orientation dependent. A defect smaller than the diameter of the coil offers less
The greatest defect signals are achieved when the defect offers the greatest
obstruc-tion to current flow i.e. when the crack axis is perpendicular to the flow of current.
This is the ultimate physical limit of many ECT probes. Uchanin [62] demonstrated
that spatial changes occurred in ECT signals along long defects and highlighted the
need for ECT coils to be smaller than the target defect size.
Probe Position
Signa
l
[image:41.595.123.510.218.411.2]A B C D
Figure 2.4: Representation of eddy-current measurement of a defect smaller than the diameter of the coil showing the equivalent signal response at four positions. The result is a double peak signal.
2.2.3 Mode of Operation
There are a number of different measurements that can be made with
electromag-netic coil probes, depending on the purpose or limitations of the application. The
main measurement techniques commonly implemented are summarised in the
fol-lowing sections.
Absolute (Reflection) Probe
Absolute (sometimes called Double-function, or reflection) probes use a single coil
to generate and detect the ECs in the test specimen (figure 2.5.a). This is the most
V
V
V
a)
b)
c)
Figure 2.5: Circuit configurations for three modes of operation for EC probes, a) Absolute, b) Differential and c) Transmit-Receive, after [64].
has been used to explain the fundamental concept of ECT so far in this report. The
output of the probe is the absolute voltage across the coil, which changes in the
presence of a defect. However, this configuration is highly sensitive to variations
in temperature. Absolute-mode probes are often used in conjunction with a
refer-ence coil removed from the inspection area. The referrefer-ence coil is designed to have
the same impedance in air as the inspection coil and to compensate the voltage
so as to reduce fluctuations from changes in local temperature (see figure 2.7.a).
For perfectly matched inspection and reference coils, the system will return zero
voltage when there is no defect, thereby enhancing the dynamic range and thus the
probes sensitivity to defects [44]. This approach is a form of differential probe (see
section 2.2.3).
Differential Probe
Differential probes measure the voltage difference between the voltages of two coils
inspecting adjacent sections of a test specimen (figure 2.5.b). They can be wound
as two separate coils and their absolute voltages subtracted post inspection, or
wound as a single circuit of two coils with opposing direction turns. The latter
probe configuration equalizes the induced voltage due to the primary excitation
used as double-function probes or as passive sensor coils to a separate excitation
coil in a separate-function probe. Differential probes are highly sensitive to small
defects but can be insensitive to long defects (i.e. if both coils sense the defect and
therefore cancel the signal out). They are very stable, relatively lift-off insensitive,
probes, offering less noise and allowing higher sensitivity to smaller signals, but can
be insensitive to defects of certain orientations [45].
Transmit-Receive Probe
Transmit-receive or separated-function probes use one coil to excite eddy-currents
and another (or a few others) as a passive detector of the EC response (figure 2.5.c).
The benefit of separated-function probes is that the generation and detection coils
can each be optimized separately to enhance the sensitivity of the probe, whereas
absolute probes require a compromise between strong, uniform EC generation, good
coverage and sensitivity to defects.
Array Probes
One of the major disadvantages of single coil operation is the time it takes to scan a
two-dimensional surface. Eddy-current arrays (ECAs) can significantly reduce this
inspection time by increasing the area covered in a single scan [70]. ECAs comprise
a number of identical, uniformly spaced sensing elements which are scanned across
a surface to inspect large areas quickly. Array elements can be driven in any of the
modes above, dependent on the type of defect being sought. It is then a matter of
multiplexing between elements (or groups of elements) in turn to electronically scan
through all the elements of the array. Multiplexing is performed in a pattern so as
to avoid the detrimental effects of cross-talk experienced between adjacent elements
being simultaneously driven. Many authors have seen the benefits of ECAs and have
striven to improve both probe design and post-processing defect characterisation
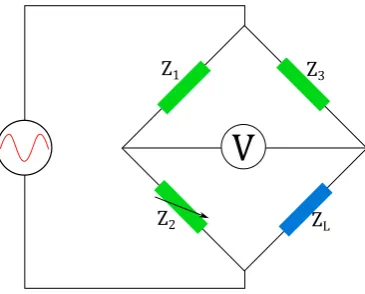
V
Z1 Z3
[image:44.595.232.415.105.252.2]Z2 ZL
Figure 2.6: Schematic of a Wheatstone impedance bridge showing two fixed impedance components (Z1 & Z3), one variable impedance component (Z2) and
the load component (ZL).
achieve enhanced coverage for the inspection of complex and inaccessible surfaces
by manufacturing printed circuit coils [48, 72, 73].
2.2.4 Eddy-Current Instrumentation
Electromagnetic coils can be integrated into sensitive measurement circuits that can
be adapted for the specific application being considered.
Bridges are a frequently-used method of achieving relatively stable ECT
in-spections. There are many different types of bridge that can be implemented, the
aims of which are to balance the impedance of the probe coil over undamaged
spec-imens, producing a very accurate difference measurement in response to defects. A
basic bridge is composed of two circuit arms each containing components for
im-peding the flow of current (figure 2.6). One arm comprises components of known
impedance (Z1andZ2) and the other contains one component of known impedance,
Z3, and another is the unknown ECT coil (ZL).
The voltage difference between the two arms will be zero if the total impedances
of each arm are equal, otherwise a voltage difference is observed. The system can
be tuned to balance the unknown arm by varying Z2 in the known-arm (i.e.
V
Z1 Z3
Z2
ZL
a)
V
Z1 Z3
ZL2 ZL1
b)
V
Z1 Z3
ZL2 ZL1
c)
Figure 2.7: Schematic diagrams of impedance bridge types for eddy-current inspec-tion measurements showing a) Absolute, b) Differential and c) External reference measurement configurations.
to balance the probe when it is over undamaged material, improving the dynamic
sensing range of the system and increasing sensitivity to defects [45]. The use of a
bridge introduces an analogue difference measurement which can be highly sensitive
to defects whilst being unaffected by variations in the surrounding environment.
Eddy-current measurements are frequently performed with the use of a
bal-ancing reference coil as the Z2 component in figure 2.6. This is typically of a
matching inductance to the inspection coil and can be implemented in a number of
ways. Figure 2.7 shows the most common eddy-current measurement circuits of this
sort (see section 2.2.3 for information on their advantages).
2.2.5 Eddy-Current Excitation
Electromagnetic coil probes generate and detect eddy-currents by the principles of
Amperes’ and Faradays’ Laws (see chapter 3). As a result they require a changing
excitation field to generate and detect magnetic fields. The simplest excitation is
a continuous monotonic sinusoidal waveform, however there are many other more
Multi-Frequency Measurements
Standard ECT inspections use a single frequency technique where the coil is driven
at a fixed sinusoidal frequency. High frequency ECT operations are limited by
the skin depth to detecting small surface defects. However, it is often desirable to
achieve greater sub-surface detection with ECT inspections. One solution would be
to lower the excitation frequency thereby increasing the depth of penetration, but
this method comes with a reduction in the sensitivity to the smaller surface defects
as current can pass underneath. In addition, Faradays law states that induced
volt-ages are proportional to the rate of change of the magnetic field which will decrease
with decreasing frequency.
More information can be acquired if multiple frequencies are used to
gener-ate eddy-currents flowing at different depths [75]. Different discontinuity properties
(lift-off, temperature variation etc.) lead to different phase angles in signals which
can be identified by experienced users when observed independently (see figure 2.9).
Problems arise when multiple discontinuity properties are present in a single defect
signal leading to a more complicated signal with increased noise. It is often the
case that multiple unwanted factors are present in the signals of real defects.
Multi-frequency techniques perform successive tests at two or more frequencies that, when
combined, will cancel out the undesirable signals, hence improving the
signal-to-noise-ratio (SNR) [42, 45, 76].
Bartels and Fisher [77] investigated using the linear summation of both real
and imaginary components of impedance of a four frequency inspection in order
to gain greater SNR. This approach combines both the magnitude and phase
in-formation of 2D impedance images and the authors claimed to improve the SNR
by up to 1100% compared to traditional two-frequency techniques. There are many
techniques for performing multi-frequency ECT inspections, including separate
sinu-soidal excitation of two or more frequencies, frequency sweeping and pulse excitation
Pulsed Eddy-Current (PEC)
Pulsed ECT, sometimes referred to as transient ECT involves the excitation of a
broad band of eddy-current frequencies by applying a voltage pulse to the excitation
coil and measuring the time-domain response of the material to signals can be used
to excite a broad spectrum of frequencies, providing many levels of material
pene-tration and thus more information than simpler single frequency techniques. The
data across multiple frequencies can be correlated, as per other multi-frequency
techniques, to remove unwanted signals, making the characterization of defects
eas-ier than with other methods. The spectrum of frequencies scales inversely with the
pulse length, so shorter pulses generate a wider range of frequencies [44, 45]. PEC
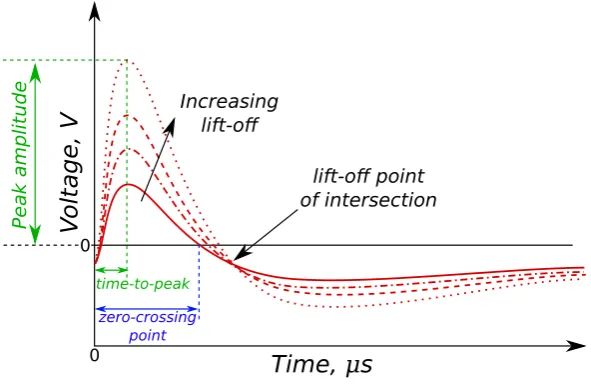
Increasing lift-off
Time, 𝜇s
V
oltage, V
lift-off point of intersection
0 0
Peak
amplitude
time-to-peak
[image:47.595.173.469.336.528.2]zero-crossing point
Figure 2.8: Example pulsed eddy-current signal responses in the time domain show-ing responses at various lift-offs from the material. Showshow-ing lift-off point of inter-section, peak amplitude, time-to-peak and zero-crossing point, after [85, 86].
techniques predominately analyse the critical features of signal response in the
time-domain (figre 2.8), such as the peak amplitude, time-to-peak, zero crossing-point
and the lift-off point of intersection. Giguare et al. [85] performed investigations
into pulsed ECT as a means of lift-off compensation known as Lift-Off Invariance
of received signals that is independent of lift-off, known as the cross-point. By
mea-suring the signals within a time gate about the cross-point (figure 2.8), mapping of a
material surface can be performed largely unaffected by variations in lift-off [87, 88].
However analysis of the time-domain signal is relatively sensitive to noise [82].
Chirp Excitation
Chirp excitation involves using a sinusoidal input function whose frequency linearly
increases with time. The result is an input signal that sweeps through a range of
frequencies in the time domain. The mathematical form of a chirp input is defined
as,
s(t) =A(t)eiω(t)t, (2.2)
whereA(t) is the function envelope, and ω(t) is the time varying angular frequency
[82]. Chirp measurement analysis of a signal response is typically made in the
frequency domain. Chirp methods have widespread applications in radar systems
[98, 99] but have had less attention in eddy-current testing research compared to
pulsed and multi-frequency excitation.
2.3
Other Magnetic Field Sensors
In recent years, other methods for detecting and measuring the magnetic field of
eddy-currents have seen increased attention due to their high sensitivity over large
frequency ranges, and at lower frequencies than electromagnetic coils. These
in-clude giant magnetoresistors (GMR), superconducting quantum interference devices
(SQUIDS) and Hall probes. Novkovski [101] outlines the main magnetic field
sen-sors and discusses their suitability for use in nano-sensen-sors in the pursuit of greater
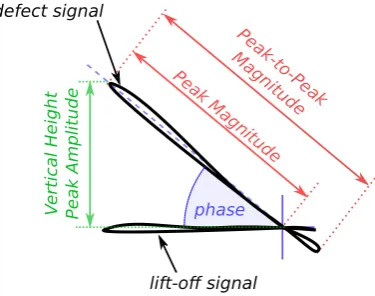

![Figure 2.11: Example diagram of normalized impedance plane showing conductivity-frequency curve, lift-off and defect signal directions for a non-ferromagnetic material.After [44].](https://thumb-us.123doks.com/thumbv2/123dok_us/9524665.457735/54.595.218.424.200.431/example-normalized-impedance-conductivity-frequency-directions-ferromagnetic-material.webp)