jinchang.ren, j.soraghan, stephen.marshall}@strath.ac.uk
Abstract—In this paper a novel feature extraction technique for micro-Doppler classification and its real time implementation using SVM on an embedded low-cost DSP are presented. The effectiveness of the proposed technique is improved through the exploitation of the outlier rejection capabilities of the Robust PCA in place of the classic PCA.
Index Terms—Micro-Doppler, Radar, Classification, Embedded Sys-tems, SVM, Robust PCA.
I. INTRODUCTION
Moving targets illuminated by a radar system introduce frequency modulations due to the time-varying delay occurring between the target and the system sensor. The main bulk translation of the target relative to the sensor induces a frequency shift of the echo as a result of the Doppler effect. However, the target may contain parts which have additional movements with respect to the main target motion. Such movements can contribute frequency modulations around the main Doppler shift and that are commonly referred to as micro-Doppler (m-D) modulations. Micro-micro-Doppler can be regarded as a unique signature of the target and it provides additional information that is complementary to existing methods for target classification and recognition. Specific applications include the recognition of space, air and ground targets. Chen [1], [2] models the radar m-D phenomenon and simulates m-D signatures for various targets, such as rotating cylinders, vibrating scatterers and human targets. The author also shows that an effective tool in extracting the m-D signature of the received signal is time-frequency analysis. Recently, novel techniques and technologies have opened a wider set of applications for micro-Doppler signatures, such as imaging radar, passive radar and acoustic micro-Doppler [3]–[6]. For example m-D signatures can be used for human identification under different weather and lighting conditions. In particular, specific components of an m-D gait signature can be related to parts of the body for identification purposes [7], [8]. The motion of human bodies is an articulated locomotion [2]. The motion of limbs in a human body can be characterized by a repeated periodic movement. Walking is a typical human articulated motion and can be decomposed into a periodic motion in the gait cycle. Various human movements, such as walking, running, or jumping, have different body movement patterns. Compared with visual image sequences, radar micro-Doppler signatures are not sensitive to distance, light conditions and background complexity, this is advantageous in order to estimate gait characteristics.
Effective signature extraction techniques have been developed and tested on real data [8]–[17], providing features which lead to classification results with a high level of confidence. However, a feature extraction and classification technique which, at the same time, is effective and can be implemented for real time applications on low-cost embedded processing devices has not previously been proposed in the literature. In addition, in some of the best techniques
proposed to date, in terms of classification rate, the performance analysis is inaccurate and fails to provide a good estimate of the classifier. For example, the robust extraction method described in [9] for feature vectors invariant to the target average velocity, aspect angle and initial target phase is shown to yield good results; however, the analysis provided in the article lacks details and the dependence of the performance on the training dataset is not analysed. In [14] and [16] a template-based approach with interesting results is proposed; nonetheless, the overall performance of this method does not achieve very high levels of confidence and further developments are not proposed. In [13] a simple method for feature extraction from the time-frequency distribution of the radar return is described, but the resulting feature vector may contain a high number of components, making its implementation on low-cost embedded devices difficult. Moreover, the performance analysis in this case is not rigorous.
The main contribution of this paper is a novel robust feature extraction method for micro-Doppler signatures that allows real time implementation on low-cost embedded processing devices. The proposed method exploits the robust PCA based on the minimum covariance determinant (MCD) estimator [18]–[22] to improve the classification performance. Such a novel micro-Doppler classification algorithm combines high confidence of the classification results and low memory and power consumption requirements. The second contribution of the paper is the implementation of the Support Vector Machine (SVM) classifier on a Texas Instruments TMS320C6713 DSP embedded board [23], which demonstrates the ability to achieve classification with high confidence in real time. The proposed system is tested on real data and a rigorous performance analysis is also given.
The remainder of the paper is organised as follows. Section II introduces the novel feature extraction algorithm and classification method and gives details of their DSP embedded implementation. Section III shows the effectiveness of the proposed system with results on real data, while Section IV concludes the paper.
II. MICRO-DOPPLERCLASSIFICATIONALGORITHM
A block diagram of the proposed micro-Doppler classification algorithm is illustrated in Figure 1. The two branches of the diagram show the training (left) and the test (right) flow of the data to obtain the feature vectors (FVs) fed to the SVM classifier. The training data set is only used to train the SVM. The feature extraction technique described in the following subsection is also calibrated based on the training data set for the reduction of the feature dimensionality.
A. Feature extraction method
Figure 1. Flow diagram of the proposed micro-Doppler classification algorithm.
original signal, but with a reduced number of components, in order to have a fast decision from the classifier. For this reason a novel feature extraction method simpler than those used in other works [9], [13] is proposed. The starting point of such a novel technique is the signal models(t)of a target with micro-motion, defined as:
s(t) =ρexp
j4πR0(t) λ
exp{j2πf0t−j2πfmD(t)} (1)
whereR0is the reference distance between the target and the radar,λ is the carrier wavelength,f0is the carrier frequency andfmD(t)is the
function of the micro-Doppler frequency shift. The discrete version s(n) of the signals(t)is obtained by sampling and quantising the signal in (1).
—————————————————-Insert Figure 1 here
——————————————————
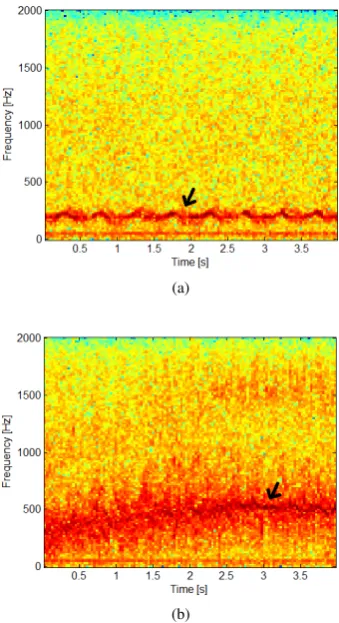
As illustrated in Figure 1, the first step is the computation of the Short Time Fourier Transform (STFT) to obtain information concerning the variation in time of the frequency content of the signal. An example of the STFT of the received echoes from a walking person is shown in Figure 2-a. From such a time-frequency distribution, some details of the micro-Doppler shift due to the arms and legs moving toward the radar can be seen in the lower part of the figure, as pointed out by the arrow, in the range0−300Hz. Another example of the micro-Doppler shift can be seen in the STFT illustrated in Figure 2-b, for a group of running people.
—————————————————-Insert Figure 2 here
——————————————————
From the STFT, the Mean Frequency Profile (MFP) is computed as the mean along the time axis of the absolute value for each frequency ν, as in (2):
(a)
(b)
Figure 2. STFT (logarithm scaled) of the radar return in Ku band (16.8 GHz) from (a) a walking person and (b) a group of running people in Ku band (16.8 GHz).
M F P(ν) = 1
M
M
X
m=1
|ST F T(ν, m)| M F P(ν)∈RL (2)
whereMis the number of time instants (columns) of the STFT andL is related to the number of DFT points. The MFP highlights important aspects of the time-frequency representation of a target, that can be exploited to distinguish between different targets. In this context there are two main characteristics in the MFP. The first, is the location of the frequency peak. The three targets’ cadence can be distinguished from the peak location. For crawling movement, the peak frequency is relatively low, while for running it is much higher. The walking movement corresponds, therefore, to an intermediate frequency. The second characteristic is based on the width to the frequency peak. In order to discriminate among one person and a group of people, the fact that a group of persons will exhibit different velocities for the different moving parts of each subject can be exploited. This effect results in the broadening of the instantaneous Doppler bandwidth, on the MFP it will appear as a wider main peak.
The MFP extracts these two characteristics, assuming a relatively constant cadence in the target’s movement over windows of time be-tween 0.5 and 4 seconds. In that sense, partial frequency information such as that related to the movement of different and specific parts of the body (arms, legs) may be mostly lost in the MFP average, as their contribution can be discarded.
—————————————————-Insert Figure 3 here
——————————————————
[image:2.595.337.507.59.371.2]0 500 1000 1500 2000 0
[image:3.595.334.512.58.382.2]Frequency [Hz]
Figure 3. Mean Frequency Profiles from the STFT analysis shown in Figure 2-a and Figure 2-b.
2-b are shown in Figure 3. The discriminating characteristics of the micro-Doppler signature of the different targets can be appreciated.
As the feature vectorM F P(ν)contains a high number of compo-nents, its direct application would increase the computational burden of the classification stage. For this reason the number of components needs to be reduced, while retaining the good discrimination property of the features. A solution is found in the Principal Component Analysis (PCA) [24], to extract a reduced set of components from the feature vector. In addition, the PCA de-correlates the components of the feature vector and so it increases the significance of each component, while reducing redundancy. This means that the same amount of information can be obtained with a smaller feature set.
However dealing with real data can imply the presence of unex-pected observations within the data to be processed by the PCA, with the estimation of the transformation matrix being influenced by these outliers. This causes an incorrect projection of the data along the principal components, which results in an incorrect de-correlation of the different features.
To solve this problem the PCA is replaced with a Robust PCA (RPCA) based on the Minimum Covariance Determinant (MCD) estimator [19], [20]. The first step to reduce the effect of outliers is to identify and discard them, in the estimation of the covariance matrix used by PCA to re-project the data. One way to identify possible multivariate outliers is to calculate a distance of each point from the “centre” of the data. An outlier would be a point with a distance larger than some predetermined threshold. The Minimum Covariance Determinant provides a highly robust estimate of multivariate location and scatter that can eliminate up to50%of the data as outliers [20]. In other words, it attempts to use only the reliable part of the sample rejecting up to 50% the data as anomalies that would corrupt the covariance matrix. The MCD estimator is therefore better than other robust estimators, as it is more precise in evaluating robust distances and then in detecting outliers.
As for conventional PCA, the Robust PCA also uses the eigenvalue decomposition (EVD) [24] to diagonalise the robust covariance matrixCof the data and obtain a transformation matrix as:
C=VDVT V∈RR×Q (3)
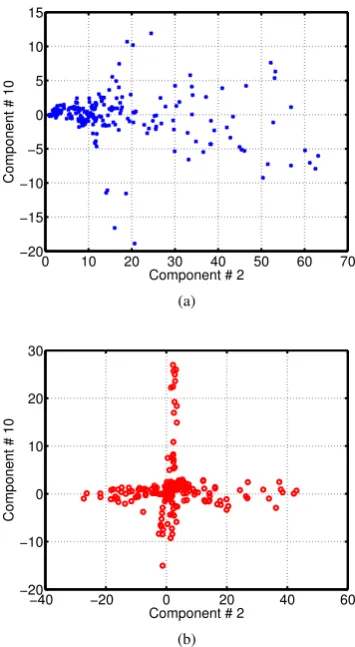
The transformation matrixVby which theM F P(ν) is reduced to the effective feature vectorF, is obtained offline from the training samples only and then it is used for both the data reduction of the training and testing samples. To illustrate the advantages of RPCA over PCA, the scatter plots for components 2 and 10 of real micro-Doppler data over 238 observations of real Ku-band data of different classes are shown in Figure 4-a and 4-b, using PCA and RPCA
0 10 20 30 40 50 60 70 −20
Component # 2
(a)
−40 −20 0 20 40 60
−20 −10 0 10 20 30
Component # 2
Component # 10
[image:3.595.84.247.61.194.2](b)
Figure 4. Scatter plots of 2 principal components for 238 observations of real micro-Doppler radar data using the (a) PCA and (b) Robust PCA.
respectively.
—————————————————-Insert Figure 4 here
——————————————————
In Figure 4-b it is clear that the RPCA is able to project the data on two orthogonal axes, while the PCA fails.
Therefore theM F P(ν)is reduced in dimension using the RPCA, from L to a subset of Qcomponents, finally obtaining the feature vectorsFas in (4):
F=P CAQ(M F P(ν)) F∈RQ (4)
where P CAQ() represents the operator that projects the data over
the firstQprincipal components.
—————————————————-Insert Figure 5 here
——————————————————
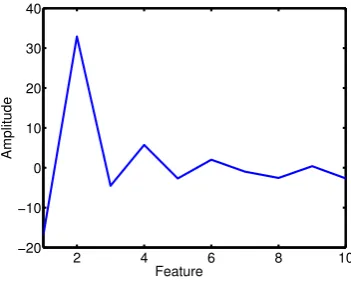
In Figure 5 an example of the obtained feature vector, relative one person walking, is shown by applying the proposed technique to the MFP illustrated in Figure 3 . Despite the reduced number of components, the characteristic features are still visible, therefore preserving the discrimination between different classes.
The last stage of the feature extraction method includes the normalisation of the feature vectorsFby zero mean and unit variance range in order to obtain scaled featuresFˆ. This stage is required to ensure the best performance of the SVM classifier. The normalisation parameters(µ, σ2)
2 4 6 8 10 −20
−10 0 10 20 30 40
Feature
[image:4.595.72.248.60.202.2]Amplitude
Figure 5. Feature vector reduced in components.
ˆ
F= F−µ
σ i∈[1, Q] (5)
The novel technique proposed here is not only much simpler than those presented in literature [7], [9], [14], but also achieves similar accuracy in SVM classification of real radar data, with fewer require-ments in memory usage for the extraction and classification in real time, therefore being especially appropriate for embedded systems.
An important aspect is the choice of the training data, as they are used not only for the training of the SVM, but also for the dataset reduction transformation matrix and for the normalisation values. In Section III it is demonstrated through a Monte Carlo analysis [25] that the proposed technique provides good results across a broad range of training datasets.
B. Embedded implementation of SVM
In order to implement a real time classification system exploiting the proposed extraction technique, the low-cost floating-point DSP board TMS320C6713 DSK from Texas Instruments [23] has been used. The TMS320C6713 is a Digital Signal Processor with a two-level cache-based architecture and it can execute multiple instructions per cycle, to deliver up to 1350 million floating-point operations per second. This DSP has a large set of peripherals, such as multichannel audio and general-purpose input and output pins, and it implements the Real Time Data eXchange (RTDX) protocol [26], [27] to transfer data to and from external devices. Despite being a high-performance DSP, the TMS320C6713 is low-cost and also exhibits low power consumption, making it ideal for embedded applications in small portable devices. In the context of the system described in this paper, the RTDX protocol is used to send testing samples from a Matlab environment running on the host computer to the DSP, to evaluate the embedded classification system in real time. The DSP processor is able to compute the output of the classification in less than one second, displaying the result both on the host display and on the on-board LEDs, or by saving it to file on the host computer.
The starting point for the implementation of the SVM classifier is the SVMlight software package [28], adopting the so-called One Against All (OAA) approach [29]. The algorithms from this library have been implemented and tested on the DSK board using C#
language, leading to exactly the same results obtained on a computer [30].
Once again it must be noticed that before feeding the test points to the SVM classifier, all the samples are normalised by the parameters obtained during the offline training process and therefore they only depend on the training samples. This is an important difference in
relation to other works [9], [13] that seem to ignore this consideration; whilst this assumption can lead to better results it is not realistic in practice.
III. RESULTS
The proposed system has been tested with real Ku band radar data [31]–[33]. Each sample has been selected from a different record.Each acquisition has a duration of 4 seconds, for the different classes a different number of acquisitions was performed. From each acquisition, a maximum of 4 seconds could be used. In addition the system has also been tested with shorter acquisition times of
2, 1 and 0.5 seconds respectively. The choice of different time window lengths is important to evaluate the algorithm performance for different durations of the acquisition process. In particular, it is expected to have an inferior classification performance in the case of shorter acquisitions. However, for some applications a trade-off between acquisition time length and classification accuracy could be required.
Attention has been focused on5different classes of data, including in the same class the case of a target moving toward and away from the radar location. A summary of the classes and acquisitions is reported below for a total of238acquisitions:
• Class 1. Person running toward/away from the radar (240s,60
samples);
• Class 2. Person walking toward/away from the radar (240s,60
samples);
• Class 3. Person crawling (72s,18samples);
• Class 4. Group of people running toward/away from the radar
(200s,50samples);
• Class 5. Group of people walking toward/away from the radar
(200s,50samples);
From all the available samples,70%are used for training, while the other30% are used for testing. In order to characterise statistically the classifier and its performance, a Monte Carlo approach has been applied, using different selections of the training and test sets of the data chosen randomly for each class . To obtain an estimation of the statistics of the performance of the classifier, 50 different experimental cases have been evaluated, reporting the mean, standard deviation, maximum and minimum values.
The STFT is implemented with 256 points for the FFT, i.e. N = 256, and a Hamming window of the same length (W = 256), with 50% overlap. This small number for N leads to less com-putational complexity. The choice of N is a parameter dependent on the acquisition system (i.e. Pulse Repetition Frequency) and the expected time dynamic of the targets (i.e. humans, animals rather than helicopters). Once the mean frequency profiles are obtained, the next step is to apply the RPCA in order to extract the main features representing the profile. An important parameter in the RPCA based on the MCD is the maximum percentage of data that are not assumed to be outliers, this parameter is indicated ash. The value ofhcan be selected between0.5and1, where0.5is the worst case that can be handled by the MCD, i.e. assuming as outliers half of the data. For the reported tests the value ofh= 0.6L has been used, assuming a high number of outliers. This assumption is restrictive, but realistic for a noisy scenario. Despite this assumption, the proposed approach still provides good results. Increasing the value of h (for example
0.7) produces slightly better results; however, in order to present a robust algorithm, it has been decided to assume the value ofhwhich is able to deal with a very noisy scenario.
information has been already included in the first 20 components and no additional information is present in other signal components. From the results it can be seen how the features extracted using the RPCA produce results better or aligned with those obtained with the PCA-based approach. In particular it can be seen how, with the same number of components, the RPCA outperforms the PCA-based approach. For example using10components only the RPCA always obtains a higher success rate than the PCA. This implies that the same performance can be obtained with fewer components and less complexity. As described before, the use of the RPCA introduces a higher computational cost only at the training stage, meaning that the use of the RPCA instead of the PCA introduces a cost-free benefit on the real time classifier.
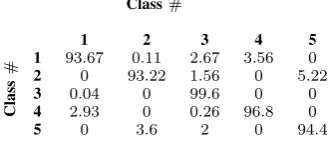
Table III
CONFUSION MATRIX(%)FOR THE4SECONDS ACQUISITION OVER50
TESTS USING THEROBUSTPCAWITH60%OF VALID SAMPLES OF THE
M F P(ν)S.
Class#
Class
#
1 2 3 4 5
1 93.67 0.11 2.67 3.56 0
2 0 93.22 1.56 0 5.22
3 0.04 0 99.6 0 0
4 2.93 0 0.26 96.8 0
5 0 3.6 2 0 94.4
In Table III the average confusion matrix (relative) obtained using the RPCA approach on the proposed features for the case of 4s of observation and40components is shown. The confusion matrix shows that the classifier mis-classifies in particular between classes 2 and 5 (Person walkingandGroup of people walking); and between the classes 1 and 4 (Person runningandGroup of people running). The explanation for this error can be found in the normalisation of the feature vector. This operation removes the relative amplitude due to the presence of multiple targets. However this operation dramatically increases the SVM performance in general. This aspect can be object of future investigations.
Compared with the results on the same datasets obtained in [9] and in [17], the results reported above are in the same order of accuracy, but the analysis presented in this paper is more comprehensive. In addition the computational burden is reduced as in [9] the Singular Value Decomposition is performed on the acquired data to obtain the feature vector. In [17] an instantaneous frequency analysis com-bined with a multiplicative multi-resolution descriptor approach is proposed. In this paper the best classification results was 93% for the4s samples. In this particular case the performances of the new algorithm presented is on average over94%reaching100%in some cases outperforming the results presented in [17].
The second goal of the presented work is to obtain a classification system that can produce accurate results in real time. This would allow the exploitation of the classifier output for real time Automatic Target Recognition (ATR) and to support decision making systems. In order to show that a real time classification can be obtained, the
to provide real time classification of targets based on their micro-Doppler signature.
—————————————————-Insert Figure 6 here
——————————————————
10 20
30 40 50
0.5 1 2 4
10 20 30 40 50
Number of Components Acquisition length [s]
Elapsed time [ms]
[image:5.595.83.248.366.437.2]15 20 25 30 35 40 45
Figure 6. Average timing measurements over 50 tests for the 0.5, 1, 2, and 4 seconds acquisitions and 10, 20, 30, 40, 50 components.
IV. CONCLUSIONS
In this paper a novel approach for real time micro-Doppler clas-sification has been proposed. The new feature extraction algorithm presents more robust features with respect to the current state-of-the art. The algorithm is simple to implement, robust with respect to the presence of outliers in real data and suitable for implementation on low-cost signal processing devices. The robustness of the algorithm is increased by the use of the MCD estimator to obtain a Robust PCA in order to reduce the dimension of the final feature vectors. This aspect allows dimensionality reduction of the feature vectors whilst preserving the discriminating information among the different classes and maintaining the performance obtainable with a higher number of features. The feature vectors have then been used to train and test a SVM embedded on a Texas Instruments TMS320C6713 DSK. The proposed algorithm has been tested on real data and the performance of the classification have been characterised through Monte Carlo analysis. The results show the effectiveness of the proposed approach which produces high probability of correct classification. In addition the DSP board allows real time classification of the received echoes. This aspect is in accordance with the requirements of modern defence systems which includes high accuracy, combined with reduction of costs and power.
ACKNOWLEDGMENT
Table I
RESULTS FOR50TESTS OF THE DATASET USING THEPCAFOR DIFFERENT DURATIONS OF THE ACQUIRED DATA.
Success rate(%)
Acquisition length [s] 4 s 2 s 1 s 0.5 s
10 components
Mean and st. dev. 92.68±2.67 88.68±3.43 87.10±3.38 82.11±4.52
Max 97.18 95.77 94.37 90.14
Min 87.32 78.87 80.28 71.83
20 components
Mean and st. dev. 94.56±3.01 90.54±2.96 90.25±3.15 87.07±4.21
Max 100 95.77 97.18 95.77
Min 88.73 84.51 84.51 74.65
30 components
Mean and st. dev. 94.62±2.83 91.55±2.87 89.52±3.31 86.28±4.65
Max 100 95.77 95.77 92.96
Min 88.73 83.10 81.69 73.24
40 components
Mean and st. dev. 94.79±2.69 91.63±2.44 88.90±3.77 86.11±3.70
Max 100 97.18 95.77 92.96
Min 90.14 85.92 80.28 77.46
50 components
Mean and st. dev. 94.62±2.52 91.66±2.65 88.90±3.77 86.11±3.70
Max 100 97.18 95.77 95.77
Min 90.14 87.32 78.87 74.65
REFERENCES
[1] V.C. Chen, F. Li, S.-S. Ho, and H. Wechsler, “Micro-Doppler effect in radar: phenomenon, model, and simulation study,” IEEE Transactions on Aerospace and Electronic Systems, vol. 42, no. 1, pp. 2–21, 2006. [2] V. Chen, Micro-Doppler Effect in Radar, Artech House, 2011. [3] C. Clemente and J. J. Soraghan, “Vibrating target micro-Doppler
signature in bistatic SAR with a fixed receiver,”IEEE Transactions on Geoscience and Remote Sensing, vol. 50, no. 8, pp. 3219–3227, 2012. [4] C. Clemente and J. J. Soraghan, “Vibrating micro-Doppler signature
extraction from SAR data using singular value decomposition,” in European Conference on Synthetic Aperture Radar, 2012, pp. 191–194. [5] C. Clemente and J. J. Soraghan, “Passive bistatic radar for helicopters
classification: A feasibility study,” inRadar Conference, 2012. [6] A. Balleri, K. Chetty, and K. Woodbridge, “Classification of personnel
targets by acoustic micro-Doppler signatures,” IET Radar, Sonar Navigation, vol. 5, no. 9, pp. 943–951, 2011.
[7] D. Tahmoush and J. Silvious, “Radar micro-Doppler for long range front-view gait recognition,” in IEEE International Conference on Biometrics: Theory, Applications, and Systems, 2009, pp. 1–6. [8] Y. Kim and H. Ling, “Human activity classification based on
micro-Doppler signatures using a Support Vector Machine,”IEEE Transactions on Geoscience and Remote Sensing, vol. 47, no. 5, pp. 1328–1337, 2009. [9] P. Molchanov, J. Astola, K. Egiazarian, and A. Totsky, “Classification of ground moving radar targets by using joint time-frequency analysis,” inIEEE Radar Conference, 2012, pp. 366–371.
[10] P. Molchanov, J. Astola, K. Egiazarian, and A. Totsky, “Ground moving target classification by using DCT coefficients extracted from micro-Doppler radar signatures and artificial neuron network,” inMicrowaves, Radar and Remote Sensing Symposium, 2011, pp. 173–176.
[11] P. A. Molchanov, J. T. Astola, K. O. Egiazarian, G. I. Khlopov, V. Y. Morozov, B. B. Pospelov, and A. V. Totsky, “Object recognition in ground surveillance Doppler radar by using bispectrum-based time-frequency distributions,” inInternational Radar Symposium, 2010, pp. 1–4.
[12] P.O. Molchanov, J.T. Astola, K.O. Egiazarian, and A.V. Totsky, “Mov-ing target classification in ground surveillance radar ATR system by using novel bicepstral-based information features,” inEuropean Radar Conference, 2011, pp. 194–197.
[13] S. Bjorklund, T. Johansson, and H. Petersson, “Evaluation of a micro-Doppler classification method on mm-wave data,” in IEEE Radar Conference, 2012, pp. 934–939.
[14] G. E. Smith, K. Woodbridge, and C. J. Baker, “Template based
micro-Doppler signature classification,” inRadar Conference, 2006, pp. 158– 161.
[15] G. E. Smith, K. Woodbridge, C. J. Baker, and H. Griffiths, “Multistatic micro-Doppler radar signatures of personnel targets,” IET Signal Processing, vol. 4, no. 3, pp. 224–233, 2010.
[16] G. E. Smith, K. Woodbridge, and C. J. Baker, “Radar micro-Doppler signature classification using dynamic time warping,”IEEE Transactions on Aerospace and Electronic Systems, vol. 46, no. 3, pp. 1078–1096, 2010.
[17] A. Serir and Y. Bouhafsi, “Micro-Doppler radar signature classification by time-frequency and time-scale analysis,” inInternational Conference on Information Science, Signal Processing and their Applications, 2012, pp. 995–1000.
[18] P. Rousseeuw and A. Leroy, Robust Regression and Outliers Detection, John Wiley & Sons, 1987.
[19] P. Rousseeuw, “Least median of squares regression,” Journal of the American Statistical Association, vol. 79, no. 388, pp. 871–880, 1984. [20] P. Rousseeuw, Multivariate Estimation With High Breakdown Point,
vol. B, Mathematical Statistics and Applications, 1985.
[21] P. Rousseeuw and K. Driessen, “A fast algorithm for the minimum covariance determinant estimator,” Technometrics, vol. 41, no. 3, pp. 212–223, 1999.
[22] T. Beltramonte, C. Clemente, D. di Bisceglie, and C. Galdi, “Robust multiband detection of thermal anomalies using the minimum covariance determinant estimator,” inIEEE International Geoscience and Remote Sensing Symposium. 2009, pp. 65–68, IEEE.
[23] Texas Instruments,TMS320C6713 DSK Technical Reference, May 2003. [24] I. T. Jolliffe,Principal Component Analysis, 2nd edition, Sprinter Series
in Statistics, 2002.
[25] G. S. Fishman, Monte Carlo: Concepts, Algorithms and Applications, Springer, 1995.
[26] R. Chassaing,Digital Signal Processing and Application with the C6713 and C6416 DSK, Jonh Wiley&Sons, Inc, 2005.
[27] Texas Instruments, How to Write an RTDX Host Application Using MATLAB, 2002.
[28] J. Thorsten, “Making large-scale support vector machine learning practical,” inAdvances in kernel methods, pp. 169–184. MIT Press, 1999.
[29] V. N. Vapnik,Statistical Learning Theory, Wiley, 1998.
Mean and st. dev. 94.45±2.76 90.90±3.03 90.37±3.25 87.30±4.75
Max 98.59 95.77 95.77 97.18
Min 88.73 83.10 83.10 73.24
Improvement over PCA −0.12 +0.40 +0.13 +0.26
30 components
Mean and st. dev. 94.62±2.88 91.72±2.81 89.72±3.16 86.56±4.42
Max 100 95.77 95.77 94.37
Min 88.73 83.10 81.69 74.65
Improvement over PCA +0.00 +0.19 +0.22 +0.32
40 components
Mean and st. dev. 94.76±2.67 91.61±2.45 88.79±3.23 86.37±3.68
Max 100 97.18 94.37 92.96
Min 90.14 85.92 81.69 77.46
Improvement over PCA −0.03 −0.02 −0.12 +0.30
50 components
Mean and st. dev. 94.59±2.53 91.66±2.68 89.10±3.77 86.31±4.54
Max 100 97.18 95.77 95.77
Min 90.14 85.92 78.87 74.65
Improvement over PCA −0.03 +0.00 +0.23 +0.23
[31] “The database of radar echoes from various targets [online], available: http://cid-3aaf3e18829259c0.skydrive.live.com/home.aspx,” .
[32] M. S. Andric, B. P. Bondzulic, and B. M. Zrnic, “The database of radar echoes from various targets with spectral analysis,” inSymposium on Neural Network Applications in Electrical Engineering, 2010, pp. 187–190.
[33] M. S. Andric, B. P. Bondzulic, and B. M. Zrnic, “Feature extraction related to target classification for a radar doppler echoes,” in Telecom-munications Forum, 2010, pp. 725–728.
• Figure 1: Flow diagram of the proposed micro-Doppler
classi-fication algorithm.
• Figure 2: STFT (logarithm scaled) of the radar return in Ku
band (16.8 GHz) from (a) a walking person and (b) a group of running people in Ku band (16.8 GHz).
• Figure 3: Mean Frequency Profiles from the STFT analysis
shown in Figure 2-a and Figure 2-b.
• Figure 4: Scatter plots of 2 principal components for 238
observations of real micro-Doppler radar data using the (a) PCA and (b) Robust PCA.
• Figure 5: Feature vector reduced in components.
• Figure 6 :Average timing measurements over 50 tests for the