warwick.ac.uk/lib-publications
Original citation:
Zhang, Qiang, Bhalerao, Abhir, Parsons, Caron, Helm, Emma and Hutchinson, Charles. (2016)
Wavelet appearance pyramids for landmark detection and pathology classification :
application to lumbar spinal stenosis. Medical Image Computing and Computer-Assisted
Intervention – MICCAI 2016 : 19th International Conference, Athens, Greece, October 17-21,
2016, Proceedings, Part II . pp. 274-282.
Permanent WRAP URL:
http://wrap.warwick.ac.uk/80150
Copyright and reuse:
The Warwick Research Archive Portal (WRAP) makes this work by researchers of the
University of Warwick available open access under the following conditions. Copyright ©
and all moral rights to the version of the paper presented here belong to the individual
author(s) and/or other copyright owners. To the extent reasonable and practicable the
material made available in WRAP has been checked for eligibility before being made
available.
Copies of full items can be used for personal research or study, educational, or not-for profit
purposes without prior permission or charge. Provided that the authors, title and full
bibliographic details are credited, a hyperlink and/or URL is given for the original metadata
page and the content is not changed in any way.
Publisher’s statement:
“The final publication is available at Springer via
http://dx.doi.org/10.1007/978-3-319-46723-8_32
A note on versions:
The version presented here may differ from the published version or, version of record, if
you wish to cite this item you are advised to consult the publisher’s version. Please see the
‘permanent WRAP URL’ above for details on accessing the published version and note that
access may require a subscription.
Wavelet Appearance Pyramids for Landmark
Detection and Pathology Classification:
Application to Lumbar Spinal Stenosis
Qiang Zhang1, Abhir Bhalerao1, Caron Parsons23, Emma Helm2, and Charles Hutchinson23
1
Department of Computer Science, University of Warwick, Coventry, UK
2
Division of Health Sciences, University of Warwick, Coventry, UK
3
Department of Radiology, University Hospital Coventry and Warwickshire, Coventry UK
Abstract. Appearance representation and feature extraction of anatomy or anatomical features is a key step for segmentation and classification tasks. We focus on an advanced appearance model in which an object is decomposed into pyramidal complementary channels, and each channel is represented by a part-based model. We apply it to landmark detection and pathology classification on the problem of lumbar spinal stenosis. The performance is evaluated on 200 routine clinical data with varied pathologies. Experimental results show an improvement on both tasks in comparison with other appearance models. We achieve a robust land-mark detection performance with average point to boundary distances lower than 2 pixels, and image-level anatomical classification with accu-racies around 85%.
1
Introduction
attention has been paid to optimising the appearance representation and pre-serving the anatomical details.
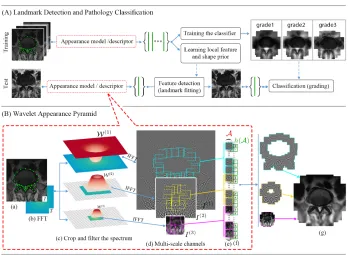
We propose a new appearance model referred to as a Wavelet Appearance Pyramid (WAP) to improve the performance of landmark detection and pathol-ogy classification, see an overview in Fig. 1(B). The object is decomposed into multi-scale textures and each scale is further decomposed into simpler parts. To achieve an explicit scale decomposition, the filter banks are designed and arranged directly in Fourier domain. The logarithmic wavelets (loglets) [6] are adopted as the basis functions of the filter banks for their superior properties, such as uniform coverage of the spectrum (losslessness) and infinite number of vanishing moments (smoothness). The scales are complementary in the Fourier domain which enables the reconstruction of the appearance from a WAP. The variations in the population can be modelled and visualised, with the deforma-tion approximated by local rigid transladeforma-tions of the multi-scale parts, and the appearance changes by linear modes of the assembly of the parts.
We apply the WAP to the problem of lumbar spinal stenosis (LSS) and present an approach for fitting the landmarks and grading the central and fore-menal stenosis [7, 8]. The Supervised Descent Method (SDM) [2] is integrated with the WAP for landmark detection. The performance is validated on MRI data from 200 patients with varied LSS symptoms. Experimental results show an improvement in both the landmark detection and pathology grading over other models such as ASMs, AAMs [1], and CLMs [9]4.
2
Method
To provide a more comprehensive description of an object, we decompose the ap-pearance into pyramidal channels atcomplementary scale ranges with wavelets, and represent each channel with a part-based model. We refer to this form of appearance models as Wavelet Appearance Pyramids (WAP). We detail the method as follows.
Explicit Scale Selection in the Fourier Domain. We start by decompos-ing an image I into multi-scale channels directly in the Fourier domain. When considered in polar coordinates, the Fourier spectrum I actually spans a scale space with larger scales at lower frequency and smaller scales spreading out-wards. Therefore a multi-scale decomposition of image textures can be achieved explicitly by dividing the spectrum into subbands, see Fig. 2(b). In practice, filtering the spectrum with sharp windows will introduce discontinuities there-fore causing aliasing. To design a bank of window functions which are smooth in shape while uniformly cover the spectrum, we use loglets as the basis functions because they possess a number of useful properties [6].
Denoting the frequency vector byu and its length byρ, a bandpass window with a loglets basis can be designed in the Fourier domain as,
W(u;s) = erf
αlog
βs+12 ρ
ρ0 −erf αlog βs−12 ρ
ρ0
(1)
4
Fig. 1: (A) A standard approach of landmark detection and pathology grading. (B) The proposed appearance model (A) and feature descriptor (h(A)).
where αcontrols the radial bandwidth,s is an integer defining the scale of the filter, and β > 1 sets the relative ratio of adjacent scales – set to two for one octave intervals.ρ0is the peak radial frequency of the window with scales= 0.
To extract the sharp textures of an image, the first scale channel should cover the highest frequency components. Noting the uniform property of the loglets, we accumulate a group of loglets successively having one-octave higher central frequencies as the first scale window, i.e., W(1) = P
sW(u;s), s={0,−1, ...}, which achieves an even coverage towards the highest frequency, see the 1D profile in Fig. 2(a) shown as a red curve, and the 2D window in Fig. 2(c). The second and larger scale features can be selected by windows covering lower frequencies,
W(s)(u) =W(u;s−1).Profiles of two adjacent larger scale windows are shown in Fig. 2(a) as blue curves, and a 2D window shown in Fig. 2(d). For a lossless decomposition, the largest scale window should uniformly cover the lowest fre-quencies, so it is designed as a accumulation of the remaining loglets functions,
W(L)=P
sW(u;s), s={L−1, L, ...},see the green curve in Fig. 2(a).Lis the total number of scales in the filter banks.
[image:4.612.134.482.111.366.2]Fig. 2: (a) Radial profiles of the filters. (b) Scale selection in the Fourier domain. (c) The high pass filter in the Fourier domain. (d) The first bandpass filter.
of the windowed spectrum,I(s)=F−1(I · W(s)), s={1,2, ..., L}. The image is thus decomposed into complementary channels{I(s)}.
Wavelet Image Pyramid. It is evident that larger scale textures can be described sufficiently at a lower resolution. Note in Fig. 2(a) that the magnitude of the two larger scale windows beyond π/2 andπ/4 is almost zero. Therefore we can discard these areas of the spectrum, which results in an efficient down-sampling without information loss or aliasing effect5. As a result, the resolution is reduced by 2s at scalesand a subband pyramid is obtained, see Fig. 1(c)(d). Wavelet Appearance Pyramid (WAP). Given a landmark x, we ex-tract an image patch As at each scale s of the pyramid. All patches {As}Ls=1 have the same size in pixels, which describe the local features at octave larger scales, domain sizes and lower resolutions, see Fig. 1(d)(e). A WAP, denoted by Φ = [A,s], consists of an assembly of feature patches A = {{As,i}Ls=1}Ni=1 extracted at all the landmarks {xi}N1, and a shape s = [x1,x2, ...xN] desig-nating the locations of the patches. At larger scales fewer patches are manually chosen at key landmarks to reduce the overlapping. Φ is then flattened into a 1D vector serving as the profile of the anatomy. A further feature extraction function such as histogram of oriented gradients (HOG) can be readily applied on the patches to reduce the dimensionality and enhance its robustness, i.e.,
h(A) ={{h(As,i)}Ls=1}Ni=1, see Fig. 1(f). To reconstruct the original appearance from the profile, we first pad the patches at each scale with the geometry config-ured bys to recover the individual channels. As the scales are complementary, all channels are then accumulated to recover the object appearance, see Fig. 1(g).
Landmark Detection. We integrate our WAP representation with the SDM algorithm [2] for robust landmark detection. In order to deduce the true land-mark locations∗given an initial estimation ˆs, we extract the descriptorh(A(ˆs)) at ˆs and learn the mappingh(A(ˆs))→∆s∗, in which∆s∗=s∗−sˆ. The direct mapping function satisfying all the cases in the dataset is non-linear in nature and can be over-fitted. So we adopt the SDM algorithm and approximate the non-linear mapping with a sequence of linear mapping{R(i),b(i)}and landmark updating steps,
(
Mapping: ∆s(i)=R(i)h(A(ˆs(i))) +b(i),
Updating: ˆs(i+1)= ˆs(i)+∆s(i). (2)
5
[image:5.612.137.481.115.178.2]The descriptorh(A) is extracted and updated at each iteration. More details on the SDM can be found at [2].
Anatomical Classification. For the classification tasks, the correspondence of anatomical features should be built such that the differences among the de-scriptors account for the true variations rather than the miss-alignment. In a WAP the appearance correspondence is built by extracting local features at corresponding landmarks. A classifier predicts the label ` given an anatomi-cal observation Φ, i.e, ` = arg maxp(`|Φ). The most significant variations in the training data {Φ} can be learned by principal components analysis and the dimensionality reduced by preserving the first t significant components, which span a feature spaceP ∈RM×t withM being the dimensionality ofΦ. A WAP
therefore can be represented in the feature space by a compact set of parameters bΦ, i.e., bΦ =PT(Φ−Φ¯), in which ¯Φ is the mean of {Φ}. UsingbΦ as inputs the classifier now predicts`= arg maxp(`|bΦ). We train the classifier with the AdaBoost method, with decision trees as the week learners.
3
Results and Discussion
Fig. 3: (a) Mid-sagittal scan of a lumbar spine. Grey lines show the locations of the axial scans. Red lines show the aligned disc-level planes. (b) Anatomy of a normal L3/4 disc-level axial image. (c) A case with severe central stenosis. (d) Foraminal stenosis. The neural foramen are suppressed by the thickening of the facet (green) and the disc (red).
[image:6.612.135.483.359.456.2](cyan line) and the facet between the superior and inferior articular processes (green line) are typically inspected for diagnosis and grading. Degeneration of these structures can constrict the spinal canal and the neural foramen causing central and foraminal stenosis. Pathological examples are given in Fig. 3(c)(d). In clinical practice, parameters such as antero-posterior diameter, cross-sectional area of spinal canal are typically measured [7]. However due to the complexity of the vertebral structure, there is a lack of consensus in these parameters and no diagnostic criteria are generally applicable [8]. A more detailed appearance model of the anatomy, followed by a higher-level classification therefore could contribute to reliable and consistent diagnoses.
Data and Settings. The dataset consists of T2-weighted MRI scans of 200 patients with varied LSS symptoms. Each patient has routine paired sagittal-axial scans. The L3/4, L4/5, L5/S1 disc-level sagittal-axial planes are localised in the sagittal scans and the images sampled from the axial scans. We obtain 3 sub-set of 200 disc-level images from the three intervertebral planes, 600 images in total. Each image is inspected and graded, and the anatomy annotated with 37 landmarks outlining the disc, central canal and facet.
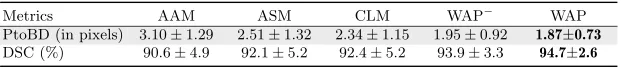
Results of Landmark Detection. To cover richer pathological variations, we perform the landmark detection on the mixed dataset containing all 600 im-ages. We randomly choose 300 images for training and detect the landmarks on the remaining 300. Two metrics are used for the evaluation: the Point to Bound-ary Distance (PtoBD) and the Dice Similarity Coefficients (DSC) of the canal and disc contours. DSC is defined as the amount of the intersection between a fitted shape and the ground truth,DSC = 2·tp/(2·tp+f p+f n), withtp,f p,f n
denoting the true positive, false positive and false negative values respectively. We compare the proposed WAP with three popular models: AAMs [10] as a standard appearance model, ASMs as a widely used shape model, and CLMs [9] as a part-based approach. To validate the improvement of the loglets pyramid decomposition, we also report the performance of an alternative model by replac-ing our pyramids with the original images but usreplac-ing the same HOG features and SDM algorithm. We refer to this control model as WAP−. The mean results of
[image:7.612.152.463.561.597.2]landmark detection are shown in Table.1. We can see that the WAP outperforms the other methods by a favourable margin. The lower variances also indicate its superior performance in terms of consistency. Several qualitative results by WAP are shown in Fig. 4(Top).
Table 1: Performance of landmark detection
Metrics AAM ASM CLM WAP− WAP
PtoBD (in pixels) 3.10±1.29 2.51±1.32 2.34±1.15 1.95±0.92 1.87±0.73
DSC (%) 90.6±4.9 92.1±5.2 92.4±5.2 93.9±3.3 94.7±2.6
Fig. 4: Top: Qualitative results of landmark detection. Bottom: Appearance fitted by WAP. The appearances shown are represented by bΦ in the feature space which are used as inputs for classification.
Fig. 5: Average appearance of classes represented by WAP. (a) Three grades of central stenosis. (b) Normal and abnormal in terms of foreminal stenosis.
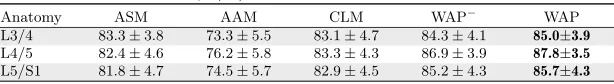
samples to train the classifier, and test on the remaining 100, and repeat for 100 times for an unbiased result. The WAP extracted from the detected land-marks are projected onto the feature space and represented by a compact set of parameters bΦ (Fig. 4 Bottom), which are used as inputs of the classifier. The performance of normal/abnormal classification is measured with accuracy, which is calculated by (tp+tn)/(tp+tn+f p+f n). The grading errors are measured with Mean Absolute Errors (MAE) and Root Mean Squared Errors (RMSE). We compare the performance of our method against approaches us-ing other models as inputs to the same classifier. The agreements of the results with manual inspection are reported in Table. 2. Similarly we perform another normal/abnormal classification on the morphology of the neural foremen. The average appearances are given in Fig. 5(b). The classification accuracy of meth-ods compared is reported in Table. 3. We can see that in both tasks, our WAP appearance models enable a significant improvement.
4
Conclusions
[image:8.612.137.482.283.359.2]de-Table 2: Agreement of classification and grading of central stenosis
Accuracy (%) of classification MAE of grading RMSE of grading
Method
L3/4 L4/5 L5/S1 L3/4 L4/5 L5/S1 L3/4 L4/5 L5/S1
ASM 79.1±4.8 77.4±4.3 81.7±4.5 0.25 0.31 0.20 0.55 0.67 0.48
AAM 70.1±7.1 69.7±7.3 71.3±8.8 0.41 0.44 0.32 0.72 0.79 0.58
CLM 81.0±4.9 82.4±4.5 82.7±4.4 0.23 0.25 0.23 0.53 0.56 0.52
WAP− 80.7±4.9 82.1±4.6 84.7±4.2 0.23 0.25 0.18 0.53 0.58 0.47
[image:9.612.152.466.140.209.2]WAP 84.7±4.6 84.5±4.3 85.9±4.2 0.19 0.21 0.16 0.48 0.54 0.44
Table 3: Accuracy (%) of classification of foreminal stenosis
Anatomy ASM AAM CLM WAP− WAP
L3/4 83.3±3.8 73.3±5.5 83.1±4.7 84.3±4.1 85.0±3.9
L4/5 82.4±4.6 76.2±5.8 83.3±4.3 86.9±3.9 87.8±3.5
L5/S1 81.8±4.7 74.5±5.7 82.9±4.5 85.2±4.3 85.7±4.3
composition, and more precise landmark detection. The model can be readily applied to other anatomical areas for clinical tasks requiring segmentation and classification. The source code will be released for research purposes. For the task of LSS, our future work is aimed towards patient-level diagnosis by utilising the image-level anatomical classification together with etiological information.
References
1. Cootes, T.F., Edwards, G.J., Taylor, C.J.: Active appearance models. IEEE Trans-actions on pattern analysis and machine intelligence23(6) (2001) 681–685 2. Xiong, X., Torre, F.: Supervised descent method and its applications to face
align-ment. In: Proceedings of the IEEE conference on CVPR. (20131) 532–539 3. Lindner, C., Thiagarajah, S., Wilkinson, J., Consortium, T., Wallis, G., Cootes,
T.F.: Fully automatic segmentation of the proximal femur using random forest regression voting. IEEE Transactions on Medical Imaging32(8) (2013) 1462–1472 4. Antonakos, E., Alabort-i Medina, J., Zafeiriou, S.: Active Pictorial Structures. In:
Proceedings of the IEEE Conference on CVPR. (2015) 5435–5444
5. Saragih, J.M., Lucey, S., Cohn, J.F.: Face alignment through subspace constrained mean-shifts. In: IEEE 12th International Conference on Computer Vision, IEEE (2009) 1034–1041
6. Knutsson, H., Andersson, M.: Loglets: Generalized quadrature and phase for local spatio-temporal structure estimation. In: Image Analysis. Springer (2003) 741–748 7. Steurer, J., Roner, S., Gnannt, R., Hodler, J., et al.: Quantitative radiologic criteria for the diagnosis of lumbar spinal stenosis: a systematic literature review. BMC musculoskeletal disorders12(1) (2011) 175
8. Ericksen, S.: Lumbar spinal stenosis: Imaging and non-operative management. In: Seminars in Spine Surgery. Volume 25., Elsevier (2013) 234–245
9. Cristinacce, D., Cootes, T.: Automatic feature localisation with constrained local models. Pattern Recognition41(10) (2008) 3054–3067
[image:9.612.153.460.239.281.2]