warwick.ac.uk/lib-publications
A Thesis Submitted for the Degree of PhD at the University of Warwick
Permanent WRAP URL:
http://wrap.warwick.ac.uk/95551
Copyright and reuse:
This thesis is made available online and is protected by original copyright.
Please scroll down to view the document itself.
Please refer to the repository record for this item for information to help you to cite it.
Our policy information is available from the repository home page.
M A
E
G NS
I T A T MOLEM
U N
IV ER
SITAS WARWICEN
SIS
Measurement of non-linear elastic properties of
metals using non-contact methods
by
Yavor Emilov Arnaudov
Thesis
Submitted to the University of Warwick
for the degree of
Doctor of Philosophy
Department of Physics
Contents
List of Figures v
Acknowledgments xi
Declarations xii
Abstract xiii
Abbreviations xiv
Chapter 1 Background 1
1.1 Research motivation . . . 1
1.2 Thesis outline . . . 2
1.3 Non-destructive evaluation . . . 3
1.4 Ultrasonic inspection . . . 4
1.4.1 Contact transducers . . . 4
1.4.2 Non-contact ultrasonic evaluation . . . 6
1.5 Acoustic nonlinearity background . . . 7
1.5.1 Classical acoustic nonlinearity . . . 9
1.5.2 Non-classical acoustic nonlinearity . . . 11
1.6 Nonlinear ultrasonics using EMATs . . . 12
1.6.1 Electromagnetic acoustic resonance . . . 12
1.6.2 EMAT guided waves . . . 14
Chapter 2 Nonlinear ultrasonics 15 2.1 Classical nonlinear ultrasonics . . . 15
2.1.1 Wave equations . . . 15
2.1.2 Lattice anharmonicity . . . 16
2.2 Harmonic generation . . . 19
2.2.2 Attenuation of finite amplitude waves . . . 20
2.2.3 Sources of nonlinear ultrasonic waves . . . 21
2.2.4 Shear wave harmonic generation . . . 24
2.2.5 Third harmonic generation . . . 25
2.2.6 Guided waves . . . 26
2.2.7 Second and third order elastic coefficients . . . 30
2.2.8 Velocities dependence on TOEC . . . 30
2.3 Non-classical nonlinear ultrasonics . . . 31
2.3.1 Nonlinear resonance ultrasonic spectroscopy . . . 31
2.3.2 Nonlinear wave modulation spectroscopy . . . 32
2.4 Dislocation generation . . . 33
2.4.1 Dislocations in materials . . . 34
2.4.2 Dislocation density measurements . . . 35
2.4.3 Fatigue and creep damage . . . 36
Chapter 3 EMAT introduction 39 3.1 Electromagnetic acoustic forces . . . 39
3.1.1 Lorentz force . . . 40
3.1.2 Magnetisation force . . . 44
3.1.3 Magnetostriction force . . . 44
3.1.4 Effect of the EMAT’s lift-off . . . 46
3.2 Types of EMATs . . . 46
3.2.1 Bulk shear waves . . . 47
3.2.2 Line-focusing shear EMAT . . . 49
3.2.3 Longitudinal bulk EMAT . . . 51
3.2.4 Guided waves . . . 52
3.3 Pulsed electromagnet . . . 55
3.4 EMAT electronics . . . 55
3.4.1 Impedance matching . . . 56
3.4.2 Amplification . . . 56
3.4.3 Generation of the signals . . . 56
Chapter 4 Review of nonlinear techniques 58 4.1 Higher harmonic generation . . . 59
4.1.1 Bulk waves . . . 61
4.1.2 Guided wave techniques . . . 63
4.1.3 Limitations of harmonic generation methods . . . 65
4.3 Nonclassical nonlinear techniques . . . 67
Chapter 5 EMAT and nonlinear ultrasonics 69 5.1 Review of EMAT nonlinear techniques . . . 69
5.1.1 EMAT harmonic generation review . . . 69
5.1.2 EMAT and nonclassical nonlinearity . . . 75
5.2 Analysis of EMAT for NLU . . . 76
5.2.1 EMAT generation . . . 76
5.2.2 Guided waves . . . 78
5.2.3 EMAT reception . . . 79
5.3 Summary: Introduction . . . 79
Chapter 6 Experimental development: Bulk waves 81 6.1 Computer control . . . 81
6.2 Signal processing . . . 81
6.3 Electronic components nonlinearity . . . 82
6.3.1 Receiving electronics . . . 82
6.3.2 Generating electronics . . . 83
6.3.3 Transducer impedance matching . . . 84
6.4 Fatigue tensile machine . . . 85
6.5 Shear wave EMAT experiments . . . 86
6.5.1 FEM simulations . . . 88
6.5.2 EMAT to shear piezoelectric transducer . . . 91
6.5.3 Shear wave resonance . . . 92
6.5.4 Frequency shift . . . 95
6.5.5 Higher harmonic . . . 97
6.6 Summary . . . 99
Chapter 7 Nonlinear ultrasonics using bulk waves 100 7.1 EMAT racetrack coil . . . 100
7.1.1 Ultrasonic displacement profiles . . . 100
7.1.2 AFG harmonic compensation . . . 105
7.1.3 Dynamic Lorentz force . . . 109
7.2 NRUS frequency shift . . . 113
7.3 NRUS third harmonic NLU . . . 117
Chapter 8 Experimental development: Guided waves 123
8.1 Rayleigh waves . . . 123
8.1.1 EMAT self-field generation . . . 124
8.1.2 Piezoelectric wedge generation . . . 126
8.2 Shear horizontal waves . . . 130
8.3 Summary . . . 133
Chapter 9 Nonlinear ultrasonics using guided waves 134 9.1 Rayleigh wave . . . 134
9.2 Shear horizontal waves . . . 141
Chapter 10 Conclusions 155 10.1 Electronics . . . 155
10.2 Bulk waves . . . 156
10.3 Guided waves . . . 157
List of Figures
1.1 Potential to improve the current detection limit . . . 2
1.2 Schematic diagram of a piezoelectric transducer. . . 5
1.3 Schematic diagram of a magnetostrictive transducer . . . 6
1.4 Schematic diagram of an electromagnetic acoustic transducer. . . 7
1.5 Stress strain curve for two different excitation levels . . . 9
1.6 Stress-strain relation: linear elastic model vs. nonlinear elastic model 9 1.7 Predicted FFT spectrum of a nonlinear ultrasonic signal. . . 10
1.8 Expected FFT spectrum of the nonlinear modulation from two ultra-sonic waves with frequenciesfa, fb. . . 11
1.9 Typical frequency spectra of an NRUS measured signals. . . 12
1.10 Axial shear surface wave EMAT . . . 13
1.11 Dual EMAT configuration in wave mixing configuration. . . 14
2.1 Interatomic potential energy for aluminium lattice . . . 17
2.2 Atomic spring force for aluminium single crystal . . . 17
2.3 Wave reflections in a waveguide . . . 26
2.4 Dispersion curves for a Lamb wave in a 4.76 mm thick aluminium plate (AL6061). . . 28
2.5 Dispersion curves for shear horizontal modes in a 4.76 mm thick aluminium plate (AL6061). . . 29
2.6 Stress strain curve for two different excitation levels . . . 32
2.7 Schematic diagram of non-collinear wave-mixing configuration. Two incident waves interact within a small volume within the material and generate a third wave of their combined frequencies and wavenumbers. The amplitude of the generated third wave is proportional to the the nonlinear elastic properties within the interaction volume. . . 33
2.9 Dislocation glide during in-situ measurement of 304 stainless steel
using TEM . . . 36
2.10 SN curve for fully reversed tensile test based on 6061 fatigue data . . 38
3.1 EMAT Lorentz Force due to static external magnetic field and dynamic self-field . . . 41
3.2 Typical magnetostrictive curve. . . 45
3.3 Radially polarized bulk shear wave EMAT design using single magnet and pancake coil. . . 48
3.4 Linear polarized bulk shear wave EMAT design using twin magnet and racetrack coil. . . 48
3.5 Linear polarized bulk shear wave EMAT design using single magnet and double spiral coil. . . 49
3.6 Three bulk shear wave EMAT coil designs. . . 49
3.7 Shear vertical wave EMAT . . . 50
3.8 Longitudinal EMAT design. . . 51
3.9 Hollow cylinder longitudinal EMAT design . . . 52
3.10 Lamb wave EMAT schematics . . . 53
3.11 Force patterns of meander-line EMAT . . . 53
3.12 SH PPM EMAT . . . 54
3.13 Shear horizontal wave generated by PPM EMAT. . . 55
3.14 Block diagram of RITEC gated amplifier module . . . 57
3.15 Harmonic content of the high power amplifier output as a function of driving frequency . . . 57
4.1 Schematic of nonlinear measurements . . . 60
4.2 The nonlinear parameterβ changes during the fatigue lifetime of the sample . . . 60
4.3 Through thickness nonlinear measurement using piezoelectric trans-ducers. . . 62
4.4 Nonlinear Rayleigh wave measurements . . . 64
4.5 NRUS frequency shift during stainless steel lifetime. . . 67
4.6 Nonlinear resonance methods: NRUS and harmonic generation . . . 68
5.1 Axial shear surface wave EMAT for nonlinear measurements . . . 70
5.2 Shear surface contact acoustic nonlinearity using magnetostrictive EMATs . . . 71
5.4 Rayleigh wave nonlinearity measured with Lorentz force EMATs . . 73
5.5 Shear horizontal wave nonlinearity measured with magnetostrictive EMATs . . . 74
5.6 Dual EMAT configuration in wave mixing configuration. . . 75
5.7 PPM EMAT configuration for third harmonic shear horizontal wave. 79
6.1 Spectral leakage of different lengths windowing functions . . . 82
6.2 Harmonic component as function of signal amplitude . . . 83
6.3 Matching network schematics for racetrack EMAT transducer. . . . 84 6.4 Impedance spectrum of different EMAT configurations measured by
impedance analyser. . . 85
6.5 Dogbone specimen design for 4.76 mm thick Aluminium Al6061 . . . 86 6.6 SN curve for fully reversed tensile test based on 6061 fatigue data . . 86
6.7 Birefringence frequency spectra of two orthogonal principal directions
in rolled 380µmthick aluminium plate. . . 87 6.8 Bulk shear wave racetrack EMAT design . . . 88
6.9 Magnetic field of a racetrack bulk shear wave EMAT . . . 89 6.10 Simulation of the Lorentz force distributions for racetrack bulk shear
wave EMAT. . . 90
6.11 Diffraction pattern for shear and longitudinal wave generated by a racetrack EMAT. . . 90
6.12 Harmonic content minimization for EMAT generation using impedance
matching networks . . . 92 6.13 Through thickness resonance modes in aluminium . . . 92
6.14 Frequency spectrum for through thickness resonance modes generated
by wideband pulse excitation . . . 93 6.15 Resonance mode excitation of higher harmonic resonance modes . . 94
6.16 Resonance mode amplitude variation for EMATs with coils of different
inner radius: 1 mm (blue) and 3mm (red). . . 95 6.17 Frequency sweep for third resonance mode in 4.76 mm thick aluminium
sample. . . 96
6.18 The frequency and amplitude variation of the third shear wave reso-nance mode on a 300 mm× 300 mm aluminium plate. . . 96
6.19 Higher harmonic content in the received signal as a function of the
electrical signal amplitude. . . 98
7.2 Experimentally measured longitudinal wave displacement profile of a
racetrack coil EMAT with a permanent magnet. . . 101 7.3 Experimentally measured longitudinal wave displacement profile of a
racetrack coil EMAT without a permanent magnet. The displacement
profile is similar to that of a piston-like transducer. . . 102 7.4 Experimentally measured shear wave displacement profile of a
race-track coil EMAT with a permanent magnet with polarisation
perpen-dicular to the linear segment of the racetrack coil. . . 103 7.5 Experimentally measured shear wave displacement profile of a
race-track coil EMAT without a permanent magnet. . . 103
7.6 Experimentally measured shear wave displacement profile of a race-track EMAT with a permanent magnet with the polarisation of the
EMAT generated shear waves perpendicular to the polarisation of the
piezoelectric shear wave receiver. . . 104 7.7 Experimentally measured shear wave ultrasonic beam profile of a
racetrack coil EMAT . . . 105
7.8 Schematic diagram of the apparatus used to measure the harmonic distortion of the RITEC generation amplifier. . . 106
7.9 Compensation map for the RITEC amplifier output . . . 107 7.10 Second harmonic distortion compensation as function of compensation
amplitude . . . 107
7.11 Third harmonic distortion compensation as a function of compensation amplitude . . . 108
7.12 Harmonic distortion dependence on RITEC Control level. The
har-monic content in the measured ultrasonic waves is reduced for the harmonic compensation method (triangles) for both the second
(or-ange) and third (green) harmonics, compared to the RITEC standard
toneburst generation (stars). . . 109 7.13 Schematic diagram of the ultrasonic transducers for EMAT lift-off
measurements. The piezoelectric transducer is fixed to the sample
surface, while the EMAT is attached to the moving arm of a motorised XY gantry system. . . 110
7.14 Schematic diagram of the electrical components used to measure the
dynamic impedance. . . 110 7.15 Lift-off distance variation of the EMAT transduction. . . 111
7.17 Static field and self-field Lorentz force as function of the excitation
current . . . 112 7.18 Typical NRUS signal, (a), and the corresponding frequency
spec-tra, (b), used for measuring the frequency shift of the fundamental
harmonic component for two different excitation levels. . . 113 7.19 NRUS frequency shift as function of temperature variation due to
EMAT Joule heating . . . 114
7.20 Temperature compensated frequency shift along the gauge length of an unfatigued sample. . . 115
7.21 NRUS frequency shift measured along the gauge length of a dogbone
sample. . . 116 7.22 Frequency shift as a function of temperature and fatigue level. . . . 117
7.23 Typical NRUS signal for the fifth order shear resonance mode in
aluminium. . . 118 7.24 Variation of the second and third harmonic amplitudes as a function
of excitation current. . . 119
7.25 Harmonic content of the NRUS signal and nonlinear ultrasonic pa-rameters as a function of propagation distance. . . 120
7.26 Third harmonic shear nonlinear parameter as a function of fatigue life.121
8.1 Dispersion curves for Lamb-Rayleigh wave in a 4.76 mm thick
alu-minium plate (Al6061). . . 124
8.2 Rayleigh wave measurements of wave generated by EMAT with and without permanent magnet . . . 125
8.3 Angled wedge for Rayleigh wave generation in aluminium . . . 126
8.4 EMAT transducer design for Rayleigh wave generation and detection 127 8.5 Amplitudes of Rayleigh wave generated by EMAT and piezoelectric
transducers . . . 128
8.6 Variation of signal amplitude generated by piezoelectric wedge trans-ducer. . . 128
8.7 Spatial impulse response of different receiver geometries for the
fun-damental and second harmonics. . . 129 8.8 SH PPM EMAT structure. . . 131
8.9 Designs of the transmitting and receiving SH PPM EMATs. . . 132
8.10 Shear horizontal wave dispersion curves for 3 mm aluminium . . . . 132
9.1 Pulse-inversion method signal sketch . . . 134
9.3 Typical nonlinear Rayleigh wave signal measured using single EMAT
coil. . . 136 9.4 Pulse inversion measurements of nonlinear Rayleigh waves. . . 137
9.5 Nonlinear Rayleigh wave parameter as a function of excitation level. 138
9.6 Fundamental wave and second harmonic beam divergence for angled wedge transmitter and meanderline EMAT receiver. . . 139
9.7 Nonlinear Rayleigh wave measurements of the fundamental and second
harmonic amplitudes as a function of propagation distance. . . 140 9.8 Wavenumber spectra for different MWWR values. . . 143
9.9 Magnetic field amplitude and third harmonic content as a function of
MWWR . . . 144 9.10 Magnetic field amplitude and third harmonic content as a function of
magnet lift-off . . . 145
9.11 Magnetic field amplitude and third harmonic content as a function of magnet height . . . 146
9.12 Magnetic field amplitude and third harmonic content as a function of
magnet width . . . 146 9.13 Magnetic field amplitude and FWHM of the fundamental wavenumber
as a function of number of magnet columns . . . 147 9.16 Bandwidth of the RITEC current pulse . . . 148
9.14 Simulated regions of ultrasonic wave generation for wavenumber
spec-tra of the improved SH PPM design. . . 149 9.15 Simulated regions of ultrasonic wave generation excited by the
im-proved PPM EMAT . . . 149
9.17 Designs of the transmitting and receiving SH PPM EMATs. . . 150 9.18 Nonlinear SH wave signal measured by an optimised pair of PPM
EMATs. . . 151
9.19 Variation of the shear horizontal nonlinear ultrasonic wave harmonic amplitudes as a function of the excitation current amplitude. . . 152
9.21 Spatial impulse response of different receiver geometries for the
fun-damental and third harmonics. . . 152 9.20 Variation of the shear horizontal nonlinear ultrasonic wave harmonic
Acknowledgments
Firstly, I would like to thank my supervisor, Professor Steve Dixon, for giving me
the opportunity to work on such a great project, and for giving me the support and
guidance I needed so that I could finish the PhD. I would also like to thank the rest
of my colleagues in the Warwick Ultrasound group. Thanks go to Charley Fan for
all his EMAT wisdom, discussions of impossible EMAT designs and his invaluable
help with electronics theory. I would like to thank Lei Kang and Zhichao Li for the
long and productive discussions. Thanks also go to Matthew Clough and William
Blackmore for the regular office breaks and the immersion experience of the weird
and strange bits of the British culture. I am thankful for the fun sessions in the
teaching laboratory of Doctor Rachel Edwards, which kept my mind from worrying
too much and provided much-needed laughter. Thanks to everyone else I have failed
to name - there are just too many people to mention.
I also want to express my deepest gratitude to both my parents for all their
support and encouragement - I would not be where I am without you, Mum and
Dad. Thanks also to my sister, Diliyana, and the rest of the family for helping me
keep my sanity. Thanks also go to all my close friend from the Bulgarian Society,
which provided the much needed emotional support throughout my seven years at
Warwick University.
Lastly, I would like to acknowledge the funding provided by the Research
Declarations
I declare that the work presented in this thesis is my own except where stated
otherwise, and was carried out entirely at the University of Warwick during the
period between October 2012 and October 2016, under the supervision of Prof. Steve
Dixon. The research reported here has not been submitted, either wholly or in part,
in this or any other academic institution, for admission to a higher degree. Parts of
this work, and other work not reported in this thesis, have appeared in other forms,
Abstract
Nonlinear ultrasonic techniques have the potential to allow for earlier detec-tion of material degradadetec-tion. Recent advances in the area show promising results, but the methods used are often impractical outside laboratory conditions. Non-contact methods have the potential to address some of the current measurement limitations. Electromagnetic acoustic transducers (EMAT) are one potential candidate for non-contact, nonlinear measurements in metals. The EMAT ultrasonic wave generation process is complex and requires an in-depth understanding of the electro-mechanical coupling phenomena. The potential of EMAT transducers as generators and detectors has been evaluated for multiple nonlinear measurement techniques.
The ultrasonic wave, generated by the interaction of the dynamically generated magnetic field and the eddy currents within the sample surface, called the self-field Lorentz force, have a significant impact on generated nonlinearity and must always be considered. For longitudinal wave measurements, the ultrasonic wave generated by the self-field Lorentz force has a similar amplitude and behaviour to the second harmonic wave generated by the material nonlinearity, thus making the measurements impractical. For shear waves, the third harmonic nonlinear ultrasonic generation shows inconclusive results with regards to microstructural change. Additionally, shear wave, nonclassical nonlinear ultrasonics show no significant change during the fatigue lifetime for aluminium alloy. Ultrasonic measurements of the temperature dependence of the sound velocity and of the coefficient of temperature expansion show a promising new field of study where EMAT application is well suited.
Meanderline EMATs have a great potential as receivers, but not as ultrasonic trans-mitters for nonlinear Rayleigh waves. The ultrasonic Rayleigh waves generated by the self-field Lorentz force, have similar amplitude and behaviour to the nonlinear ultrasonic Rayleigh waves. Optimised PPM (periodic permanent magnet) EMATs are used for entirely non-contact, nonlinear measurement of third harmonic shear horizontal waves and show great potential.
Abbreviations
AFG Arbitrary function generator
CAN Contact acoustic nonlinearity
EMAR Electromagnetic acoustic resonance
EMAT Electromagnetic acoustic transducer
FEM Finite element modelling
FFT Fast Fourier transform
FWHM Full width half maximum
LF Line focusing
MFR Magnet filling ratio
NDT Non-destructive testing
NLU Nonlinear ultrasonics
NRUS Nonlinear resonance ultrasonic spectroscopy
NWMS Nonlinear wave modulation spectroscopy
PCB Printer circuit board
PPM Periodic permanent magnet
PSB Persistent slip band
RWWSI Ratio of wire width to spacing interval
SH Shear horizontal
SHG Second harmonic generation
STFT Short time Fourier transform
SWSH Shear wave second harmonic
Chapter 1
Background
1.1
Research motivation
The aim of this thesis is to investigate the potential of electromagnetic acoustic trans-ducers (EMATs) to measure nonlinear elastic parameters of metals. Two separate
applications have been considered to assess EMATs capability to measure nonlinear
ultrasound parameters. The first project uses Nonlinear Ultrasound Resonance Spectroscopy (NRUS) [2; 197] combined with Electromagnetic Acoustic Resonance
(EMAR) [153] to measure changes of nonlinear parameters in fatigued aluminium
samples. The second project focuses on determining the practical limitations of measuring surface wave nonlinearity using EMAT transducers. Development of a
system for practical measurement of the nonlinear parameter is needed to allow
industrial application of the nonlinear acoustic methods.
The primary objective of NDT is to detect damage at the earliest stage and to
reduce further failure risk. Introducing practical means of using nonlinear ultrasonics can provide an early indication of accumulating damage, allowing condition-based
maintenance as opposed to a schedule-based methodology. The current detection
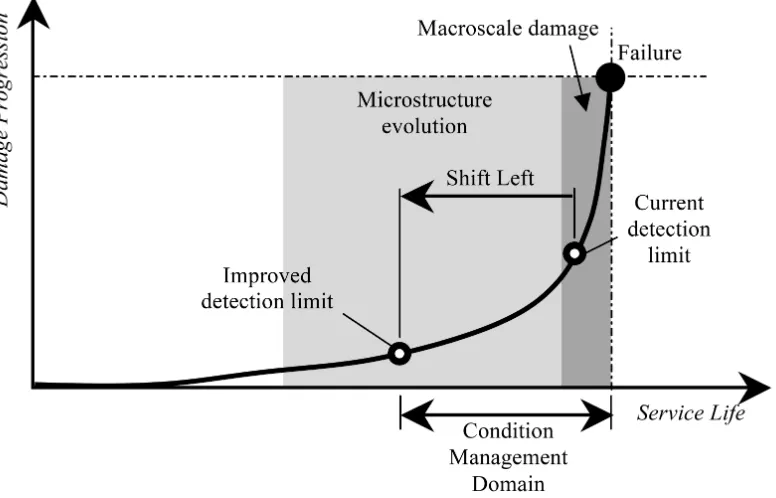
limit of conventional NDT methods only covers the latest part of the macroscale damage that leads to failure, see fig 1.1. The focus is based on crack detection and
crack growth monitoring and remaining life prognosis. By improving the detection
limit, measurements of microstructural evolution can allow degradation predictions at an earlier stage of the fatigue life [112]. This significantly reduces the failure
Figure 1.1: Nonlinear ultrasonics has the potential to improve the current detection
limit. NLU allows measurements of microstructural evolution and precrack conditions. Adapted from Lissenden [112].
1.2
Thesis outline
Chapter 1 introduces the basic concepts of contact and non-contact ultrasonic mea-surements. Additionally, brief descriptions of different nonlinear techniques and
EMAT nonlinear studies in the literature are presented. In Chapter 2, the theoretical framework of nonlinear ultrasonic (NLU) theory is summarised, including both
classical and nonclassical nonlinear ultrasonics. Analysis of the NLU contributions
from microstructural defects, as well as their generation, evolution and alternative dislocation density measurement techniques are also shown. Chapter 3 summarises
the available research literature on EMAT transducers. Descriptions of the
electrome-chanical coupling phenomena, multiple EMAT designs and the supporting EMAT electronics are presented. A review of the nonlinear ultrasonic techniques available
in the literature is presented in Chapter 4. Chapter 5 explores NLU techniques,
which employ EMAT transducers, and their results. Analysis of the available EMAT techniques for NLU is also included.
The experimental details for the nonlinear bulk wave measurements, employing
contribu-tions from the supporting electronics is included. Also, simulacontribu-tions of the ultrasonic
generation forces and the resultant diffraction pattern are presented. Finally, the shear wave resonance technique for frequency shift and higher harmonic measurement
is described. The results from the nonlinear bulk wave measurements are presented
in Chapter 7. Experimental measurements of the ultrasonic displacement profile are used to confirm the simulated results for shear wave EMAT transduction.
Addi-tionally, a new method for system nonlinearity compensation, using artificial higher
harmonic signals, is examined. Investigation of the effect of liftoff to the self-field Lorentz force is also shown. Results for the measured classical and nonclassical
nonlinear ultrasonic parameter, employing bulk wave techniques, are analysed. A
new ultrasonic method is proposed for measuring the temperature dependence of the velocity and coefficient of thermal expansion, as a function of the fatigue life of
the specimen.
Descriptions of the experimental details for guided wave nonlinear measurements, employing EMAT transducers, are presented in Chapter 8. The EMAT Rayleigh
wave generation for nonlinear ultrasonics is analysed. Also, the experimental
config-uration of an angled wedge piezoelectric transducer used for ultrasonic generation is described. Measurements of the nonlinear Rayleigh wave parameter are presented
for the angled wedge - EMAT transducer pair. The experimental details for shear horizontal nonlinear ultrasonic wave measurements are also detailed. In Chapter 9,
the results of the nonlinear Rayleigh wave measurements are presented and analysed.
Furthermore, simulations of an optimised shear horizontal periodic permanent mag-net (PPM) EMAT are shown. Experimental measurements of the third harmonic
nonlinear shear horizontal wave using the improved PPM EMAT design are presented.
Chapter 10 contains a summary of the experimental results and conclusions.
1.3
Non-destructive evaluation
Non-destructive testing or non-destructive evaluation is a discipline combining
multiple methods of inspecting components without damaging them [19; 75; 213]. These methods can be classified into categories by the physical principles involved
in the inspection: Visual Inspection, Thermography, Ultrasound, Radiography,
Electromagnetic [17; 160; 200] or by the parameter/feature inspected such as residual stress, flaw detection, material characterization. Each method will possess its
advantages and limitations, making it necessary to select the best technique for the particular application. This thesis will discuss multiple parameters, extracted from
fatigue lifetime.
1.4
Ultrasonic inspection
Ultrasonic methods use high frequency mechanical vibrations propagating through
the material in order to probe the material. The methods require energy transfer
of a driving electrical signal by an acoustic transducer, which generates the sound waves. Signals are received by the same transducer or a second transducer and are
analysed to determine material parameters. Measurements of linear parameters such as time of flight or attenuation can be used to determine the size, position, and
shape of a flaw in the material. Similar techniques can be used to measure material
thickness or changes in the material properties such as composition or geometry. The use of different ultrasonic wave modes is required to inspect the bulk or surface of
the component, each requiring individually selected transducers. These can employ
two different acoustic transfer characteristics: contact or non-contact. Contact ultrasonic methods typically use couplant medium or water to achieve the acoustic
transfer between the transducer and material. Non-contact ultrasound methods use
transducers that transfer energy to the material without directly contacting the surface of the component.
1.4.1 Contact transducers
Piezoelectric transducers
Piezoelectric transducers are the most common type of ultrasonic transducer in
industry. The high electromechanical efficiency is their main advantage, allowing for simple implementation of ultrasonic inspections. Piezoelectric transducers require
good surface contact with the sample by the use of couplant, which can reduce
its practical applications: hostile environments (elevated temperatures, chemical composition) or when rapid surface scanning is required. The application of couplant
can be a major source of inconsistency when precise amplitude measurements are
needed. A wedge can be employed in transducers to allow for a variety of wave modes to be generated, although couplant is still required for transmission and detection of
ultrasonic waves. Performing contact measurements can be time consuming and can
Cable
Electrodes Wear Plate Matching layer Active Element Backing
Network Electrical
Figure 1.2: Schematic diagram of a piezoelectric transducer. It consists of multiple layers: Wear plate - it protects the active element from mechanical shocks. Matching
layer - provides acoustic impedance matching. Active elements electrically coated on
both faces transforms the electrical signal to mechanical vibrations. Backing layer -suppresses ringing and absorbs backward going waves. Electrical network - provides
electrical impedance matching.
The construction of a piezoelectric transducer consists of a wear plate, match-ing layer, active piezoelectric element, backmatch-ing, electrodes and casmatch-ing, see fig 1.2. A
scratch resistant wear plate protects the inner layers from damage. A matching layer
can be installed beneath it, to improve the power transfer between the mismatched media and piezoelement [105]. The thickness of the layer is selected to be a quarter
of the wavelengthλ/4 and to have an acoustic impedance equal to the geometric
mean between the impedance of the active element and the material under test. The piezoelectric element has a thickness λ/2, which is the fundamental through
thickness resonant mode of the element and specifies the sensors centre frequency.
The backing material influences greatly the damping characteristics and hence the transducer bandwidth.
Magnetostrictive transducers
The magnetostrictive transducer consists of a thin foil of highly magnetostrictive
material in contact with the sample, a magnet and a meanderline electric coil, as shown in figure 1.3. The meander spacing specifies the wavelength and in combination
with the frequency of the driving current, different wave modes can be excited. By
using different configurations of magnets and polarizations particular elastic waves can be generated. Magnetostrictive transducers have been used to generate shear
horizontal (SH) waves. For improved generation efficiency, the static magnetic field
should be parallel to the induced eddy currents in the sample. To achieve good acoustic transduction and improve the signal-to-noise ratio, surface preparation is
Permanent Magnets Magnetostrictive
foil Shielding
[image:22.595.123.522.110.208.2]Couplant Sample
Figure 1.3: Schematic diagram of a magnetostrictive transducer
1.4.2 Non-contact ultrasonic evaluation
Non-contact ultrasound generation can be achieved by using air-coupled, laser and
electromagnetically coupled methods.
Air coupled transducers
Air-coupled transducers transmit sound waves across multiple air-material interfaces. The proportion of energy transferred depends on the acoustic impedance
match-ing between the materials. Typically, much less than 1% of the sound energy is
transmitted at each interface due to the very low acoustic impedance of air. The total path loss of four transitions may induce loss of 100dB or higher. To maximize
the performance of air-coupled transducers piezoelectric elements, with a suitable
acoustic matching layer attached, are excited with toneburst signals. However, due to the high acoustic impedance of metals in comparison to air, the performance of
air-coupled transducers is generally very inefficient. However, air-coupled receivers
can be used to reduce the variations due to inconstant coupling conditions in contact methods [182].
Laser ultrasonics
Laser ultrasonics can be separated into generation and detection. The physical
principles behind the ultrasound generation from lasers are thermoelastic and ablative [176]. In the thermoelastic regime, short pulses (∼1 ms - 100 ns) from a high power
laser beam induce sudden thermal expansion in small surface area, while in the
ablative regime laser energy generates a plasma at the surface of the material that can arise from vaporisation of the surface of the sample or by breakdown of the air
above the sample. The amplitude of the generated ultrasonic waves can be orders
experimental conditions. Laser generation results in multiple ultrasonic modes,
making analysis and determination of waveforms complicated. Laser detection techniques allow for high sensitivity, broadband non-contact acoustic measurements.
The most common laser-based ultrasound detectors use interferometric or amplitude
variation principles [125].
Electromagnetic acoustic transducers
The electromagnetic acoustic transducer (EMAT) is a non-contact transducer
typi-cally composed of an electritypi-cally conducting coil and a source of strong magnetic
field, both placed in close proximity to the sample, as shown in figure 1.4. Pulsed alternating electrical current is passed through the coil, which induces a dynamic
electromagnetic field in the surface region of the conductive material. Three different mechanisms can be involved in the EMAT acoustic energy transfer: The Lorentz
mechanism, magnetostriction or the magnetisation force, which allow for the
non-contact ultrasonic generation. Chapter 3 contains more detailed information about the physical principles involved in the electromagnetic acoustic coupling.
S
N
S
N
Je
BsJe
[image:23.595.256.385.387.499.2]Lorentz force
Figure 1.4: Schematic diagram of an electromagnetic acoustic transducer. Two strongN dF eB magnets with opposing field direction provide the static magnetic
fieldBS. Racetrack coil placed near the sample surface induces eddy currentsJe.
Lorentz force excites the acoustic vibration in the surface layer of a conductive material.
1.5
Acoustic nonlinearity background
Linear ultrasonic methods are widely used for thickness measurements, and also
provide excellent sensitivity to macroscale features such as: fatigue cracks, surface corrosion, etc. However these features occur shortly before the end of the components
life cycle. Therefore, linear ultrasonics have limited application for conditional
precursors in principle, which can characterise material degradation and detect
changes in material structural integrity earlier in the material lifetime. Nonlinear ultrasonic methods are sensitive to microstructural features that are orders of
magnitudes smaller in size than the ultrasonic wavelength. However, these methods
cannot distinguish individual features, such as single monopole dislocations or dislocation slip bands, but measure the cumulative effect of the microstructural
features within the interaction volume of the ultrasonic wave path.
Nonlinear acoustics effects are reported as early as the 19th century [57]. Applications of nonlinear acoustics using underwater methods have been investigated
in detail from the 1960s to the 1970s [12; 209; 210]. The earliest attempt to summarise
different nonlinear acoustic applications, is produced by Zheng [224]. These aspects cover fields from acousto-optics, Earth studies, biophysics, non-destructive testing or
acoustic microscopy. In all these applications, nonlinear effects have proven much
more sensitive than using linear parameters [13; 57; 106]. The most promising use of nonlinear acoustic methods is the material characterisation of early stage damage. As
the ultrasonic parameters are directly probing properties of the material, nonlinear
acoustic methods are capable of inspecting microcracks and degradation over the sound wave propagation volume.
The principle difference between linear and nonlinear ultrasound is that the latter characterises defects by measuring acoustic signals whose frequency differs
from that of the generating signal. Classical nonlinear ultrasonics is focused on
mea-surements of the higher harmonics or sub-harmonic components of the fundamental frequency, or the mixed frequency response from multiple acoustic generation sources.
The nonclassical nonlinear ultrasonic methods exploit the hysteretic properties of the
materials to measure frequency shifts caused by a change in the stress state of the material. The nonclassical elasticity theory defines the elastic constants as functions
of the maximum applied stress from the previous load cycle. The different hysteretic
curves of the elastic constants cause the observed nonlinear behaviour, see figure 1.5. The nonclassical nonlinear methods have been widely used in geophysics to study the
hysteretic behaviour of rocks and their mesoscopic elasticity [121]. These methods
ε
σ
[image:25.595.230.410.104.225.2]K1 K2
Figure 1.5: Stress strain curve for two different excitation levels adapted from [122]. The generated sine wave for the lower excitation level describes a hysteresis curve
with an average elastic modulus of K2, while the higher excitation level describes a
larger hysteresis loop with an average elastic modulus ofK1.
1.5.1 Classical acoustic nonlinearity
Early second harmonic generation investigations were reported by Hikata [63] and
Thompson[18; 183]. The response of single crystal aluminium to finite amplitude
sinusoidal acoustic waves has been recorded over the fatigue lifetime [52], showing a correlation between the damage state and nonlinear parameter.
-2 -1.5 -1 -0.5 0 0.5 1 1.5 2
Strain
×10-3 -400
-200 0 200 400
S
tr
es
s
(M
P
a)
Linear elastic parameter Nonlinear elastic parameter
Figure 1.6: Stress-strain relation: linear elastic model vs. nonlinear elastic model
By using Taylor series expansion, the linear stress-strain relation is expanded to higher order elastic constants, as shown in figure 1.6. By substitution for the
stress expression and a pure sinusoidal function in the wave equation, an approximate
solution for the nonlinear second order partial differential equation (PDE) can be obtained. Using an iteration method to solve the PDE expression for the nonlinearity,
an expression for the second harmonic amplitude is acquired [63]. Contributions
[image:25.595.149.496.421.554.2]allows for the assessment of the state of degradation of the material by measuring the
amplitudes of the higher harmonic components, see figure 1.7. Multiple parameters are shown to have an effect on the nonlinear parameter such as dislocation density,
dislocation loop length and applied stress.
f
1 f2 f3
Frequency
10-6 10-3 1
A
m
p
li
tu
d
e
Figure 1.7: Predicted FFT spectrum of a nonlinear ultrasonic signal. Ultrasonic wave with frequencyf1 is expected to generate higher harmonic components atf2, f3
due to material nonlinearity. Amplitudes of the higher harmonics are expected to be
orders of magnitude smaller∼ −60dB.
Contributions from more complex dislocation structures have been
summa-rized in Cantrell [21]. Interactions of ultrasonic waves with edge dislocations and
dislocation dipoles have been quantified. In-situ measurements of the second har-monic amplitude over the duration of a full specimen lifetime have been taken by
Frouin [50] to confirm a monotonic increment in nonlinear parameter, and to provide
useful data about dislocation generation stages. Liu [178] had investigated the effects of different experimental parameters on the measured nonlinearity parameter.
The nonlinear ultrasonic techniques reviewed by Jhang [78] ,based on a
previ-ously published review of material characterization by Zheng [224], cover multiple areas of nonlinear methods. Nonlinear acoustic phenomena are categorized into four
different groups: higher harmonics, sub-harmonics, shift of resonance frequency and
mixed frequency acoustic response. The article strongly supports the finding that observed significant changes in the nonlinear parameter occur over the fatigue lifetime.
The SHG is reviewed for different wave modes in [119], suggesting a complicated
1.5.2 Non-classical acoustic nonlinearity
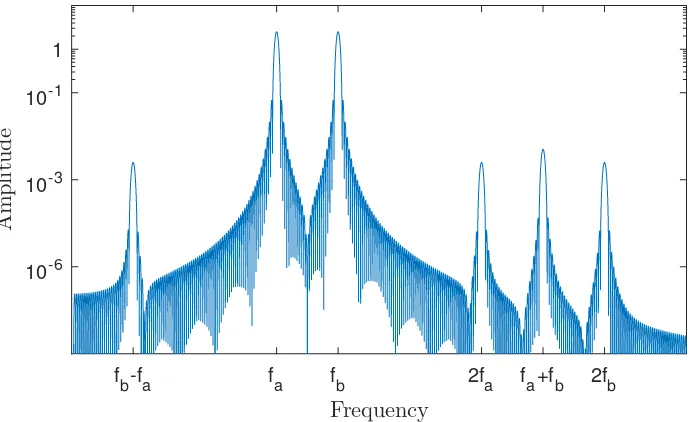
Further techniques were analysed by Abeele [2; 197] to evaluate fatigue damage.
Non-linear wave modulation spectroscopy (NWMS) simultaneously applies two sinusoidal
ultrasonic waves of different frequenciesfa andfb. Changes in the amplitudes of the side bands of those two frequencies are observed - 2fa,2fb, fa+fb, fb−fa, see figure
1.8. The article concludes that by interacting with cracks and deformations of the
materials, mono-frequency ultrasonic waves experience nonlinear perturbations to the stress-strain relation, and that higher harmonics are generated with contributions
from those perturbations.
f
b-fa fa fb 2fa fa+fb 2fb
Frequency
10-6
10-3
10-1
1
A
m
p
li
tu
d
[image:27.595.149.495.270.481.2]e
Figure 1.8: Expected FFT spectrum of the nonlinear modulation from two ultrasonic
waves with frequencies fa, fb. Resulting spectrum includes higher harmonics at
2fa,2fb and nonlinear wave interactions at side-bandsfb−fa, fb+fa. The side-band amplitudes provide information about the material nonlinear parameters.
Nonlinear resonance ultrasonic spectroscopy (NRUS) is an experimental
tech-nique that uses sample geometry to generate signals within the sample’s mechanical
resonance frequencies [149; 150; 157; 197]. From the output frequency, an amplitude signature is extracted. By varying the excitation amplitude of the fundamental
mode, as shown on 1.9 , the resonant frequency experiences a shift ∆f, while the
higher harmonics increase in amplitude. As materials degrade, the frequency shift |∆f|/f0 increases in magnitude. NRUS methods have been evaluated to have higher
sensitivity to the accumulated macroscopic damage compared to linear acoustic
f
0-∆f f0
Frequency
0 50 100
A
m
p
li
tu
d
e
Figure 1.9: Typical frequency spectra of an NRUS measured signals. The frequency of the ultrasonic signal shifts with the amplitude of the excitation signal. The change
of the frequency shift (∆f) is proportional to the damage state of the measured
material.
1.6
Nonlinear ultrasonics using EMATs
Electromagnetic acoustic transducers (EMAT) have lower generation efficiency compared to contact methods. The small amplitude of the fundamental frequency
signal may prevent the generation of an observable second harmonic component.
However, EMATs have wideband operation range, which allows generation and detection of multiple harmonic components using a single transducer. To overcome
limitations of EMATs generation and receiving processes, an investigation is required
with regard to nonlinear methods.
1.6.1 Electromagnetic acoustic resonance
Electromagnetic acoustic resonance method (EMAR) uses the samples geometrical
resonance to increase the amplitude of the driving signal. The method has been
adopted by Ohtani [153] to measure the changes in attenuation during fatigue steel. Additionally, changes in the ultrasound wave velocity are measured, in terms of
resonance frequency shifts. The non-contact nature of the transducers allows for
high sensitivity continuous measurements during the fatigue process.
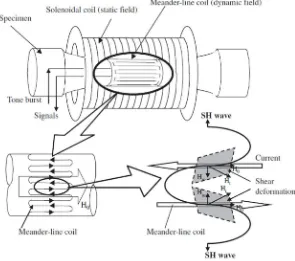
Measurements combining EMAR technique and NRUS method have been
reported by Ohtani [152] on Cr-Mo-V steel. Surface waves are pulsed synchronously at f1
2 - half the fundamental geometric resonance frequency of a cylindrical sample,
as shown in figure 1.10. As a result, the high amplitude driving signal does not
accumulated over time. Shear surface wave magnetostrictive non-contact transducers
have been used. This reduces the system nonlinearity as it avoids using couplants. Correlation between the change of the attenuation and the nonlinearity coefficients
[image:29.595.174.469.191.452.2]is drawn.
Figure 1.10: Axial-shear-wave EMAT: Solenoid coil is providing the static magnetic
field. Meanderline coil surrounding the cylindrical surface generates a dynamic magnetic field. The magnetostrictive force generates axial surface SH waves. This
figure is reproduced from [152].
NRUS measurements were taken of pure copper [149] and austenitic steel [151] using EMAT transducers. Changes in the nonlinearity frequency coefficient
are shown to have a correlation with the fatigue progress. Non-contact three wave
mixing measurements have been reported by Ohtani [148]. In Ohtani’s study, shown in figure 1.11, two EMAT transmitters were used to generate synchronised toneburst
wave packages which interact within the sample. Changes in the three-wave nonlinear
Figure 1.11: Dual EMAT configuration: Two shear wave transducers positioned on
opposite sides of the sample, generate acoustic signals of different frequenciesfn and
fm. Nonlinear interaction within the specimen volume generates multiple sideband signals. This figure is reproduced from [148].
1.6.2 EMAT guided waves
Measurements on nonlinear guided waves generated by EMATs have been reported by Murayama [135; 136] and Cobb [35]. Murayama evaluated EMATs for nonlinear
measurements of the S0-Lamb and SH0 shear horizontal waves during the fatigue
lifecycle of low carbon steel. EMATs have been used for both transmission and reception of the ultrasonic waves. However, conclusive results were not drawn
from the data obtained. Cobb’s [35] interrupted fatigue tests were conducted on
stainless steel samples and measurements of the nonlinear Rayleigh wave parameter are taken at regular stages of the fatigue lifetime. Cobb’s study used EMATs for
both transmission and reception, but the measured results were inconclusive. The
potential of EMATs to measure the nonlinear ultrasonic parameter may allow for single sided ultrasonic measurements of the material surface damage state. The
Chapter 2
Nonlinear ultrasonics
2.1
Classical nonlinear ultrasonics
2.1.1 Wave equations
Infinitesimal amplitude waves
A mathematical description of a one-dimensional wave propagating in ideal media is given by the wave equation [169]:
∂2U ∂t2 =c
2 0
∂2U
∂x2 (2.1)
where thex, t, U(x, t), c0 are the position coordinate, time variable, the wave
displace-ment in the one-dimensional system and the velocity of the wave in non-disturbed
media. For linear ultrasonics, the forces between the particles are described by Hook’s law:
F =−k∆x (2.2)
whereF is the returning force, k is the spring constant and ∆x is the displacement
from the equilibrium position. This description assumes linear interactions between
particles and ignores any dependence on the amplitude of the oscillation. Such approximations can be made for waves of infinitesimal amplitudes.
Nonlinear ultrasound waves
Nonlinear ultrasound has the unique capability of detecting damage precursors prior
to any macroscopic crack formation. As such, it has the potential to become a method for condition health monitoring for metallic structures. Using a variety of
and efficient operation of ageing infrastructure. Several measurement methods have
been developed based on the nonlinear effect. The next sections will summarise the different sources of nonlinearity and nonlinear ultrasound interactions.
2.1.2 Lattice anharmonicity
Finite amplitude ultrasonic waves would experience an additional nonquadratic
interatomic potential. When the amplitude of oscillation of the ultrasonic wave becomes of significance, at amplitudes∼200 nm [141], the elastic response of the
lattice deviates significantly from the linear Hooke’s law.
The potential energy wells generated from the lattice are described to a good
approximation by the Lennard-Jones potential equation [87]:
V(r) = 4W
"
q r
12 −
q r
6#
(2.3)
whereV(r) is the interatomic potential between two neighbouring atoms,W is the
depth of the potential well,q is the distance of minimum interatomic potential and
r is the distance separation between two adjacent particles. Due to the simplicity and computational efficiency of the equation, it is heavily used in simulations and
basic calculations regarding lattice parameters and effects. A better model to
describe the lattice atomic forces is using the Morse potential [1]. The forces on each individual atom can be approximated to a good agreement by differentiating
the atomic potential, see figure 2.1. Ultrasonic waves, with amplitudes higher than
200 nm, can generate displacements between neighbouring atoms in the lattice of approximately 0.001˚A. Similar displacement levels are required to enter the nonlinear
2.5 3 3.5 4 4.5 5
Distance (˚A)
-0.04 -0.03 -0.02 -0.01 0 P o te n ti a l E n er g y (e V )
a)
2.98 3.02 3.06
Distance (˚A)
-31.8 -31.6 -31.4 -31.2 P E (m eV )
b)
-0.2 0 0.2
∆ Distance (fm)
0 0.5 1 ∆ P E ( µ eV )
c)
Figure 2.1: Interatomic potential energy for aluminium lattice (a,b) [5]. The potential
well is positioned around 3.01˚A(c). The linear elastic regime (red) is limited around
the equilibrium position.
-0.2 0 0.2
Distance (fm) -10 -5 0 5 10 F or ce (f N )
a)
-0.2 0 0.2
[image:33.595.143.498.108.375.2]Distance (fm) -0.04 -0.02 0 0.02 F or ce (f N )
b)
Figure 2.2: Atomic spring force for aluminium single crystal (a) [5]. Linear fit to the
ultrasonic elastic regime and plot of the residual errors to the linear fit (b).
The returning force from the lattice potential wells shown in figure 2.2 is only linear across a small range of displacements. The linear fit shows deviation of the
returning force from the expected infinitesimal amplitude wave assumption. For a
consider a nonlinear spring connecting each pair of atoms. Cantrell has summarised
the set of fundamental principles of nonlinear ultrasonics to describe acoustoelasticity and harmonic generation [21]. The model defines the lattice motion in discrete
displacements for each atom. Each atom is described as a point with massm which
is separated from adjacent points by a distance d. Each point p is described by
yp - displacement from its equilibrium position. The system assumes a Lagrangian
(material) reference system. When taking into account the inter-particle interactions,
the potential energyVP E of the system can be expressed as an infinite series:
VP E = (VP E)0+
X
p
k1(yp+1−yp) + X
p 1
2!k2(yp+1−yp)
2+X
p 1
3!k3(yp+1−yp)
3+. . .
(2.4)
Where (VP E)0is a constant,k1, k2, k3are first, second and third order spring constants
which simulate the forces between two adjacent particles. The force applied to the
nth particle can be expressed as:
Fn=−
dVP E
dyn
=−k1
X
p
dyp+1 dyn
− dyp
dyn
−1 2k2
X
p
dyp+1 dyn
−dyp
dyn 2
−. . . (2.5)
Consideration should be taken only for the casesdyp/dyn=δpn, therefore after the
summation the expression can be reduced to:
Fn=m
d2U dt2 =k2
(yn+1−yn)−(yn−yn−1)
+1
2k3 h
(yn+1−yn)2−(yn−yn−1)2
i
(2.6) Where the linear term involving k1 is cancelled. Taking the continuum limit of the
above equation with respect to thex-dimension over a finite small area cross-section
δS, a construction for the left side of equation (2.1) can be obtained:
ρ∂ 2U
∂t2 =
1
δS ∂Fn
∂x =
∂σ ∂x =A11
∂2U
∂x2 +A111 ∂U
∂x ∂2U
∂x2 +. . . (2.7)
whereσ,A11and A111 are respectively the stress along the propagation direction,
second and third order Huang coefficients [68]. Using only the first two terms, the
expansion can be rewritten as:
∂2U ∂t2 =c
2 1
1−β˜l
∂U ∂x
∂2U ∂x2
!
(2.8)
Voigt notation. When ˜βl tends to zero the solution reduces to the linear wave
equation (2.1). The relationship between the stress and the observed displacements can be obtained from equation (2.7):
σ =A1+A11 dU
dx +
1 2A111
dU dx
2
(2.9)
This single dimensional expansion can be obtained for three dimensional space using
Voigt notation [21]:
ρ∂ 2u
i
∂t2 =
Aijkl+Aijklmn
∂um
∂xn
∂2uk
∂xj∂xl
(2.10)
where Aijkl and Aijklmn are second and third order Huang coefficients and xi is the continuum of Lagrangian three dimensional coordinates.
2.2
Harmonic generation
2.2.1 Second harmonic generation
The wave equation can be expressed in perturbation terms:
U =u(1)+u(2) (2.11)
Whereu(1) is the plane wave solution and u(2) is the perturbation term. Suppose u(1) is a plane wave solution in the form:
u(1)=P1cos(kx−ωt) (2.12)
Where P1 is the amplitude of a plane wave traveling in the x-axis, with angular
frequencyω and wave numberk. For u(1) to be a solution to (2.8) it needs to satisfy
the boundary condition, where the wave is launched in the material at x = 0:
U(0, t) =P1cos(ωt) =P1cos(−ωt) (2.13)
The solution to equation (2.8) is obtained by adding the perturbation from u(2). For
full derivation refer to Cantrell [21] :
∂2u(2) ∂t2 =c
2∂u 2 (2) ∂x2 −
1 2 ˜
Subject to boundary conditions (2.13), equation (2.14) gives the general solution the
form of:
U =P1cos(kx−ωt)−
1 8 ˜
βc2k3P12sin(2(kx−ωt)) (2.15)
From this it can be concluded that the nonlinear parameter can be related to the amplitudes of the firstP1 and second P2 harmonic:
˜
βHG = 8
xk2 P2
P12 (2.16)
Where ˜βHG is the nonlinear parameter for a 1D sinusoidal wave propagating in an
ideal material without attenuation.
2.2.2 Attenuation of finite amplitude waves
By adjusting the solution (2.12) to the wave equation (2.8) to incorporate attenuation
from scattering, diffraction and absorption:
ρ∂ 2u
(1) ∂t2 =c
2∂ 2u
(1) ∂x2 +λdis
∂3u(1)
∂t∂x2 (2.17)
The solution for the fundamental wave is modified to ∂u(1)/∂x = α(1)u(1) . The
attenuation of the second harmonic is expressed in the same form, assuming it is
unaffected by the attenuation of the fundamental waveα(1):
∂P2 ∂x
attn
=−α(2)u(2) (2.18)
From (2.16):
∂P2 ∂x
HG = 1
8 ˜
βHGk2P12 (2.19)
Combining the two equations (2.18) and (2.19):
˜
βabs = ˜βHG
x(α2−2α1)
1−exp[−(α2−2α1)x]
(2.20)
Therefore the measured nonlinearity has to be compensated for the attenuation,
so that the material properties can be extracted. Measurements of the nonlinear
parameter without the compensation for diffraction, attenuation, transfer functions of the transducers can only provide relative values of the nonlinear parameter for that
exact experimental configuration. Such measurements can be used to show trends
this thesis, all measurements of the nonlinear parameter are non-normalised. Within
this thesis, theoretically defined expressions for the absolute value of the nonlinear parameter are labelled with ˜β, while relative values for the nonlinear parameter have
no accents.
2.2.3 Sources of nonlinear ultrasonic waves
Nonlinear ultrasonic wave interactions can result from lattice anharmonicity, deviating from a non-quadratic interatomic potential, or from nonlinearities involving defects,
microstructural features, or other disruptions in the lattice structure of the material. Two different models are available in the literature [26]: Cantrell [22; 23] and
Kim et al [99]. Cantrell’s model considers contributions to the nonlinear parameter
separately: lattice anharmonicity, dislocation sources and cracks. This model requires detailed information about the dislocation densities, loop length, dipole heights,
volume fractions. This makes the predictions accurate, but experimentally tedious.
The model of Kim et al. aggregate all the nonlinearity contributions induced during fatigue damage into the third order elastic constants of the material, assuming
the other parameters contribute very little to the increase of β. This allows for
more practical predictions for the variance of the nonlinear parameter, but the model fails to acknowledge the plastic deformations introduced by the acoustic wave
and makes the wrong assumptions about the contributions of third order elastic
coefficients (TOEC). Therefore the introduction in this thesis will focus on Cantrell’s predictive model. For simplicity, the following equations are given for one-dimensional
longitudinal ultrasonic waves. The corresponding set of equations in 2D and 3D are
given in Cantrell [21].
Anharmonicity of lattice
Considering the approximation of interactions (spring constants), the lattice
contri-bution to the nonlinear parameter ˜βlattice, can be expressed in the following terms,
where the Huang coefficients are defined in section 2.2.7:
˜
βlattice=−
A111 A11
(2.21)
Dislocation monopoles - Hikata model
From Cantrell [21] and Hikata [63] the contribution from monopole dislocations can
be taken as:
˜
βmp= 24
5
ΩΛmpL4R3
Where Ω is the conversion factor between shear strain and longitudinal strain, Λmpis
the monopole dislocation density,L is the dislocation loop length, R is the resolving factor of the shear to longitudinal stress,b is the Burgers vector andµ is the shear
modulus. It is worth noting that the contribution from dislocation monopoles requires
the application of stress to the structures. The formula is derived considering a longitudinal wave passing through the material, which drives the self-interaction of a
bowing dislocation line, under a quasistatic load.
Dislocation monopoles - Cash and Cai model
Recent research [27] has reported a more accurate formulation for the dislocation contribution to the acoustic nonlinearity. Dislocation dynamics (DD) simulations are
used to evaluate the analytical model for both pure screw or edge dislocations. For a
Poisson’s ratio in the range of 0.2 to 0.4, the constant line-tension Hikata model can no longer be considered valid. The contributions from edge and screw dislocations
show different behaviour with an increase of the line energy of the dislocation. The
model shows that there are possible negative values of β for materials with large Poisson’s ratiosν, and containing predominantly edge dislocations. These materials
include a large portion of the fcc engineering metals. The result for the nonlinear
parameter of an edge monopole dislocations is:
˜
βmpe
Λmpb2
= 24(1−4ν)(1−ν)
3ΩR3
5(1−2ν)4
L b
4
σ µ
+240(1−8ν+ 20ν
2)(1−2ν7)ΩR5
7(1 +ν)7
L b
6
σ µ
3 (2.23)
which allows for a negative contribution to the nonlinear parameter. This effect
can play a significant role in the early stages of fatigue damage, as the ultrasound
measurements can only measure the amplitude, but not the sign. Further research is required to confirm the dislocation monopole interaction with ultrasonic waves
under small applied stresses.
Dislocation dipoles
From Cantrell [21], the contributions from dislocation dipoles can be expressed as:
˜
βdp =
16π2ΩR2Λdph3(1−ν)
whereh is the dislocation dipole height,ν is the Poissons ratio and Λdp is the dipole
dislocation density. Dipoles inside the material form by forming dislocation pairs of edge dislocation of opposite polarity. The nonlinearity contribution from dipole
dislocation structures does not depend on the applied/residual stresses introduced to
the material. The dipoles interact with each other forming more complex structures. From Hull [70] the force between two pairs of dislocations can be expressed by:
F =− µb
2
2π(1−ν)
x(x2−y2)
x2+y2 (2.25)
where, (x, y) are the Cartesian coordinates of one dislocation in the dipole pair, relative to the coordinates of the second dislocation (0,0). Cash and Cai [28] have
improved the model for dislocation dipoles using DD simulations. The nonlinear
dipole contribution ˜βdp is shown to depend on stress, which previously was neglected. The spatial arrangement of the dislocations also affects the total contribution. It is
proposed that only single isolated dipoles contribute to a non-zeroβ at zero stress,
while larger structures have no contribution at zero stress. When cycled stress is applied to the structure, the formation of persistent slip bands (PSB) occur. Those
are often situated at grain boundaries or around secondary phase precipitates and contribute to the overall nonlinear parameter due to their multipolar structures. It
is important to understand the ultrasonic interaction of more realistic dislocation
microstructures during fatigue to predict acoustic nonlinearity parameters.
Precipitates
For polycrystalline alloys the distribution of precipitates must be considered. They have no direct contribution to theβparameter, but they interact with the dislocations.
The precipitate is incorporated in the material matrix and creates a local stress field,
which can bow a dislocation in the vicinity. This may lead to significant change in the magnitude of the measured nonlinear parameter.
Microcracks
Microcracks can generate higher harmonics due to contact acoustic nonlinearity
(CAN) mechanisms. The elastic waves can cause the microcrack surfaces to close or open - clapping mechanism. For longitudinal waves, during the compression
cycle the material elasticity is higher than that during the tensile part of the cycle.
behaviour can be observed in the early stages of delaminated composite materials or
in corrosion generated cracks. At larger damage scales such as macroscopic cracking, linear ultrasonics provide better options for damage detection.
2.2.4 Shear wave harmonic generation
Earlier derivations have considered mostly longitudinal wave propagation. For a
transverse wave, the lattice contribution to the nonlinearity cancels due to symmetry for almost all polycrystalline configurations. To express the self-interaction of a shear
wave, it would require one to formulate the stresses in three dimensions using the Piola-Kirchhoff stress tensorP. To express the equation of motion (2.1) in terms of
the first Piola-Kirchhoff stress tensor:
ρu¨=∇P (2.26)
Expanding the equation in terms of displacements and third-order elastic constants
and splitting the terms into linear (red) and nonlinear (blue) contributions:
PLij +PN Lij =λ∂uk ∂xk
δij+µ ∂ui ∂xj
+∂uj
∂xi ! + λ 2 ∂uk ∂xl ∂uk ∂xl
+C∂uk
∂xk
∂ul
∂xl
δij+B
∂uk ∂xk ∂ui ∂xj +A 4 ∂ui ∂xk ∂uk ∂xj +B 2 ∂uk ∂xl ∂uk ∂xl
+∂uk
∂xl
∂ul
∂xk
δij+ (λ+B)
∂uk ∂xk ∂uj ∂xi +
µ+A
4 ∂uj ∂xk ∂ui ∂xk
+∂uk
∂xj
∂ul
∂xi
+∂uj
∂xk
∂uk
∂xi
!
(2.27)
where (A),(B),(C) are TOEC as introduced by Landau [109]. By using the
pertur-bation method as in Bender [9], the self-interaction of a wave is described by:
∇PN L=j
"
λ+ 2µ+ A 2 +B
(UI·UI)(kI·kI)kI
+(2λ+ 4µ+A+ 2B)(UI·kI)(kI·kI)UI
+
A
2 + 3B+ 2C
(UI·kI)(UI·kI)kI #
1 2e
where UI is the amplitude of the wave andkI is the wave number. By considering
shear wave interactions:
UI=US cosθ 0 sinθ
, kI =kS sinθ 0 cosθ (2.29)
Equation (2.28) simplifies to:
∇PN L =jkS3
λ+ 2µ +A 2 +B
US2
sinθ 0 cosθ 1 2e
j(2ωt−2kSxsinθ−2kSzcosθ) (2.30)
Self-interaction of shear waves in the bulk generate longitudinal wave harmonics.
Due to the mismatch of the propagation velocity of the intrinsic transverse waves
and the generated compressive second harmonics, there is no cumulative generation. No coherent contribution to the shear wave nonlinearity from lattice anharmonicity
is allowed in an polycrystalline material under no-stress condition. In specific single
crystal orientations second harmonic generation is permitted due to anisotropy of the elastic tensor. As stated in Jiang [85] there are limitations to the research done on
shear wave interaction with dislocations: self-interaction of shear waves are prohibited
in isotropic media and there is no reported method to measure the absolute amplitude of shear waves. The later statement made by Jiang [85], is refuted in Monchalin [126].
Monchalin has used optical heterodyne interferometry to measure surface in-plane and out-of-plane displacements. However, such experimental measurement requires
complex laser path configuration.
2.2.5 Third harmonic generation
Third harmonics generation is a result of a symmetric nonlinear stress strain relation [63]. Due to the symmetric elastic relation no external stress is required to activate
the dislocation contributions to the nonlinear acoustic generation. In the case of third
harmonic generation, as opposed to second harmonic generation, the contribution from the lattice parameters is found to be an order of magnitude smaller than that
from dislocations. This allows easier study of dislocation generation and motion
An expression for the third harmonic parameterβ3 can be derived as in section 2.2.1.
β3 ∝
8
k3x A3 A31
!
(2.31)
whereA1,A3 are the amplitudes of the fundamental and third harmonics. Third
harmonic generation from the self-interaction is allowed for both transverse and
longitudinal waves due the symmetric stress-strain relation.
2.2.6 Guided waves
For guided waves nonlinear generation becomes more complex. Ultrasonic waves
in the bulk have non-dispersive behaviour, which allows for cumulative generation
of measurable harmonic signals. When constricted by the geometric boundaries of a structure, the acoustic waves are limited to certain wave modes. These modes
have dispersive nature and complex power flux. Specific conditions must be met to
cumulatively generate second harmonics when measuring using guided waves.
Lamb waves
Lamb wave are guided waves, which propagate in plates. They consist of
com-pressional and transverse waves that are reflected at the plate boundaries, as seen
in the schematic diagram in Fig. 2.3. Due to mode conversion at those multiple reflections, a standing wave interference patterns is formed. As a result, a wave will
propagate in certain directions guided by the geometry. A complete description of
the Rayleigh-Lamb frequency equation can be found in Rose [169].
2h
SV SV
P P
Figure 2.3: Wave reflections in a waveguide
To model the complex behaviour of the Lamb waves, one needs to split the wave potentials in two expressions.
φ= Φ(y)ei(kx−ωt) ψ= Ψ(y)ei(kx−ωt) (2.32)


![Figure 1.5: Stress strain curve for two different excitation levels adapted from [122The generated sine wave for the lower excitation level describes a hysteresis curvewith an average elastic modulus of]](https://thumb-us.123doks.com/thumbv2/123dok_us/9488924.454984/25.595.149.496.421.554/different-excitation-adapted-generated-excitation-describes-hysteresis-curvewith.webp)

![Figure 2.2: Atomic spring force for aluminium single crystal (a) [5]. Linear fit to theultrasonic elastic regime and plot of the residual errors to the linear fit (b).](https://thumb-us.123doks.com/thumbv2/123dok_us/9488924.454984/33.595.143.498.108.375/figure-atomic-aluminium-crystal-linear-theultrasonic-elastic-residual.webp)

![Figure 2.6: Stress strain curve for two different excitation levels adapted from [122The generated sine wave for the lower excitation level describes a hysteresis curvewith an average elastic modulus of]](https://thumb-us.123doks.com/thumbv2/123dok_us/9488924.454984/48.595.231.413.260.378/different-excitation-adapted-generated-excitation-describes-hysteresis-curvewith.webp)
