warwick.ac.uk/lib-publications
A Thesis Submitted for the Degree of PhD at the University of Warwick
Permanent WRAP URL:
http://wrap.warwick.ac.uk/88546
Copyright and reuse:
This thesis is made available online and is protected by original copyright.
Please scroll down to view the document itself.
Please refer to the repository record for this item for information to help you to cite it.
Our policy information is available from the repository home page.
Quantifying human behaviour using
complex social datasets
by
Federico Botta
Thesis
Submitted to the University of Warwick
for the degree of
Doctor of Philosophy
Centre for Complexity Science
CONTENTS
Acknowledgments iii
Declarations v
Abstract viii
Chapter 1 Introduction 1
Chapter 2 Background 5
2.1 Computational social science . . . 6
2.1.1 Google, Yahoo! and Wikipedia . . . 7
2.1.2 Social media data . . . 13
2.1.3 Mobile phone data . . . 19
2.1.4 Crowdsourced data . . . 21
2.1.5 Financial data . . . 22
2.1.6 Privacy issues . . . 23
2.2 Complex networks . . . 24
2.2.1 Communities in networks . . . 27
Chapter 3 Quantifying stock return distributions 29 3.1 Results . . . 31
3.1.1 Methods . . . 31
3.1.2 Changes in power law behaviour as ∆tincreases . . . 33
3.1.3 Evidence of exponential decay at larger values of ∆t . . . 34
3.2 Conclusions . . . 37
CONTENTS ii
Chapter 4 Quantifying crowd size 38
4.1 Data . . . 38
4.2 Results . . . 42
4.3 Conclusions . . . 49
Chapter 5 Measuring crowd size using Instagram photos 50 5.1 Data . . . 50
5.2 Results . . . 53
5.2.1 Selecting an appropriate spatial area for analysis . . . 56
5.2.2 Training models using only historic data . . . 57
5.2.3 Selecting an appropriate time windows for analysis . . . 61
5.2.4 Counting photos instead of users . . . 67
5.3 Conclusion . . . 71
Chapter 6 Communities of a mobile phone network 72 6.1 Time evolution of communities . . . 76
6.2 Period analysis of network structure . . . 79
6.3 Null model validation . . . 81
6.4 Weighted and multiplex analysis . . . 81
6.5 Conclusions . . . 83
Chapter 7 Modularity density 87 7.1 Traditional modularity and its limitations . . . 88
7.2 Modularity density . . . 91
7.3 A modularity density maximisation algorithm . . . 95
7.4 Implementation details . . . 99
7.1.1 Bisection . . . 99
7.1.2 Tuning steps . . . 105
7.1.3 Agglomeration . . . 111
7.1.4 Community detection algorithm . . . 113
7.2 Validation . . . 114
7.2.1 Disconnected communities and rings . . . 115
7.2.2 Random networks . . . 116
7.2.3 Benchmark networks . . . 118
7.3 Conclusions . . . 119
ACKNOWLEDGMENTS
Words cannot express how grateful I am, and will always be, to those who made all
of this possible.
Dr. Suzy Moat and Dr. Tobias Preis have been an incredible source of support,
ideas, discussion and help for the past three years. You have been truly inspiring
people to work with. You have gone above and beyond to help me, and this has been
an endless motivation for my work. With your help, I have learned what is the right
research question to ask and how to answer it, how to present my work to make
it engaging, how to make nice figures and use the correct font, and so many other
skills which I will always carry with me. Dr. Charo I del Genio has been a unique
source of knowledge on the topic of complex networks and computer programming.
I would have not been able to do many of the things in here without your intuition
on the problems.
And then there’s the rest..
There are people who will never see this work, but have nonetheless given an
im-mense contribution to it. All those moments shared with you will always be with
me. Amongst many, there’s Daniel Ek and Martin Lorentzon. Without them,
Spo-tify would not exist. And without Spotify, I wouldn’t have been able to focus and
ACKNOWLEDGMENTS iv
my PhD wouldn’t exist either. There’s also Ludovico Einaudi. If you think the
algorithm implemented in Chapter 7 is worth anything, believe me that it wouldn’t
have been possible without his music. The long hours spent coding were all with
his company. And of course, an immense acknowledgement to all the anonymous
contributors to the various websites that helped me solve all sort of coding issues
(last but not least, the placement of figures in this very thesis. Believe me, it was
not fun). What about the inventor of the Internet? Pretty sure that without him
this work wouldn’t exist. Literally. Even though, yes, some parts of the Internet
did distract me “occasionally”. Thanks, Facebook...
But wait, what sort of acknowledgements are these? Are you not going to thank
all those people, friends and colleagues, that supported you in the past three years?
The thing is, I do not like lists of names with just a short sentence next to each
name. I wouldn’t be who I am if it wasn’t for every single person who ever happened
to be part of my life. A short sentence wouldn’t do you any justice. You all made a
difference to me at some point, and this will never be forgotten, not even if I wanted
(unless I start forgetting things because of my old age). Certain things cannot be
expressed by words and are too personal. Better kept just between you and me. I
hope all of these people will understand. I will make sure that my actions, rather
than my words, will show you how grateful I am.
And then there’s one person who will never even know about this work, but who
has been the strongest source of inspiration. I like to think that you would have
been proud of me, that you would have been happy to see me here. Every second
of every day, every letter I typed, every bug in my code, you have always been with
me. You were strong, and I am not. Your support, your lessons, our memories, they
all mean the world to me. This journey would have not been possible without you
at my side. You have taught me how to get to the top of our mountains step after
step, and then enjoy the view from up there. I hope you will enjoy this one with
DECLARATIONS
This thesis is submitted to the University of Warwick in support of my application
for the degree of Doctor of Philosophy. It has been composed by myself and has not
been submitted in any previous application for any degree.
Parts of this thesis have been published by the author or are currently under review:
(1) Chapter 2 has been accepted as a chapter in the book Computational Social
Science in the Age of Big Data (Herbert von Halem, in Neue Schriften zur
Online-Forschung of the German Society for Online Research (DGOF); expected
publication in 2017);
(2) Chapter 3: Botta F, Moat HS, Stanley HE, Preis T. Quantifying Stock Return
Distributions in Financial Markets. PLOS ONE, 10: e0135600 (2015). At the
time of writing this thesis, it has received five citations and has been presented
as a poster at two workshops. Part of this work (the analysis using all trading
days and that at the 1% stress level) was performed as an MSc project. As such,
it is only summarised in the corresponding chapter. The full discussion can be
found in the published manuscript;
(3) Chapter 4: Botta F, Moat HS, Preis T. Quantifying Crowd Size with Mobile
Phone andTwitterdata. Royal Society Open Science, 2: 150162 (2015). At the
time of writing this thesis, it has received 22 citations and has been presented
DECLARATIONS vi
in more than ten conference talks, two of which invited;
(4) Chapter 6 is currently under review;
πρὸς ἐμαυτὸν δ᾿ οὖν ἀπιὼν ἐλογιζόμην ὅτι τούτου μὲν τοῦ ἀνθρώπου ἐγὼ σοφώτερός
εἰμι· κινδυνεύει μὲν γὰρ ἡμῶν οὐδέτερος οὐδὲν καλὸν κἀγαθὸν εἰδέναι, ἀλλ᾿ οὗτος μὲν
οἴεταί τι εἰδέναι οὐκ εἰδώς, ἐγὼ δέ, ὥσπερ οὖν οὐκ οἶδα, οὐδὲ οἴομαι· ἔοικα γοῦν τούτου γε σμικρῷ τινι αὐτῷ τούτῳ σοφώτερος εἶναι, ὅτι ἃ μὴ οἶδα οὐδὲ οἴομαι εἰδέναι.
When I left him, I reasoned thus with myself: I am wiser than this man, for neither of us appears to know anything great and good; but he fancies he knows something, although he knows nothing; whereas I, as I do not know anything, so I do not fancy I do. In this trifling particular, then, I appear to be wiser than he, because I do not fancy I know what I do not know.
ABSTRACT
Being able to better understand and measure what is happening in the world is of
great importance for a range of stakeholders, including policy makers. The recent
explosion in the availability of data documenting our collective behaviour offers new
opportunities to gain insights into our society.
Here, we focus on a series of case studies to demonstrate how new forms of data
may be used to help us better understand human behaviour.
Data coming from financial transactions taking place in the stock market can help
us better understand financial crises. We analyse a dataset comprising the stocks
forming theDow Jones Industrial Average at a second by second resolution. We
in-vestigate changes in stock market prices and how they arise at different time scales,
showing a transition between power law and exponential decay in the tails of the
distribution of logarithmic returns.
Accurate and quick estimates of the size of a crowd are crucial for the avoidance of
crowd disasters. However, existing approaches rely on human judgement and can
be slow and costly. Our findings suggest that data from mobile phone networks and
social media platforms may allow us to estimate the size of a crowd. Such data could
potentially be accessed in real time, leading to shorter delays than those experienced
ix ABSTRACT
with previous approaches to crowd size estimation.
We also show how communities on a network constructed from our social
inter-actions through smartphones capture the temporal evolution of our behaviour in
everyday life.
The complex datasets presented here also require complex methodologies to
anal-yse them. Complexity science, and more specifically network science, has witnessed
increasing attention within the scientific community in the last two decades. Here,
we will present a new technique to analyse a common feature of many real world
complex networks, namely community structure. We show how our methodology
addresses many of the drawbacks of current techniques, and we also introduce an
efficient algorithm which outperforms analogous methods on a set of standard
bench-mark networks.
Our findings suggest that the analysis of large complex social datasets coupled with
methodological advances can allow us to gain valuable measurements of human
CHAPTER
1
INTRODUCTION
Imagine you just woke up. You stay in bed a few moments longer, checking the emails that your smartphone has automatically downloaded for you. You have a quick look at your favourite social media platforms. Maybe you like a post, or retweet a message. You get up, and scroll through some of the major newspapers on your tablet while having breakfast. An article about your favourite comedian catches your attention. She will be doing a show later on this week in your home town. You consult a search engine to find out more about it. With a few clicks, you fill in all your credit card details and buy a ticket. You leave the house in a rush, get to the underground station and walk in, swiping your contactless card. At lunch, you take a photo of your meal and upload it to a social media platform. You geolocate it, so that all your friends know where they can find that food. At the end of your long day, you do some exercise, tracking your run across the park with a dedicated fitness app. Later on, you watch a video online and decide that it’s worth sharing. The information travels across your social network to all your friends, and then cascades through several social groups.
We live in a digital world. Data on our behaviour, interests, hobbies and social
inter-actions are constantly being generated. Never before have we had the opportunity to gain such a detailed picture of our lives and collective behaviour. Smartphones,
social media platforms and the Internet have radically changed our lives in the last
two decades.
The ability to better understand human behaviour and to gain insight into our
society is vital for a range of decisions taken by governmental and commercial
CHAPTER 1. INTRODUCTION 2
holders. State-of-the-art procedures to gather and process data to measure the state
of our world — e.g. unemployment rates or gross domestic products — are often time consuming and costly, and can strongly rely on human judgement. Here, we
highlight that existing approaches could potentially be complemented by new forms
of data capturing a broad spectrum of human activities in a highly interconnected world. The variety of these new forms of data ranges from information seeking and
dissemination behaviour online to mobile phone and crowdsourced data, opening
up a new window for scientists to study complex social systems. In the following chapters, we will present a series of case studies where the wealth of data available
allows us to gain valuable insight into our behaviour and our society.
In Chapter 2, we present a detailed discussion of the variety of studies that have
exploited these new sources of data to measure the state of a range of complex
social systems. We show how data from search engines, such as Google and Ya-hoo!, social media platforms, including Twitter and Flickr, and data derived from our interactions with smartphones have been used to study our collective behaviour.
The ability to quantify the probability of large price changes in stock markets is
of crucial importance to understand financial crises that affect the lives of people worldwide. Large changes in stock market prices can arise abruptly, within a matter
of minutes, or develop across much longer time scales. In Chapter 3, we analyze a
dataset comprising the stocks forming the Dow Jones Industrial Average at a sec-ond by secsec-ond resolution in the period from January 2008 to July 2010 in order
to quantify the distribution of changes in market prices at a range of time scales.
We find that the tails of the distributions of logarithmic price changes, or returns, exhibit power law decays for time scales ranging from 300 seconds to 3600 seconds.
For larger time scales, we find that the distributions tails exhibit exponential
de-cay. Our findings may inform the development of models of market behavior across varying time scales.
Being able to infer the number of people in a specific area is of extreme impor-tance for the avoidance of crowd disasters and to facilitate emergency evacuations.
In Chapter 4, using a football stadium and an airport as case studies, we present
ev-idence of a strong relationship between the number of people in restricted areas and activity recorded by mobile phone providers and the online service Twitter. Our findings suggest that data generated through our interactions with mobile phone
cur-3
rent state of society.
Chapter 5 builds on and extends the results of the previous chapter. In
partic-ular, we show that publicly available data generated with our interactions with the
social media platform Instagram can offer accurate measurements of the size of a crowd. We show that the number of users active onInstagram in a given place at a specific time can be used to infer the number of people in that location. We also
present a detailed analysis that shows how changes in the behaviour, or number, of users need to be considered. Comparing the results we obtain in two different
ar-eas, we investigate how the relationship varies across locations. Our results provide
further evidence that data derived from ordinary interactions with social media can be used to study our collective behaviour.
The analysis of increasingly complex data sets requires complex methodologies. A powerful tool which has gained increasing importance in the last two decades is
that of networks. Networks are ubiquitous in society. Computers are connected
together through the Internet; pages on the web have hyperlinks that allow users to navigate from page to page; cities are connected by airports and train stations;
people are linked to each other on various levels, such as kinship, friendship, and work relationship; scientific discoveries build on previous work, thus creating links
between scientists. Network thinking allows to develop a framework to model and
understand the properties of these systems.
In Chapter 6, we present a detailed analysis of the community structure of the
network of mobile phone calls in the metropolitan area of Milan revealing spatial and temporal patterns of communications between people. Our findings suggest
that we can extract information about the behaviour of people from communication
records and the interactions between social circles.
Identifying communities in a complex network is a key challenge for scientists. A
common approach is to search for the network partition that maximizes a qual-ity function. In Chapter 7, we present a detailed analysis of a recently proposed
function, namely modularity density. We show that it does not incur in the
draw-backs suffered by traditional modularity, and that it can identify networks without ground-truth community structure, deriving its analytical dependence on link
den-sity in generic random graphs. In addition, we show that modularity denden-sity allows
CHAPTER 1. INTRODUCTION 4
efficient community detection algorithm based on modularity density maximization,
CHAPTER
2
BACKGROUND
Being able to better understand human collective behaviour is of fundamental
im-portance for the shaping of a sustainable, efficient and smart society. Knowledge of
what is happening in the world right now and of the current state of our society is crucial for a range of policy makers and stakeholders. Traditionally, obtaining such
knowledge is a lengthy, costly and slow procedure that requires a great amount of
human input and personal judgement. For instance, surveys, censuses, interviews and opinion polls gather data on samples of the population. Statistical agencies,
researchers and private companies then analyse these data to extract estimates at a
population level.
Recent years have witnessed an explosion in the availability of large and complex datasets encoding a vast amount of information on human behaviour in a readily
accessible format. People interact with large technological systems, such as the
Internet and mobile networks, to perform a range of actions, from information gath-ering to building social relations. This generates a large collection of digital traces
that scientists from several disciplines can analyse to gain further insight into
hu-man behaviour and our society. Crucially, these new forms of data are, in principle, available immediately after their generation. In line with the traditional notion of
forecasting, this has defined a new area of research called “nowcasting”, or the
pur-suit of using readily available sources of data to estimate the current state of society before other slower datasets become available.
The sudden availability of these large complex datasets also requires rigorous
CHAPTER 2. BACKGROUND 6
Search
engines
Phone
calls
Apps
Credit
cards
Data
science
Wearables
Emails
Internet
browsing
[image:17.595.88.476.143.385.2]Social
media
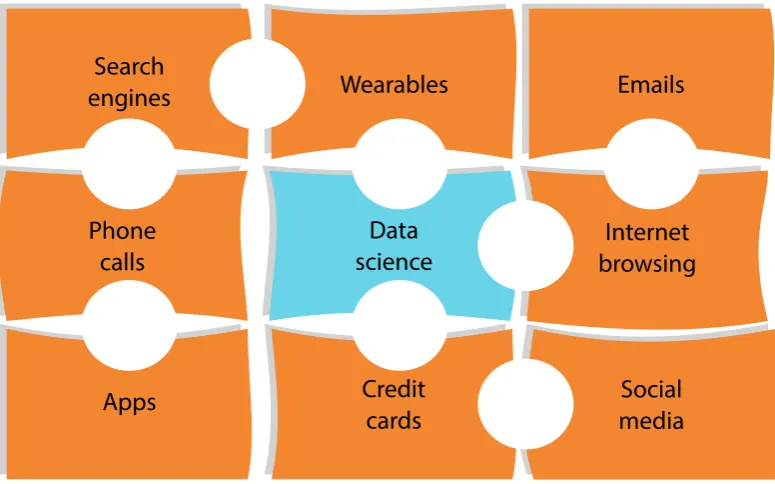
Figure 2.1: Data Science | In recent years, large complex datasets contain-ing detailed records of our collective behaviour have become increascontain-ingly available. Our interactions with technological systems, such as the Internet and mobile phone networks, generate huge volumes of data that can be analysed to help us better understand human behaviour.
ologies and tools to analyse and interpret them. Disciplines such as physics,
math-ematics, economics, computer science and statistics can all make a contribution to
this emerging area of research, frequently referred as Data Scienceor Computa-tional Social Science [1–7]. Methods from all these disciplines, and many others,
have been adapted to study social systems.
The combination of complex methodologies and the availability of large scale datasets
is at the basis of models that can be used to measure human behaviour and may even be used to predict what is going to happen in the near future. In this Chapter,
we will present a review of key results obtained through the analysis of large social
datasets, as well as a review of some of the methodologies of interest for the rest of our work.
2.1
Computational social science
Analysis of large social datasets has potential to help us improve our understanding
7 2.1. COMPUTATIONAL SOCIAL SCIENCE
sources and be of different nature (Fig. 2.1). Search engines and online services
such asWikipedia collect a large corpus of information on what people are looking for; this may allow us to gain further insight into our decision making processes.
Social media platforms offer further opportunities to investigate our social
interac-tions, potentially shedding light on how a disease may spread through a population or how opinions may evolve.
We regularly check our emails, make phone calls and send messages through our smartphones. Datasets generated from these processes encode knowledge on our
interactions and on the dynamics of our daily lives. The ubiquitous presence of
smartphones in our lives also offers opportunities to conduct large scale social ex-periments. Compared to experiments or surveys, these studies have the potential
to include numbers of participants orders of magnitude larger than what has been
possible so far. The vast amount of personal information contained in these datasets also poses many challenges. Researchers and stakeholders alike may have detailed
knowledge of individuals and their online behaviour. Privacy issues are an
impor-tant feature of this new area of research and need to be considered carefully.
This section reviews the main results in the analysis of data derived from such sources, alongside some considerations of potential issues in the analysis of large
social datasets.
2.1.1 Google, Yahoo! and Wikipedia
Decision making is a cognitive process in which people have to make a choice among many possibilities. People choose on the basis of their personal knowledge and the
information available to them. In the digital era, the information gathering process
often happens online. We use the Internet in a range of situations, including booking our holidays, looking up the weather forecast, buying goods, or searching for a job.
We live in a connected world, where more often we collect information online. Search
engines, such asGoogle andYahoo!, are the starting point of our browsing activity, since they offer a quick method to find the most relevant websites on the topic
under consideration. Every day, we generate a large amount of information on our
interests through our search queries, and companies store these data to improve their algorithms and target their customers more accurately. However, these datasets
also contain an enormous amount of information on the collective decision making
CHAPTER 2. BACKGROUND 8
Search query data One of the key sources of data in the emerging field of
Com-putational Social Sciences are search engines. Due to its widespread use,Googlehas been the focus of several studies. Google provides access to search queries through
Google Trends1. Here, a user can access a time series index of the volume of queries for keywords that people are typing into the search engine. Data on search queries can be requested since 2004, and queries can be restricted to various geographical
areas. For privacy reasons, the index returned is normalised so that the highest
value is equal to 100 and datasets for keywords with a very low search volume are not made available. Data derived from Google Trends can be used to gain insight into several aspects of social systems.
A team of researchers from Google itself joined forces with theCenter for Disease Control and Prevention to exploit search query data to detect influenza epidemics [11]. Traditional surveillance systems have been developed on the basis of several sources of data, such as virological and clinical data, influenza-like illness (ILI)
symp-toms, or reports of visits to doctors. This collection process is slow, and the reports
on levels of influenza are typically reported with a lag of one to two weeks. By pro-cessing hundreds of billions of individual searches from several years, the authors
were able to build a statistical model, calledGoogle Flu Trends, to perform near-to-real-time surveillance of influenza levels at different geographical scales. This study
decreases the reporting lag to as little as one day. Other studies have highlighted
the importance of information available in search query data to improve disease surveillance [12, 13].
Policy makers and governments have a great interest in accurate estimates of the status of the economy, the job market and several other indicators of the state of
society. In [14], the authors analyse search query data in four specific case studies
aimed at estimating various key indicators for a society, such as initial claims for unemployment benefits, travelling statistics and consumer confidence. This work
uses autoregressive models to show that the inclusion of online data can outperform
existing models by a margin ranging from 5% to 20%. A related study addresses the challenge of nowcasting unemployment rates in a specific group of countries in
Eastern Europe, namely the Czech Republic, Hungary, Poland and Slovakia [15].
Search query data can also offer an interesting perspective on the collective interest
in the future of a population. Previous works has found that countries with a higher
1
9 2.1. COMPUTATIONAL SOCIAL SCIENCE
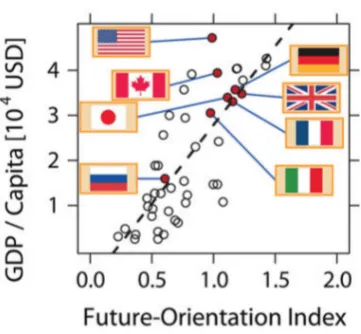
Figure 2.2: Future Orientation Index | Countries with a higher tendency of searching for the future onGoogle show a larger GDP per capita. Figure taken from [16].
per capita gross domestic product (GDP) report a higher interest in future years,
as opposed to previous years [16, 17]. The authors of this study construct an index based on search data to measure to what extent Internet users in a given country
search for information about the future and show that this strongly correlates with
the country’s per capita GDP for several countries worldwide. Figure 2.2 depicts the relationship between the so-called Future Orientation Index and the GDP per capita.
Web search queries can also offer insight into the decision making process of
in-vestors in the financial market. Datasets on search queries on Google have been shown to bear a relationship to stocks listed in the S&P500 index [18]. An
anal-ogous relationship has been found between data derived from the search engine
Yahoo! and stock market data for those companies listed on the NASDAQ stock exchange [19]. The daily number of search queries for a particular stock is strongly
related to the volume of exchanges of the same stock, providing a link between
the two. Interestingly, various statistical tests enable the authors to validate the directionality of the correlation and also the appearance of awisdom of crowd ef-fect: individual users typically search one stock only once rather than repeatedly,
thus suggesting that the information gathering process is led by non expert investors.
CHAPTER 2. BACKGROUND 10
for financially related keywords, such as “debt”, and buys or sells hypothetically
stocks according to the dynamics of search behaviour. A related study has also shown that the semantic nature of the keywords provides insight in stock market
movements [21]. For instance, data on searches for business or politics related
key-words can be used to successfully trade stocks in the financial market, whereas data on music or movie related searches would achieve returns analogous to those of an
entirely random trading strategy. Google search queries exhibit power law cross correlation properties for theDow Jones Industrial Average (DJIA) stocks [22] and can also be used for portfolio diversification [23].
An interesting area of research is at the intersection between online data and digital currencies. Bitcoin2 is a digital currency and open-software payment system that was introduced in 2009 and is the most popular of the virtual currencies introduced
so far. These currencies are of interest because they are not issued by any specific central bank and are not related to any government. As such, their value has no
par-ticular connection with the real economy. However, some of these currencies, such
as Bitcoin, experience wild fluctuations in their value. A strong relationship can be found between Bitcoin prices and searches for the currency both on the search engineGoogle and the online encyclopediaWikipedia[24]. Sophisticated techniques, such as wavelet coherence analysis, have then identified correlations between
var-ious sources of price movements ofBitcoin, from online data to financial indices [25].
Our collective behaviour can often be predicted in cultural activities too. Yahoo!
query data can be used to estimate the revenues of box office feature films in their
opening weekend, as well as sales of video games or the ranking of songs [26].
Wikipedia Wikipedia is a free Internet encyclopedia where users can access and edit the articles themselves. It is vastly popular, and is one of the most visited
web-sites. Due to its comprehensive open access summary of information, it is widely
used worldwide. Data on page views and editing history are publicly available, thus offering an ideal source of knowledge on what people are looking for online.
The growth of the encyclopedia itself has attracted the interest of researchers [27]. Representing Wikipedia as a directed network, with topics being vertices and hy-perlinks being edges, the authors find properties similar to those of the World Wide Web, despite a different growth mechanism. This suggests that the growth of
2
11 2.1. COMPUTATIONAL SOCIAL SCIENCE
Wikipedia can be described using local rules, such as preferential attachment [28]. Another study has focused on the hierarchical knowledge structure of the encyclo-pedia, trying to infer it from a network of related terms onWikipedia [29].
The number of visits to financially related pages on Wikipedia can provide early signs of stock market moves [30], whereas views of pages in other categories, such
as pages of actors, do not offer any information on stock market movements. This
may provide evidence that data derived from Wikipedia can give an insight in the information gathering process of agents in the financial sector.
Since data on the editing dynamic of pages are available, researchers have also fo-cused on measuring editorial activity onWikipedia [31]. Analysing data from pages in 34 different languages, the authors investigate the geographical distribution of
editors worldwide. This is of interest because the spatial distribution of editors may play a role in the biases present in certain pages, and it may explain the
heterogene-ity in topical coverage. The editorial activheterogene-ity seems to follow a universal circadian
pattern for all pages, with a minimum at dawn and maximum later towards the end of the day. Interestingly, the majority of edits in English comes from Europe
rather than North America. Controversial Wikipedia pages offer a fascinating case study on how editorial wars and social conflicts develop. An automated approach
for detecting such conflicts has been developed [32], allowing for detailed studies of
several editorial wars [33].
Wikipedia pages often provide biographies of important people across a range of disciplines and sectors. However, it is an open question whether the coverage pro-vided by the online encyclopedia gives an accurate image of the situation in the real
world. A first study found biases in the coverage of 400 academics on Wikipedia, showing that there was no statistical relationship between their Wikipedia pages and their academic performance [34].
In a similar fashion to search query data, information coming fromWikipediacan of-fer insight into our collective reaction to a new cultural product or change. The
pop-ularity of movies, for instance, can be predicted long before their release by analysing
CHAPTER 2. BACKGROUND 12
Email data Email data also contain a large amount of information on our
activ-ities and purchases. However, they are privately owned by companies that need to ensure the confidentiality of their users. As such, studies using these data are often
performed by a team in the company itself. In [37], the authors analyse a large
Yahoo! email dataset to predict the behaviour of consumers when purchasing goods online. A demographic analysis of users shows that the amount of money spent
grows with the age of users, peaking in the late 30s. Patterns found in these data
may help improve targeting systems for advertising companies.
Issues Online data coming from search engines and other platforms that share
large scale information can be used in a variety of situations to understand our collective behaviour. However, large social datasets have to be exploited carefully.
Despite them capturing a large amount of information, they cannot always replace
traditional sources of data. Biases can always be present, and may be magnified by the huge volume of information available. The demographics of Wikipedia or
Google users may not be representative of the whole population, for instance. Any result building on these sources of data may then not necessarily apply to the en-tire population. The sources of data themselves may also vary, both in availability
and collection. For instance, algorithms behind search engines evolve to adapt to
their users’ needs, thus changing the way the data themselves are generated. The algorithms themselves are also privately owned, thus not allowing for transparency
in the data gathering process. It is also important to bear in mind the difference
between natural physical systems and social ones. Whereas particles or cells do not react to mathematical models analysing them, agents, such as people purchasing
goods or investors trading stocks, respond and adapt to predictions made about their systems. This leads to several questions on the long-term predictability of
complex social systems. An important case is that of the aforementioned Google Flu Trends. In 2013, the predictions of influenza cases given by the algorithm were more than double the real values. Several causes have been suggested for this, such
as change in the behaviour of Internet users due to extensive media coverage of the
2013 flu that led to users wanting to know more about this [38]. A more transpar-ent methodology and data-sharing practice would have also been beneficial, but this
may be hard to achieve in situations where a company owns the data.
Big social datasets have to be analysed and interpreted carefully, and may not be
able to substitute traditional sources. Indeed, a recent study has shown that online
13 2.1. COMPUTATIONAL SOCIAL SCIENCE
historic flu levels, can be used to estimate levels of influenza [39]. This suggests
that online data should complement traditional data to increase the accuracy of predictive models, rather than replacing them. Similar results have also been found
in studies using data derived from Wikipedia [40].
2.1.2 Social media data
Social interactions form the basis of our social structure. Individuals create relations
with each other leading to the emergence of the complex societal structure that we observe as a whole. Social norms and institution are established as a consequence.
Traditionally, most interactions among individuals happen face-to-face and arise in
a range of social contexts, such as family, friendship, business relations, geographical proximity or religious settings. Recent years have witnessed a shift in the way social
interactions take place. People can now create new relationships in the online world,
without the need of ever meeting face-to-face. Information flows through a highly connected social structure and interactions happen at an incredibly fast rate on
social media platforms. It is probably not a surprise to know that computational
social scientists have focused their attention on these new forms of social data. They provide an ideal setting for studying human behaviour at a large scale without having
to conduct expensive and time consuming mass surveys.
Twitter Twitter3 is among the most popular social networking websites. Regis-tered users can send short messages, called tweets, of up to 140 characters. Users can follow other users and share their tweets, an activity called retweeting. Twitter
immediately attracted the attention of researchers because the company makes part
of their data available through the corresponding API. As was the case for search query data, an important research question concerns the relationship between the
flow of information on Twitter and the behaviour of the stock market. Since our decision making process can be affected by emotions, researchers have investigated
the collective mood of Twitter feeds and its correlation with the DJIA index [41]. Calmness of the generalTwitter public was found to improve the accuracy in pre-dicting the index. Twitterdata have also been used to estimate the socio-economical status of specific geographical regions, with a particular focus on unemployment [42].
Since its onset,Twitter was used as a way to quickly share near-to-real time news. It is thus interesting to analyse the collective behaviour of people around large events
that may trigger contrasting emotions in the population. Politics and protests, for
3
CHAPTER 2. BACKGROUND 14
Figure 2.3: Twitter popularity of the two final contestants across the
US | Each US state is represented with an area proportional to the number of geotagged tweets coming from that state. Each state is then coloured according to the contestant who is more popular in that state. States coloured in gray cannot be assigned based onTwitter activity alone. Figure taken from [49].
instance, are prime examples of this. In the period leading up to the 2010 US
congress elections, users have been shown to mostly retweet other users with a
sim-ilar political view, thus reinforcing their opinions [43]. However, users engage in discussion with the entire network when mentioning other people in their tweets.
The overall sentiment of the population is reflected by tweets in the German federal
elections and the number of messages is a good indicator of the final outcome of the voting process [44]. Properties similar to those of physical systems close to a critical
point have been found in the network of users involved in the Spanish anti-austerity movement during the May 2011 demonstrations [45]. Mechanisms of recruitment for
the same protest have also been investigated and found to exhibit patterns analogous
to those of complex disease contagion [46]. The information flow around terrorist attacks has also been studied [47], as well as the growth of communication network
around the Occupy Wall Street movement [48].
Popular cultural events are also often discussed via Twitter. Using the activity of users on the platform, a team of researchers has analysed data related to
Amer-ican Idol, a popular TV show [49]. The results suggest that the rankings of the contestants in the show are significantly correlated with the activity on Twitter. This study provides evidence that social media data can be used to anticipate the
15 2.1. COMPUTATIONAL SOCIAL SCIENCE
voting for the show is restricted to, increases the predictive accuracy, thus
show-ing the importance of the spatial information available in the dataset. Figure 2.3 depicts the popularity on Twitter of the two finalists. The area of each US state is proportional to the number of geotagged tweets coming from that state, and the
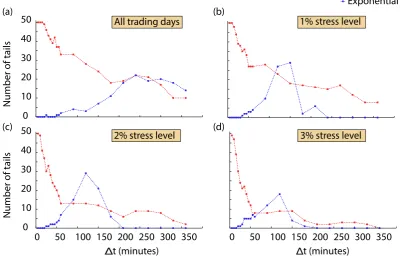
colour indicates the contestant with the higher proportion of tweets (Fig. taken from [49]). Another study investigated more generally the dynamical properties of
large collective social events onTwitter [50]. The authors focused on the release of a Hollywood blockbuster movie, protests, the discovery of the Higgs boson and other events. They use information theory techniques, such as symbolic transfer entropy
analysis, to study how the dynamics of these systems change before, during and after
the event. The main finding is that the characteristic time scales of the information transfer varies as you approach the event. More precisely, events which are mainly
driven by an endogenous flow of information show a decrease in the time scale long
before the onset of the actual event. Instead, events triggered by external factors show a constant flow of information until the event has taken place (Fig. 2.4). This
study suggests that algorithms could be designed in order to analyse large collective
events using open access data.
Similar results for the discovery of the Higgs boson have also been found in [51].
Languages and their dynamics can also be studied [52]. Their use can be mapped
across the world [53] and differences in how they are used can also be analysed [54].
Language and the spatial distribution of users may affect how new social links are established on Twitter [55]. Human mobility can also play a role in how a social network grows, and the position of a user in the social network can also be used to
predict their location [56].
Since Twitter users are not representative of the whole population, studies have also focused on investigating the demographic characteristics of people who tweet, such as their age, occupation, social class, and what factors affect the decision of
sharing their location on the social media platform [57, 58]. Several other social
features ofTwitter have been investigated in recent years [59–61].
Facebook Facebook4 is another widely popular online social networking website. Registered users can set up their own profile, add other users as friends, exchange
messages with each other and more generally share information with their social
ties. Despite its high penetration rate,Facebook has been at the centre of relatively
4
CHAPTER 2. BACKGROUND 16
17 2.1. COMPUTATIONAL SOCIAL SCIENCE
few studies because the company makes very little of their data publicly available.
Studies have to be performed either by the research team atFacebook or on datasets that have been collected via Facebook apps.
A series of papers has focused on the problem of how misinformation spreads on
Facebook [62–65]. Comparing information flow on pages about either scientific news or conspiracy theories, researchers have found find that users selectively expose
themselves to content which is in agreement with their views, thus creating so-called echo chambers and polarised communities in the social network structure.
Other topics for which echo chambers appear are for pages related to environment,
diet, health and geopolitics.
A team of researchers from Facebook has shown that users’ choices play a signif-icantly more important role in limiting exposure to challenging content, rather than this being an effect of the algorithms that decide what appears onFacebook’s News Feed [66].
The possibility of having direct access to the social media platform from within
the company allows for large scale social experiments. A randomised controlled trial of 61 million Facebook users has shown that messages on the social media platform can be used to influence political self-expression, information seeking and
voting behaviour in the 2010 US congressional elections [67]. Information diffusion onFacebook has also been studied in a large scale social experiment on 253 million individuals [68]. Interestingly, the authors find that weak ties may play a dominant
role in how information is diffused on the social network, thus underlining their importance. Large scale experiments can also help researchers tackle questions on
how emotions spread across a social network. A controversial study showed that
emotions expressed by other users on Facebook may influence our own emotional status [69]. In particular, a reduction in positive posts shown to a user leads to an
increased production of negative posts by that user, and vice versa. Interestingly,
the authors show that emotional contagion can also happen online without the need of face-to-face interactions.
The emergence of social communities in the friendship network has also been studied
CHAPTER 2. BACKGROUND 18
19 2.1. COMPUTATIONAL SOCIAL SCIENCE
Flickr Flickr5 is a photo sharing platform where users can upload, tag and com-ment photos. Flickr has been the focus of several studies thanks to the public API which gives free access to the entire dataset. Human mobility patterns across the
UK can be inferred by looking at the spatial and temporal trajectories ofFlickr users [72]. International movements can also be estimated and the estimates have been found to correlate significantly with official estimates [73]. Interestingly,Flickr data can also be used to quantify the presence of art in a city such as London. In [74],
the authors show that neighbourhoods with a higher proportion of art photographs also exhibit a greater relative gain in property prices. Another study has shown
that the number of photos tagged with a keyword related to protest correlates with
a the number of news reports about protests in the corresponding country [75].
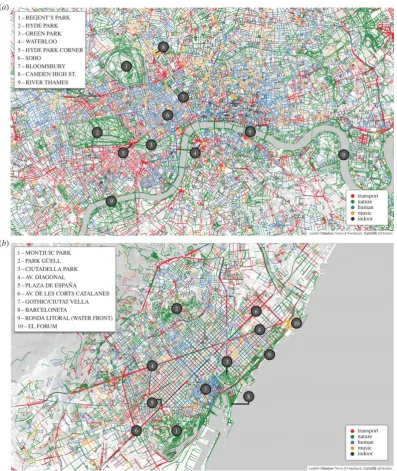
The large availability of geo-tagged photos and tweets has also been used to build
detailed maps of how users experience the environment around them. In partic-ular, using photos from Flickr and Instagram6 , another photo-sharing platform, and posts from Twitter, researchers have been able to map the smells, sounds and emotional layers of cities [71, 76, 77]. Figure 2.5 depicts the urban sounds in two different cities. These studies suggest that social media data may provide a
funda-mental support to policy makers in the design of smart and sustainable cities which take into account how citizens perceive the environment they are living in.
Studies based on other social networks have explored the laws of human mobility using data from location-based platforms [78], how communication between users
affects the growth of social networks [68], and what biases may be present in samples
of data retrieved from publicly available APIs [79].
2.1.3 Mobile phone data
Smart mobile phones have had an enormous impact on our every day lives. We
now have the opportunity to make phone calls, browse the Internet, read emails,
update our social media, all just with our fingertips. We have GPS enabled de-vices which can give us directions on a map. We can even make transactions using
dedicated applications on the phones. Due to their high penetration rate, which in
certain countries is over 100%, smartphones can be used as sensors of most aspects of our daily lives. This has been a great stimulus for the scientific community to
investigate our collective behaviour using the vast amount of data generated on our
5flickr.com
6
CHAPTER 2. BACKGROUND 20
smartphones. A detailed survey of some of the main results in this area has been
recently published [80]. Here, we will only focus on specific key results.
Mobile phone datasets typically come in the form of Call Detail Records (CDRs). CDRs are recorded by mobile phone providers for billing purposes and contain a large amount of information on our communication patterns. In [81], the authors
provide a detailed description of how CDRs are constructed in a specific example.
CDRs contain our social interactions, but also spatial and temporal information. They can address some of the shortcomings exhibited by traditional surveys.
Sam-ple size is typically not an issue and will most likely be orders of magnitude larger
than what is common in social science studies. Some of the self-reporting biases are not likely to occur, but new ones may be introduced. For instance, it is important to
bear in mind that these data only capture a specific aspect of our social structure,
namely that expressed via mobile phones. The demographic characteristics of users may also vary and may influence the usage patterns of smartphones.
A range of studies have focused on the geographic information stored in these datasets in order to estimate the density of population living in different regions
worldwide [82–84]. Geographical distance has also been shown to play a role in the probability of communications occurring. In [85], the authors analyse data from
more than two million users in Belgium and find that the probability of two users
being connected through a mobile phone communication decreases with the square distance between them in a gravity-like fashion. An analogous relationship on the
same dataset also holds between the communication duration and distance [86].
Temporal dynamics can also provide interesting insights into our social behaviour.
The persistence of a link in a mobile phone network has been shown to follow a
bimodal distribution [87]. Most links either appear just once in the network, or they always appear. This suggests that most phone calls either take place once or
they happen regularly between two users.
Understanding how people move is of great importance for several reasons, such as
infrastructure planning, public transport design and spreading of epidemics. Mobile
phones offer a unique opportunity to study our movements, since they can combine both the spatial and temporal dimension of our behaviour. Interestingly, individual
mobility has been shown to follow regular patterns that exhibit a high degree of
21 2.1. COMPUTATIONAL SOCIAL SCIENCE
characteristic spatial length of each individual’s trajectory, the authors show that
human mobility follow simple and reproducible patterns.
2.1.4 Crowdsourced data
Mobile phones, social media and more generally the Internet allow researchers to perform large-scale surveys and experiments with the potential of reaching out
hun-dreds of thousands of people. This compares favourably with traditional social
science surveys and experiments which typically cover a few hundred participants in the best scenario. Researchers can design applications for smartphones and use
them as social sensors for their particular research interests. Traditional surveys are
usually administered once or few times to each participant, making it difficult to gain granular data on within-individual variations over time. Since we constantly
interact with our smartphones, a well designed application can track the relevant
features more regularly. Scientists can also create dedicated websites that people can browse and interact with, and this can provide an additional source of data.
In [89], the authors use data from a crowdsourced platform where users had to compare streets in London and rate how beautiful, quiet and happy they were.
From the ratings, they construct measures of how different routes are perceived and
then construct a recommendation system that suggest routes that are not only short but also emotionally pleasant. Another study investigated the role of green spaces
on happiness [90]. The authors designed an application for smartphones that would
present a short questionnaire to their users at random moments during the day. The questions were designed to measure the momentary subjective wellbeing of the
user. This study managed to collect over one million responses from its users and the results indicate that users are happier in green spaces or other natural habitats.
A related question is that of the relationship between environmental scenicness and
our health. Using crowdsourced data from the website Scenic-Or-Not, researchers have shown that people living in more scenic areas report better health in urban,
suburban and rural areas [91]. The relationship holds also when taking other
so-cioeconomic indicators of deprivation into account, such as income and employment.
Crowdsourced data have also been used to study human interactions in different
environments and how they can affect the transmission of diseases. The SocioPat-ternscollaboration project has performed several data collection studies on physical proximity and face-to-face interactions of people. This has resulted in several
CHAPTER 2. BACKGROUND 22
contacts can influence the transmission of diseases [92–105].
2.1.5 Financial data
The financial market is a complex system for which detailed records of human
deci-sions in form of financial transactions exist. The analysis of such systems has drawn the attention of many physicists, because the accessibility of this large amount of
experimental data is a unique opportunity to study in detail the statistical
proper-ties of financial markets.
Market changes are of extreme importance since they affect the personal fortunes of
people and may also have consequences at political levels. A vast number of studies have focused on many different aspects of financial markets, trying to unravel all
the different facets of such a complex system. A first major effort dates back to
the 1970s when Black and Scholes derived a first rational option-pricing formula. Since then, however, many different changes have happened in the financial world:
the volume of transactions has quickly increased, the financial derivative market
has grown exponentially and electronic trading has become standard (thus allow-ing electronic storage of data). The original proposal of Black and Scholes models
the distribution of relative price changes as a log-normal distribution, but it is now
known that this provides only a first approximation of what we actually observe in experimental data. In particular, it was first shown by Stanley and collaborators
that distributions of returns found in empirical data are consistent with a power law
decay [106–109]. These fatter tails assign higher probabilities, compared to Gaus-sian tails, to extreme events; therefore, the study of such datasets is of fundamental
importance since rare events in stock market transactions are high risk situations in which investors want to avoid large losses. Many important features of financial
markets have been discovered since then and power laws have been found to describe
fluctuations in prices, trading volumes and number of trades. Interestingly, also the distribution of U.S. firm sizes can be consistently described by a power law [110].
The appearance of phase transitions in physical systems with many interacting
el-ements leads to scaling and critical behaviour close to critical points and produce large fluctuations resulting in power law distributions; a similar analysis has shown
that this phenomenon can be linked with the dynamics of a human system with
many interacting elements (i.e. human participants in the financial market) where volatile market changes relate to the empirical power law distributions through the
general frame of phase transitions [111]. Another interesting feature is that many
dif-23 2.1. COMPUTATIONAL SOCIAL SCIENCE
ferent size of market, trends and also countries [112]. This gives insights in possible
universal phenomena that lead to these similarities.
The desire to understand market crashes, crisis and the appearance of financial
bubbles has provided another rich area of research. Evidence of speculation, for example, has been found in the 2006-2008 oil bubble when oil prices had an
incred-ible rise followed by an extreme crash [113]. Exploiting techniques from statistical
physics to analyse the oil price time series, Sornette, Woodard and Zhou were able to predict the peak of the bubble that immediately preceded the crash in July 2008.
Upward and downward trends are consequences of switching processes that appear
at different time scales [114]. Such switches at extreme values which form the end of a trend have no scale and this provides evidence that large financial bubbles are
inherent features of the scale-free behaviour of the market. Therefore information
on microbubbles can be used to study the appearance of large financial crisis. The identification of states of the market through a similarity measure has shown that
knowledge of previous states can help to forecast upcoming crises, thus allowing for
an early warning and reaction [115]. During such crises, investors rely on diver-sification to avoid large losses. This effect should protect portfolios in high stress
situations of the market and therefore a well chosen basket of stocks should have a smaller risk than each of the stock separately, under the assumption that correlation
among stocks are constant in time. However, it has recently been shown that the
av-erage correlation scales linearly with market stress, implying that the diversification effect breaks down, precisely when it is most needed [116].
2.1.6 Privacy issues
As we have just shown, the availability of large-scale datasets has had a large
im-pact on several aspects of social science research. Digital technologies have rapidly
changed the way we interact, purchase goods and communicate. The generation of high granularity data offers unprecedented opportunity for policy makers and
stakeholders alike. However, most studies presented so far rely on the availability of
the underlying datasets. Moreover, scientific research makes sharing these datasets necessary, so that studies can be reproduced and new ideas can build on previous
analysis. This poses a serious challenge to the privacy of the individuals who are
generating this information. Has the dataset been properly anonymised before it is shared? And how secure is this procedure? Individuals should not be identifiable
CHAPTER 2. BACKGROUND 24
Recent studies have shown that simple anonymisation procedures are highly
in-effective in ensuring the privacy of individuals. Typically, large datasets on our collective behaviour, such as those coming from mobile phones for instance, do not
contain information on the names, addresses or phone numbers of the users.
How-ever, our digital trajectories may be more unique than we think and the removal of those basic identifiers may not be sufficient to hide our identities. Indeed, recent
research has shown that as little as four spatio-temporal points can be enough to
identify the vast majority of mobile phone users [117]. The authors analyse sev-eral months of human mobility data for hundreds of thousands of individuals and
show that coarsening the dataset is a poor way of anonymising it. An analogous
result holds for credit card records of more than one million individuals [118]. These results lead to challenging questions about how our privacy can be protected in a
robust fashion while making these large-scale datasets available to researchers and
policy makers.
2.2
Complex networks
A powerful tool which has gained increasing importance in the last two decades is
that of networks [119–121, 28, 122–129]. Networks are ubiquitous in nature.
Com-puters are connected together through the Internet; web pages have hyperlinks that allow users to navigate from page to page; cities are connected by airports and train
stations; cells, molecules and proteins all interact via biological or chemical
reac-tions; people are linked to each other on various levels, such as kinship, friendship, and work relationship; neurons in our brain are constantly interacting with each
other to give rise to the richness of behaviour that we observe in people; scientific discoveries build on previous work, thus creating links between scientists. Network
thinking allows to develop a framework to model and understand the properties of
these systems.
Traditionally, networks are described using the mathematical language of graphs
and graph theory. Generally speaking, a graph is a set of objects, typically called nodes or vertices, in which some pairs of these objects may share a connection,
known as a link or an edge. Nodes can have attributes, such as colours or labels,
and links can have a direction. The relationship between two nodes can be binary in nature, giving rise to a so called unweighted graph, or can take values in a
spe-cific set, such as the natural or the real numbers, in which case we have a weighted
25 2.2. COMPLEX NETWORKS
structures.
Mathematically, a graph can be represented as an ordered pairG= (V, E), whereV
is the set containing the nodes, andE is a set detailing the list of connections. The
size ofV is given by the number of nodes in the graph and is usually denoted with N. Every element of E is formed by a pair of nodes contained in V; an element of
Eestablishes an adjacency relation between the corresponding nodesxand y, often
denotedx∼y. If the graphGis directed, then the order of the pair in each element ofE contains the information about the directionality of the relationship. It is often
the case that links between a node and itself are not of particular importance, but
such cases can be considered when of interest.
A path is a sequence of adjacent nodes. Paths on graphs allow to connect nodes that
are not adjacent, but are nevertheless connected through other nodes. The concept of path can be used to introduce the notion of connectedness: a graph is connected
if, for every pair of nodesiandj, there exists a path fromitoj. The most common
representation of a graph is in form of a matrixA, of size N ×N, whose elements are:
aij =
1 ifi∼j 0 otherwise
For undirected graphs, this matrix is symmetric. If links between a node and itself
are not allowed, the diagonal ofA is all zero. For weighted graphs, the analogous
definition is:
aij =
wij ifi∼j 0 otherwise
wherewij is the weight of the corresponding link.
From the adjacency matrix, we can easily introduce the degreeki of node ias the number of edges to whichiis attached:
ki =
X
j∈V aij
The complete list of degrees of all nodes inGgives rise to the degree sequence. From the degree sequence, we can then construct the degree distributionP(k) which is a
central feature of a graph. It is defined as the probability that a randomly chosen
CHAPTER 2. BACKGROUND 26
to be uncorrelated; it is correlated otherwise. The correlation can give rise to an
assortative structure, where nodes connect to other nodes of similar degrees, e.g. high degree nodes connect with high degree nodes, or to disassortative structure,
where nodes with low degree connect with those with high degree.
In a graph, clustering refers to the presence of triangles, i.e. triplets of nodes all
pairwise connected. A related definition introduces the concept of clustering
coeffi-cient, which measures the probability that two neighbours of node iare neighbours themselves. This is an important concept in social relations, where it simply
mea-sures the probability that two of my friends are friends themselves.
Moving to even larger structures, a community in a graph is a subset of nodes
in V that share many connections within the subset. Communities play an
impor-tant role in many applications, and we will explore this topic in more detail further in this chapter.
Complex networks differ from graphs in that they often display non-trivial behaviour in the topological features just presented. Networks derived from real-world data
often exhibit heterogeneous degree distributions, large clustering coefficient, assor-tative behaviour and community structure. As such, they are rather different from
traditional random graphs or regular lattices, which display a high degree of
regu-larity.
Network science tools have already been used in hundreds of studies in a range
of disciplines. Processes taking place on networks, such as random walks [130, 92], epidemic spreading [131–137] and rumour spreading [138, 139] have been thoroughly
investigated. The network framework has been applied to various contexts, such as
the emergence of social conventions [140], to understand political elections [141], the properties of the Internet [142], the social structure on Facebook [143], the
struc-ture of committees in the U.S. House of Representatives [144], and the importance
of financial institutions in the network of financial exposures between them [145]. Network representations of complex systems have been used in biology [146–148],
and in studies of technological systems [28] and communication systems [149].
Re-searchers have applied complex systems techniques to a wide range of disciplines, identifying and analyzing several defining features of complex networks, such as
the small world property [150–152], heterogeneous degree distributions [28, 127],
syn-27 2.2. COMPLEX NETWORKS
chronizability [158], and community structure [159].
In recent years, the wide availability of network data has given network scientists the
opportunity to study the relationship and dependencies between different networks.
In online social networks, for instance, where nodes represent people, users can be active on different platforms. On each platform, they will have a friendship network
which may depend on what they use that specific social media for. This gives rise to
a multilayer network, where each layer represents a different social media platform. The generalisation of this object has received extensive interest in recent years, due
to the interesting properties of processes taking place on it [160–166].
2.2.1 Communities in networks
Communities were originally studied in the context of social networks, in which they are formed by groups of people that share close friendship relations. However,
communities of densely connected modules have been observed in several real-world
and model networks of diverse nature [167–178], where, in general, they are defined as groups of nodes whose internal connections are denser or stronger than those
that link nodes belonging to different groups. In all these cases, the presence of
communities directly influences the behaviour of the system, where there is often a correspondence between communities and functional units. Ever since the discovery
of community structure in real-world networks, a plethora of techniques devoted to
their detection has been introduced [179–187]. The challenge is both theoretical, in proposing a good mathematical definition of what constitutes a community, and
computational, in developing good heuristics that can detect communities in a rea-sonable time.
A common way of investigating the community structure of networks starts with the definition of a quality function, which assigns a score to any network partition.
Larger scores correspond to better partitions, and algorithms are created to find the
partition with the largest score. By far, the most common and used of such quality functions is modularity [188], that compares the number of links inside each
com-munity to the number of links that would be expected if the nodes were connected
at random, without any preference for links within or outside the community. A partition with a large modularity indicates that the communities have many internal
CHAPTER 2. BACKGROUND 28
In its most general form, modularity can be written as follows:
Q= 1 2m
X
ij
(Aij −Pij)δ(Ci, Cj)
The sum is over all pairs of nodes, m is the overall number of links in the network, and Pij represents the number of edges that we expect to see between node i and
node j in a suitably defined randomised version of the same network. Despite the
choice ofPij being independent, it is commonly accepted that the null model should keep some of the topological properties of the original network. In particular, it is
usually the case that we want to keep the degree distribution fixed. In this scenario,
we need to calculate the probability pi to pick at random a stub, or half-edge, incident on a nodei of degreeki. From this, we can calculate the probability of an
edge linking node ito node j because an edge can only exist if two stubs incident
with iand j are linked together. Since there areki stubs attached to vertex i, and there are 2m overall stubs, the probability to pick one at random which is linked
to iis given by ki
2m. Then, the probability of having a link between the two nodes i and j is simply calculated as the product of the two, giving kikj
4m2. This leads to
the expected number of links between the two vertices of Pij = k2imkj. Using this
expression for modularity, we obtain:
Q= 1 2m
X
ij
Aij−
kikj 2m
δ(Ci, Cj)
This is the most common expression for modularity that can be found in several studies. Any partition of a network will yield a score of Q, with larger scores
indicating a stronger community structure, according to the implicit definition of
communities used to define Q. The problem of identifying network communities becomes then an optimization problem over the space of all possible partitions of
a network. An exhaustive procedure is not feasible because of the large number of possible ways of partitioning a network when both the size and the number of the
communities are not fixed. Several techniques have been developed in the literature