Online seizure onset detection for
responsive stimulation in the
sensorimotor cortex
Master thesis Technical Medicine
24 September 2019
Online seizure onset detection for
responsive stimulation in the
sensorimotor cortex
Master thesis Technical Medicine
24 September 2019
Paul L. Smits
Graduation committee
CHAIR & TECHNICAL SUPERVISOR: PROF.DR.IR.M.J.A.M. VAN PUTTEN
ACTING MEDICAL SUPERVISOR: D. VAN BLOOIJS MSC.
TECHNICAL SUPERVISOR: DR.G.J.M.HUISKAMP
PROCESS SUPERVISOR: DRS.B.J.C.C.HESSINK-SWEEP
EXTERNAL MEMBER: DR.IR.H.WORMEESTER
Medical supervision
DR.F.S.S.LEIJTEN
Summary
Background: Many patients with focal epilepsy arising from the pericentral gyri suffer from
refractory seizures. When they present for epilepsy surgery, large parts of the pericentral gyri are considered surgically unamenable without causing permanent functional deficits, due to the region’s key role in sensorimotor processing. Responsive cortical electrical stimulation (CES) may be a
promising alternative to surgery. It is unclear how much of the reported effect of responsive CES is actually due to closed-loop seizure suppression and how well these seizures are recognized by intelligent systems. Improved approaches for highly specific and fast seizure detection, validated on central lobe epilepsy (CLE) patients, are required for the development of a new generation of intelligent implantable responsive CES devices. This study aims to employ a combination of existing machine learning methods, which have demonstrated sensitive and specific real-time classification of the ictal and non-ictal electrocorticogram (ECoG), and compare the performance of the combined algorithm with a reference algorithm similar to the algorithm used in an existing responsive CES device (RNS Neuropace).
Methods: A systematic literature review was performed to establish which features and classifiers
are likely to have a high sensitivity and low false detection rate (FDR) for detecting seizure onset in ECoG. Based on the literature review, a 138-dimensional feature space, consisting of
cross-correlation features and a set of per-channel time and frequency domain features was chosen to be used in a patient-specific machine learning algorithm. Recordings of ten CLE patients, who had at least three seizures with similar onset characteristics during presurgical intracranial evaluation in the University Medical Center Utrecht, were used. Six bipolar ECoG channels were selected for each patient to represent cortical areas inside and outside the clinically identified seizure onset zone. Features were extracted from 1s epochs of ictal and interictal ECoG data. To explore the feature-space, a nonparametric test was performed to find sensitive features and rank the features by their class separability to explore the feature space. A Random Forest (RF) classifier was trained for each patient and early detection (<10s) sensitivity was obtained from seizure-level leave-one-out cross-validation. The FDR was determined using a 24h interictal test set from the same patient the classifier was trained on. As an approximation of the Neuropace detection scheme, a line-length based thresholding algorithm was used, for which same performance metrics were obtained.
Results and Conclusion: In the literature, relatively simple classifiers such as RF outperform more
complex classifiers and they have been shown suitable for low-power applications. Based on patient-specific separability rankings, the most promising feature types in the used set are line-length, gamma power, beta power, power ratio, fluctuation index, variance, time-series cross-correlation, frequency cross-correlation, and eigenvalue of the frequency cross correlation. The algorithm, consisting of the full feature space and RF classifier, demonstrates an improvement of early detection sensitivity (98% mean) and FDR (1.53/h mean) as compared to the reference algorithm, while
Contents
List of abbreviations ... 4
1. Introduction ... 5
Online electrographic seizure detection ... 6
Features and algorithms ... 6
Aims of the study ... 7
2. Literature review ... 8
2.1 Methods ... 8
Inclusion criteria ... 8
Search strategy ... 8
Exclusion criteria ... 8
2.2 Results ... 9
Datasets used for validation ... 9
Further evaluation of used features and classifiers ... 9
2.3 Discussion ... 13
Features ... 13
Classifiers ... 14
Limitations ... 14
Future perspective ... 14
3. Feature extraction and potential for seizure detection ... 15
3.1 Methods ... 15
Channel selection ... 15
Pre-processing ... 16
Features ... 17
Statistical analysis and interpretation ... 18
3.2 Results ... 19
An example patient ... 19
Aggregated results of all patients ... 21
3.3 Discussion ... 23
Limitations ... 25
Perspectives for classification ... 26
4. Classification and validation ... 27
4.1 Methods ... 27
Cross-validation ... 27
Testing dataset ... 27
Random Forest Classifier ... 28
Reference algorithm: comparison with existing neurostimulator detector ... 28
Performance indicators ... 28
4.2 Results ... 29
4.3 Discussion ... 30
Using the Random Forest classifier ... 30
Comparison with line-length algorithm ... 30
5. General discussion ... 31
Our approach ... 31
Outlook ... 32
List of abbreviations
AED antiepileptic drugs
AUC area under the curve
BIDS Brain Imaging Data Structure
BLDA Bayesian linear discriminant analysis
CART classification and regression tree
CES cortical electrical stimulation
CLE central lobe epilepsy
DFT discrete Fourier transform
DWT discrete wavelet transform
ECoG electrocorticogram/electrocortigraphy
EEG electroencephalography
FDR false detection rate
FI fluctuation index
GMM Gaussian miture models
iEEG intracranial electroencephalography
ILAE International League Against Epilepsy
MAD mean absolute deviation
NSO not (involved in) seizure onset
PSD power spectral densities
REC2Stim Rational Extra-eloquent Closed-loop Cortical Stimulation
RF random forest
RNS responsive neurostimulation (Neuropace)
ROC receiver operating characteristic
sEEG stereo electroencephalography
SO (involved in) seizure onset
SR-EMD sparse representation-based earth mover’s distance
STFT short time Fourier transform
1. Introduction
Epilepsy is a common neurological disease, with a prevalence ranging from 0.3% to 1.2%1. It is
characterised by recurrent episodes of dysfunctional brain activity associated with changes in behaviour. These episodes are called seizures, defined as “a transient occurrence of signs and/or symptoms due to an abnormal excessive or synchronous neuronal activity in the brain”2. The clinical
manifestations of seizures vary greatly, including loss of awareness and disturbances of movement and sensation3.
Despite the high number of antiepileptic drugs (AED) available, approximately one third of treated epilepsy patients remain suffering from seizures and are classified as refractory to medical
management after two failed AED trials4. For these intractable patients, other treatments are
considered, such as ketogenic diet or, in case of focal epilepsy, resective surgery and laser ablation of the epileptogenic tissue5. Before any attempt at removing cortical tissue is made, the epileptogenic
zone6 and the eloquent cortex are mapped to plan such a surgical intervention. This pre-surgical
evaluation includes seizure semiology, magnetic resonance imaging and electroencephalography (EEG) and sometimes functional magnetic resonance imaging, magnetoencephalography, ictal single-photon emission computed tomography, and intracranial EEG (iEEG) monitoring. The evaluation may indicate an epileptogenic zone overlapping with or adjacent to eloquent cortex7, such as the primary
sensorimotor cortex.
The pericentral sensorimotor cortex and its surroundings are a common location for focal cortical dysplasia, often leading to intractable epilepsy characterised by hemiclonic or tonic-clonic seizures. Localisation of the seizure focus in this cortical area is facilitated by the somatosensory symptoms usually presented in a confined body part, corresponding to a contralateral representation in the somatotopically organised central area of the cortex, and spreading semiology according to the somatotopic arrangement along the central sulcus (Jacksonian march8). Because the central gyri play
a key role in sensorimotor processing, large parts are considered to be inoperable without permanent functional deficits, especially regarding fine intended movement and motor learning.9
Electrical stimulation has been used as an alternative method to manage inoperable epilepsies, through cortical electrical stimulation (CES) directly on the epileptogenic zone or highly connected cortical areas. Short-term continuous CES has shown to be capable of reducing seizure rate10. Both
open-loop and closed-loop CES approaches have been used11. Open-loop approaches use
pre-scheduled or chronic stimulation, whereas closed-loop approaches only stimulate in response to signals of an impending or starting seizure. Closed-loop CES requires continuous brain activity monitoring using intracranial electrodes and early automated seizure onset detection to allow for responsive stimulation, in order to prevent or terminate clinical symptoms of seizures.
The RNS System by Neuropace is currently the only approved implantable responsive neuro-stimulator for cortical stimulation as a treatment for epilepsy12. Although this device has proven
efficacy both under short-term and long-term application13, it suffers from a high number of false
detections (estimated to be 25 to 83 false detections per hour14). This complicates the assessment of
Online electrographic seizure detection
Due to high variation of the EEG patterns that characterize a seizure15, the variability of background
EEG activity among patients, as well as intra-individual fluctuations in EEG activity, the challenge of automated seizure detection in the EEG has been an active field of research for over three and a half decades16. Early seizure detection poses a difficult problem as seizure onset patterns are diverse and
may closely resemble interictal epileptiform bursts that can occur frequently between seizures17.
Electrographically, seizure onset may be characterised by onset patterns such as low voltage fast activity, rhythmic sharp waves, repetitive spiking, rhythmic alpha waves, rhythmic beta waves, rhythmic theta waves or amplitude depression18. Multiple onset patterns may even occur in the
same patient. Little research has been done to characterise epileptic activity in the pericentral gyri of the brain cortex specifically. The primary motor cortex is known to microscopically differ from other neocortical areas, in that it contains strongly developed infra-granular layers19. In the EEG, the
sensorimotor areas present mu-rhythms when the body is at rest. These properties may have an impact on automated seizure onset detection in this specific cortical area.
Several signal properties at seizure onset have been identified that can be used for seizure onset detection in iEEG, or more specifically electrocortigraphy (ECoG) signals15. Fast activity was noted to
be a common pattern being observed across different pathologies, including mesial temporal atrophy and focal cortical dysplasia18. Additionally, ripples (>80Hz) are observed in many seizure-onset
patterns6,20. Oscillations in beta-gamma-ripple bands have previously been used to identify seizure
onsets in the University Medical Center Utrecht epilepsy monitoring unit for the development of a seizure alarm21. The used threshold algorithm showed a false detection rate (FDR) as high as 1/h on a
subset of patients. The algorithm was not sensitive to the seizures of three patients suffering from sensorimotor epilepsy22, which makes the algorithm unsuitable for general use in closed-loop CES
targeting the primary sensorimotor cortex.
Features and algorithms
For many other existing seizure detection algorithms, methods from the field of machine learning have been employed to classify the ictal ECoG and non-ictal ECoG in real time23. These seizure
detection algorithms consist of a feature extraction part and a classification part. In the feature extraction part, raw or pre-processed ECoG data is analysed in various ways in order to extract relevant features to pass to the classifier. In the classification part, feature values or subsets thereof are analysed and classified as being indicative of a seizure pattern or not. Detecting seizure onset patterns in the sensorimotor cortex requires comprehensive and discriminative features, to be extracted from the ECoG signal. Both linear and nonlinear features have been employed in existing detection algorithms.
Due to their simplicity and versatility, several linear features have been employed in the area of seizure detection. Examples are the variance of a signal, which represents the dynamics in the underlying ECoG, and features based on autocorrelation, exploiting the periodic nature of seizures. Alternatively, the spectral characteristics of a signal can be estimated using e.g. linear prediction filters, Fourier transform, or wavelet transform, which all can be used to detect changes in the spectral density at seizure onset. Other linear features include the (relative) fluctuation index, which relies on the assumption that there is an increased intensity of fluctuation in the ECoG signal during a
the exponential divergence of time series trajectories in the phase space, called Lyapunov exponent, characterises the ECoG’s chaotic nature has been used26. Other nonlinear measures include
information theory based entropies, which describe the irregularity, complexity or unpredictability of a signal27.
A challenge in the field of seizure detection is the lack of reproducible validated algorithms. While many seizure detection algorithms have been published28,29, few studies have been carried out to
assess the reproducibility of algorithm performance. Thus, these algorithms likely suffer from overfitting of the dataset used for development. Whereas reviews of features for seizure detection are available30, and the selection of features for online seizure detection in scalp EEG has been
thoroughly addressed by Logesparan et al.28, there is no exhaustive overview of promising features
applicable to intracranial recordings, let alone to online ECoG on the sensorimotor cortex specifically.
Aims of the study
In this study, we develop an algorithm that can detect different seizure onset patterns in the ECoG, relevant for implementation in closed-loop CES on the sensorimotor cortex. We employ methods from other studies that have demonstrated a highly sensitive and specific classification of ictal and non-ictal iEEG in real-time. The steps of the project are threefold:
Chapter 2: A systematic literature review is performed to establish which algorithms are likely to have a high sensitivity and low FDR for detecting seizure onset in ECoG.
Chapter 3: Based on the literature review, features from the most promising algorithms for the purpose of detecting seizure onset in ECoG are combined to build a detection algorithm that can be implemented in closed-loop CES. The characteristics of the selected features are evaluated on clinical data.
2. Literature review
The literature review aims at comparing existing seizure detection algorithms for ECoG data. To possibly achieve true closed-loop suppression in responsive CES implants, highly specific and fast seizure detection approaches are required. This review sought to establish which algorithms may have a high sensitivity and low FDR in detecting seizure onset. The following review questions were addressed:
Which features extracted from the ECoG data are most likely to distinguish between seizure onset and background activity, i.e. by showcasing the best sensitivity and FDR, in a
convincing sample (i.e. benchmarking set or at least >10 patients, >80 seizures, >100 hours)?
Which classifiers are used to classify the ECoG signal?
2.1 Methods
Inclusion criteria
1. Seizure detection/prediction algorithm was designed especially for ECoG data (i.e. iEEG using cortical electrodes, e.g. grid or strip).
2. Involving an algorithm that is able to automatically detect seizure onset
3. Either on-line early detection or short-term (<1min) prediction was the aim of the algorithm 4. Studies that verified the used algorithm in (human) clinical data
5. Publication 2009-2018
6. Language of publication: English
Exclusion criteria
1. Exclude delineation-, mapping-, localization-only studies
2. Exclude exclusive depth electrode based detection (i.e. stereo EEG; sEEG)
3. Exclude exclusive scalp EEG, thalamic or hippocampal based detection
4. Exclude high-density grid based detection 5. Exclude focus on high-frequency oscillations 6. Exclude non-human only experiments
Articles were chosen based on the inclusion and exclusion criteria. Additional articles were chosen from the reference lists of already included publications if they were published since 2009. In addition to the mentioned inclusion and exclusion criteria, all articles aiming at the prediction of seizures more than 1 minute before the seizure onset were excluded.
The used validation methodology and the obtained performance results were analysed. Articles that
validated an existing algorithm on a broader dataset, selected validation subjects to represent different seizure onset patterns, or showcased the best performance using a complete benchmarking set were further evaluated.
Search strategy
In PubMed:
(electrocorticogra*[Title/Abstract] OR ECoG[Title/Abstract] OR “intracranial EEG”[Title/Abstract] OR
iEEG[Title/Abstract] OR intracranial electroencephalograph*[Title/Abstract]) AND
(automat*[Title] OR predict*[Title] OR detector[Title] OR detection[Title]) AND
(seizure[Title] OR ictal[Title] OR epilep*[Title])
NOT
(delineat*[Title] OR map*[Title] OR localiz*[Title] OR outcome[Title]) AND
2.2 Results
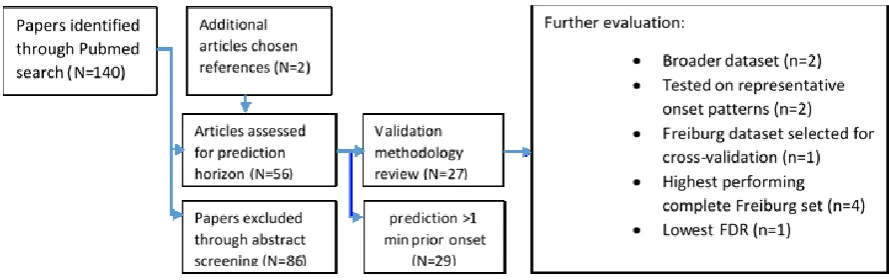
[image:11.595.75.520.415.555.2]The search in PubMed resulted in 140 articles. After reading titles and abstracts, 56 articles remained which seemed to meet all initial inclusion criteria. After closer inspection of the methodology, subjects and performance indicators used, and after reducing the set of articles by excluding the articles aiming to predict seizures more than 1 minute before onset, 27 articles remained for review (Figure 1).
These studies varied greatly in their detection algorithms, as well as the subjects used for validation. Performance indicators of interest were either a combination of sensitivity of seizure events, detection delay, and FDR per hour, or a standardised area under the curve (AUC) for early (<10 s) detection. To establish whether the algorithms are properly validated, the validation methodologies were first analysed before proceeding to evaluation of the used features.
Datasets used for validation
In the reviewed literature, a variety of datasets was used to validate the algorithms. A recurring (13 articles) benchmarking set of subjects is the University of Freiburg’s data pool31,32 comprising of over
600 hours of iEEG data and 88 seizures from 21 patients. Later studies (4 articles) made a selection of subjects from the successor of the Freiburg dataset, the European Epilepsy Database33. Several
publications (4 articles) used the dataset from the University of Pennsylvania and Mayo Clinic's Seizure Detection Challenge34, consisting of iEEG recordings obtained from 4 dogs with naturally
occurring epilepsy and 8 patients with temporal and extra-temporal lobe epilepsy. One paper used data from the iEEG portal35; others from their own respective Epilepsy centres (3 articles), or had not
specified the origin of the used clinical iEEG data (3 articles). No study validated exclusively on patients with focal epilepsy in the sensorimotor cortex.
Figure 1| Review flow chart
Further evaluation of used features and classifiers
The features from two studies that validated an algorithm on a broader dataset36,37, and two studies
that selected subjects to represent different seizure onset patterns14,38, were further evaluated.
Additionally, from the studies that used the Freiburg dataset, the features of the study that applied cross validation with three seizures per subject39, as well as those that included all subjects and had
an outstanding performance (i.e. sensitivity > 93% average FDR < 0.25/h) in their validation were further evaluated. Other studies that used a small sample (n<10) of patients without accounting for the selection of these patients were not further evaluated. In total, further evaluation was
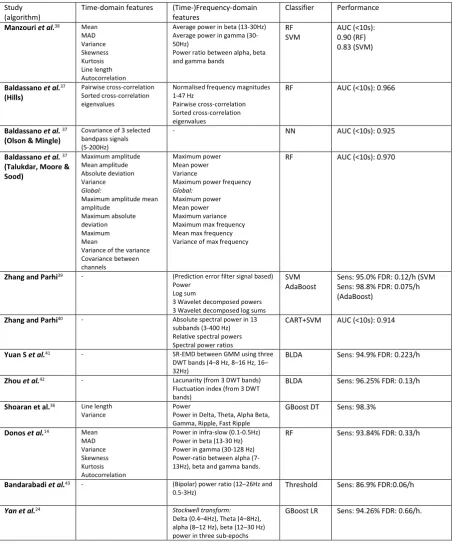
Table 1 | Overview of analysed studies and algorithms
Entire separate algorithms in the same study are shown in their own row (2-4). Some studies employed multiple classifiers on the same feature space. RF: Random Forrest, SVM: Support Vector Machine, NN=Neural Network, CART: Classification and Regression Tree, AdaBoost: Adaptive Boosting, BLDA: Bayesian Linear Discriminant Analysis, GBoost: Gradient Boosted, DT Decision Trees, LR: Logistic regression. AUC (<10s): Area under the curve for early seizure detection (within 10 seconds from seizure onset), FDR: False detection rate, DWT: Discrete wavelet transform, GMM: Gaussian mixture models, SR-EMD: sparse representation-based Earth Mover’s Distance. MAD: Mean absolute deviation.
Study (algorithm)
Time-domain features (Time-)Frequency-domain features
Classifier Performance
Manzouri et al.38 Mean MAD Variance Skewness Kurtosis Line length Autocorrelation
Average power in beta (13-30Hz) Average power in gamma (30-50Hz)
Power ratio between alpha, beta and gamma bands
RF SVM
AUC (<10s): 0.90 (RF) 0.83 (SVM)
Baldassano et al.37 (Hills)
Pairwise cross-correlation Sorted cross-correlation eigenvalues
Normalised frequency magnitudes 1-47 Hz
Pairwise cross-correlation Sorted cross-correlation eigenvalues
RF AUC (<10s): 0.966
Baldassano et al. 37 (Olson & Mingle)
Covariance of 3 selected bandpass signals (5-200Hz)
- NN AUC (<10s): 0.925
Baldassano et al. 37 (Talukdar, Moore & Sood) Maximum amplitude Mean amplitude Absolute deviation Variance Global:
Maximum amplitude mean amplitude
Maximum absolute deviation Maximum Mean
Variance of the variance Covariance between channels
Maximum power Mean power Variance
Maximum power frequency
Global:
Maximum power Mean power Maximum variance Maximum max frequency Mean max frequency Variance of max frequency
RF AUC (<10s): 0.970
Zhang and Parhi39 - (Prediction error filter signal based) Power
Log sum
3 Wavelet decomposed powers 3 Wavelet decomposed log sums
SVM AdaBoost
Sens: 95.0% FDR: 0.12/h (SVM Sens: 98.8% FDR: 0.075/h (AdaBoost)
Zhang and Parhi40 - Absolute spectral power in 13 subbands (3-400 Hz) Relative spectral powers Spectral power ratios
CART+SVM AUC (<10s): 0.914
Yuan S et al.41 - SR-EMD between GMM using three DWT bands (4–8 Hz, 8–16 Hz, 16– 32Hz)
BLDA Sens: 94.9% FDR: 0.223/h
Zhou et al.42 - Lacunarity (from 3 DWT bands) Fluctuation index (from 3 DWT bands)
BLDA Sens: 96.25% FDR: 0.13/h
Shoaran et al.36 Line length Variance
Power
Power in Delta, Theta, Alpha Beta, Gamma, Ripple, Fast Ripple
GBoost DT Sens: 98.3%
Donos et al.14 Mean MAD Variance Skewness Kurtosis Autocorrelation
Power in infra-slow (0.1-0.5Hz) Power in beta (13-30 Hz) Power in gamma (30-128 Hz) Power-ratio between alpha (7-13Hz), beta and gamma bands.
RF Sens: 93.84% FDR: 0.33/h
Bandarabadi et al.43 - (Bipolar) power ratio (12–26Hz and 0.5-3Hz)
Threshold Sens: 86.9% FDR:0.06/h
Yan et al.24 Stockwell transform:
Delta (0.4–4Hz), Theta (4–8Hz), alpha (8–12 Hz), beta (12–30 Hz) power in three sub-epochs
Feature sets
The simplest feature set included only power bands (delta-beta)24. It was designed to evaluate
4s-epochs, deriving the power band features from three sub-epochs. This epoch length causes a
minimum delay of 4 seconds. Another simple feature set only uses a power ratio (12–26Hz divided by 0.5–3Hz) in bipolar channels43. Bipolar signal are considered to be a measure for neuronal potential
similarity, as contains information of both amplitude similarity and phase synchrony between brain regions, which is typical for ictal activity.
Donos et al.14 applied a simple seizure detection algorithm meant for closed-loop CES. In their
system, eleven features from the time and frequency domains are computed for each monopolar (average re-referenced) iEEG channel, i.e. mean, mean absolute deviation (MAD), variance, skewness, kurtosis, autocorrelation, line length, power in infra-slow frequency band (0.1– 0.5Hz), beta (13–30Hz) and gamma (30–128Hz) bands and a power-ratio between the alpha (7–13Hz), beta and gamma bands. In their recent comparison of two classifiers, Manzouri et al.38 used ten of these
time and frequency domain features, selected based on a reasonable computational demand. They found that the complex calculations for autocorrelation had a relatively large impact on runtime. In feature importance studies by Shoaran et al.36, Iine-length and a patient-specific single spectral
power turned out to be dominant features in their algorithm.
Zhang and Parhi 39 extracted features using a two-level wavelet decomposition. Three disjoint
sub-bands are decomposed and each total power is used as a feature, as well as the logarithm of the product of the absolute values of each. Later they used a feature reduction algorithm (CART) to automatically reduce the amount of spectral features to 3 or 4 features to achieve early seizure detection40. Non-linear approaches from the field of Brain Computer Interfaces were used in two
feature sets, both based on three discrete wavelet transform (DWT) bands (4–8 Hz, 8–16 Hz, 16– 32Hz)41,42.
When using multiple channels, the use of global features may provide additional information to the classifier. Pairwise cross-correlations and sorted eigenvalues in both time- and frequency (1-47 Hz) domain, was shown to be quite effective to classify 1-s segments (early AUC 0.967)37. Other
covariance or cross-correlation based algorithms confirmed the high performance when using these global features (early AUC 0.970)37.
Choice of classifier
A Random Forest (RF) classifier, or other ensemble classifier was used by eight of the evaluated algorithms14,24,36–39. It is considered to be of particular interest for early seizure detection in
closed-loop CES, because of its relative resistance to overtraining, ability to efficiently work with large data sets, no need for normalization of features, few required parameter optimizations and the evaluation of features’ importance by measuring the mean decrease in the Gini index44. The Gini index is a
measure of how often a randomly chosen element from the set would be incorrectly labelled, if it was randomly labelled in accordance with the distribution of labels in the subset. Overall high performances were achieved in diverse seizure onset patterns. With delay optimisation, a delay of 3s was achievable with 93.84% mean sensitivity and 0.33/h FDR14.
In two studies.42,45, Bayesian linear discriminant analysis (BLDA) was used to classify 4-s epochs from three channels and achieved sensitivity of 96.25% and a FDR of 0.13/h with a mean delay time of 13.8s. The system performed less well when using shorter epochs41.
A Support Vector Machine (SVM) classifier was used by three of the evaluated algorithms38–40. In
power hardware implementation. However, when they compared the performance of an SVM to a simpler AdaBoost classifier, they showed that the AdaBoost performed better on their data (sensitivity 98.75; FDR 0.075/h).
Comparing the RF and SVM classifier, Manzouri et al.38 found that the RF performed best in real-time
2.3 Discussion
The methodologies used in the reviewed articles had a rather wide variety in source data, evaluation criteria, and validation and testing sets.
The selection of patients may affect the performance of a used algorithm. For example, whereas a lot of studies used the Freiburg dataset, it is unclear why some had to exclude patients due to
artefacts24,46, onset pattern47, or seizure duration48, while other studies included all. Including only
patients with three or more seizures to allow for cross-validation39 constitutes a loss in comparability
to other studies, but does add to the meaningfulness of performance measures (cross-validation sensitivity). Another example from studies using the European Epilepsy database, two studies selected subjects randomly43,49, with the only condition being a high sampling rate (1024Hz), while
other studies14,38 selected 10 patients a priori with a representative variety of seizure onset patterns.
The latter does add to the representativeness and thus their performance gives a stronger indication of the applicability in CES. Two publications36,37 applied entries from the UPenn and Mayo Clinic's
Seizure Detection Challenge to a wider dataset for validation, actually giving insights in the applicability of some high-performing algorithms.
Performance measures used in literature vary. Some articles report epoch-based sensitivity and specificity rates, which do not translate directly to detector performance in a clinical application. Epoch-based specificity may even lead to over-optimistic results, as rates over 95% may still falsely indicate hundreds of seizures per hour. Alternatively, FDR per day or per hour are often counted, which give a meaningful number related to the selectivity of the system and the amount of
potentially unnecessary interventions. For sensitivity, most studies agree that a correct detection of a seizure occurs if the detector alerts a seizure once during the seizure, but in some studies also
detections a few seconds before the marked onset are counted as true positives. Algorithms which contain adjustable thresholds or other parameters allow for a meaningful description of their
performance via receiver operating characteristic (ROC) curves. The trade-off between sensitivity and FDR in that case can be represented by the AUC, which facilitates comparison between different studies.
It is likely that for CES to be successful, interventions are to be performed early during an
electrographic seizure. Therefore, the detection delay between the visually annotated seizure onset and the first detection is used as a third performance measure, although often omitted. In a few cases, the delay was reduced by using a collar technique in post-processing24,41,42, which does not
apply to real-time applications of seizure detection. Instead of the detection delay, accuracy measures for the detection in the first ten seconds are sometimes presented37,38,40. This simplifies optimisation and facilitates the comparison of algorithm performances. The underlying assumption that the seizure does not manifest clinically within the first 10 seconds after electrographic onset, is questionable though, as the clinical onset may ensue within a shorter timespan.
Features
In several studies, a combination of features in the time and frequency domains was effective for achieving high sensitivities. Line-length and a patient-specific single spectral power have been shown to be dominant features in algorithms that focussed on linear features. Alternatively, a combination of spectral power features and power ratios has the potential to perform well with only few features.
Autocorrelation, cross-correlation, covariance between channels and other global features may improve performance, as these can utilise the repetitive and synchronising nature of seizures and were used in the best performing algorithms of the Mayo Clinic challenge37. Bipolar signals contain
alternative signal to extract features, and has been shown to perform well on a single monopolar channel. Promising non-linear features from the field of brain-computer interfaces may provide additional information on the underlying state of the brain, yet they are not widely used in machine-learning approaches. Features such as lacunarity42 may contribute to detection performance and are
supposed to have low computational demand.
Features derived from the time domain signal do not require any additional processing and it has been shown that pre-processing techniques such as Fourier transform or wavelet transform can be implemented in low-power dedicated circuits28. The Stockwell transform, i.e. a combination of Short
Time Fourier Transform(STFT) and Wavelet Transform, is expected to require more complex computations. It may have better performance as it retains phase information of the signal24.
Classifiers
The evaluated papers demonstrated that relatively simple classifiers, e.g. RF or boosted ensembles, outperform more complex classifiers, e.g. neural networks or SVM, and are suitable for low-power applications. The RF is an ensemble learning method for classification that constructs a group of decision trees consisting of binary decisions in which each tree is trained on a subset of the training data and a subset of features. When performing the classification, each individual tree assigns a label, after which the final label is given by majority of the trees. It combines the bagging technique with random feature selection, which allows for out-of-bag error evaluation and performance calibration50. The RF classifier has a relative resistance to overtraining, an ability to efficiently work
with large data sets, no need for normalisation of features, and it allows for the evaluation of features’ importance by measuring the mean decrease in the Gini index.
Limitations
The performance indicators of the evaluated papers cannot be directly compared, because of different datasets used in the different studies. Even for studies that used the same dataset for validation, the calculation of performance indicators heavily depends on pre- and post-processing steps and experiment setup, complicating a direct comparison of performance. Mentioned delay times are not comparable, and sometimes even irrelevant for on-line detection applications if a collar technique was employed (e.g. 42). Furthermore, we cannot assume the used datasets can adequately
represent the population of sensorimotor epilepsy patients in an everyday setting. Hence, it is not safe to make a generalized assumption about the performance of the evaluated algorithms and their features. However, the outcomes provide a clear lead as to which features are most likely to
distinguish between seizure onset and background activity.
Despite the intrinsic difficulties, this review aims to introduce and foster the understanding of available methods in the area of real-time seizure detection. Its contribution is towards developing a seizure onset detection system balancing computational complexity and accuracy for responsive treatment, such as CES.
Future perspective
3. Feature extraction and potential for seizure detection
The goal of this study is to provide a seizure detector that is suitable for online responsive intervention, such as CES, at the early stages of a seizure. Based on the literature review, a
combination of time and frequency domain features is used which can be implemented in a detector using a machine learning classifier. In this chapter, the features are extracted from interictal and ictal ECoG segments to analyse their properties and potential for detecting seizures.
3.1 Methods
Before applying the features in a classifier, their behaviour is studied on a sample of 10 patients (Table 2) with sensorimotor epilepsy. All patients underwent presurgical evaluation at the University Medical Center Utrecht epilepsy monitoring unit between 2012 and 2018, using implanted cortical electrodes. ECoG was recorded for a period of 5-7 days and included in the ‘RESPect’ research database with approval of the local medical ethics committee. To allow for cross-validation of a classifier later (described in chapter 4), only patients who presented at least three seizures of the same type during the intracranial monitoring period, are included.
The ECoG-data were obtained using the Micromed EEG system at a sampling rate of 512 or 2048 Hz. The signal was filtered in the recording system with a 0.15 Hz high-pass filter and anti-aliasing low-pass filter at 117 or 468Hz, respectively. For faster and eventually more energy efficient
computation, the recordings are down-sampled to 512 Hz during pre-processing. The data was processed with Matlab (Matlab R2018a, Mathworks Inc. MA, USA), using the open source Fieldtrip MEG/EEG analysis toolbox51 for pre-processing as described below.
Channel selection
The ECoG was manually annotated to identify seizure onset and artefacts, by visual inspection. The annotated data was converted to Brain Imaging Data Structure (BIDS)52. To limit computational
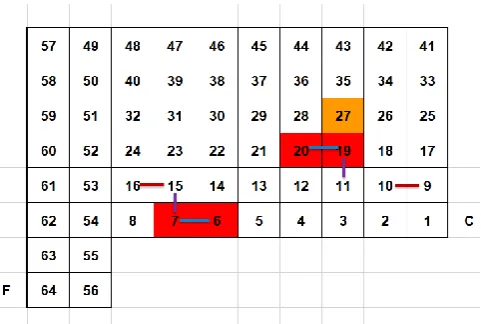
[image:17.595.177.418.546.708.2]demand, and respect realistic constraints of an invasive neurostimulator, six bipolar channels are selected for each patient. The bipolar channels are chosen to include different behaviours in ictal activity: for each patient two electrode pairs involved in the seizure onset (SO-SO) are included, along with two electrode pairs not involved in seizure onset (NSO-NSO) and two electrode pairs of which each has one electrode involved in seizure onset and the other electrode not (SO-NSO). In choosing electrode positions, we did not discriminate between underlying motor- or somatosensory cortical area. The bipolar electrode selection is illustrated for one patient in Figure 2.
Figure 2| Schematic representation of implanted ECoG grids and channel selection for patient RESP0295. Shown are
Pre-processing
Selected channels are digitally re-referenced to apply the specific bipolar montage. Data with a sampling frequency of 2048Hz was resampled to 512 Hz. Data quality is improved with a 6th order
digital bidirectional Butterworth filter with a high-pass frequency of 0.5 Hz. Power-line noise is removed using a discrete Fourier transform (DFT) filter. The DFT filter fits a sine and cosine at interference frequencies (50Hz, 100Hz, 150Hz) to the signal, after which the estimated interference components are subtracted from the data.
[image:18.595.120.475.250.401.2]The six filtered bipolar channels are subsequently segmented into 1s non-overlapping epochs. Epochs with prior visually annotated artefacts are removed. No epochs were removed during seizures. Additional information on the activity the patient is performing is included for later use (Chapter 4). The pre-processing pipeline is shown in Figure 3.
Figure 3| Pre-processing steps. Acquired data is annotated and converted to Brain Imaging Data Structure. From this
structure, bipolar channels are selected, downsampled to 512Hz, filtered with a high-pass filter and DFT band-stop filter, segmented into 1s epochs and cleared from prior visually annotated artifacts. Addittional activity labels are attached to
the segments to facilitate the compilation of learning and testing sets later on (chapter 4).
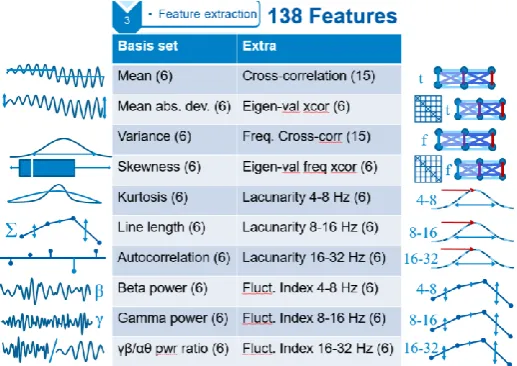
Figure 4|Overview of used feature set. Basis set is inspired by Manzouri et al.38, Extra features include global features
[image:18.595.169.428.480.663.2]Features
Based on the literature review (chapter 2), the following features are selected: Mean, MAD, variance, skewness, kurtosis, line length, autocorrelation, average power in beta and gamma range, as well as power ratio between higher (beta, gamma) and lower (alpha, theta) ranges. In addition, cross-correlation features are included to utilise synchronising nature of seizures, and the added value of lacunarity and fluctuation index is assessed by including them in the feature set (Figure 4) as well. The used features are described in detail below.
Simple (statistical) features
The four statistical moments, i.e. mean, variance, skewness and kurtosis, provide information on the location (mean), variability (variance) and shape (skewness, kurtosis) of the amplitude distribution of a time series53. MAD is used as another
measure of statistical dispersion of the time series, more suitable for non-normally distributed data54. These statistical features are calculated for every epoch in each
bipolar ECoG channel.
Line length feature
Line-length is a signal feature defined as the sum of distances between successive points within a certain window55. As such, it represents the total length of the ECoG
curve within a given epoch of length N:
𝐿 = ∑ 𝑎𝑏𝑠[𝑋𝑡−1− 𝑋𝑡]
𝑁
𝑖=1
(1)
The line-length increases, both when the data sequence magnitude or frequency increases. It is computed for every epoch in each channel.
Autocorrelation feature
For each epoch the autocorrelation was computed using the following definition:
𝑅(𝜏) =𝐸[( 𝑋𝑡− µ) × (𝑋𝑡+𝜏 − µ)]
σ2 (2)
where E is the expected value operator, Xt is the signal at the t time moment, µ is the mean of the signal in the 1-s epoch, σ2 is the variance of the signal, and τ is the time lag.
The lowest value of the autocorrelation coefficient during each 1s epoch was used. The assumption is that when the seizure starts, the seizure onset pattern is rather different from the baseline ECoG, and therefore low autocorrelation coefficients are expected14.
Band powers and ratio
Band powers are estimated power spectral densities (PSD) in the beta (12.5-30Hz) and gamma (30-80Hz) band. In addition to absolute spectral densities in these bands, the ratio between the sum of the power in the gamma and beta band divided by the sum of the power in the alpha and theta bands (3.5-12-5Hz) is computed. This power ratio corresponds to the first step of the computation of the epileptogenicity index6, and has been suggested to be sensitive for low voltage fast
Cross-correlation features
Cross-correlation features were based on the winning submission in the Seizure Detection Challenge by Michael Hills56. In the time domain, time series data is
normalised for every epoch. Correlation coefficients between ECoG channels and the sorted complex magnitudes of eigenvalues in the time domain are used as features.
To obtain correlation coefficients between ECoG channels and their eigenvalues in the frequency domain, power in 1-Hz frequency buckets in the range of 1-47Hz per segment is normalised for every frequency bucket (i.e. all buckets for each
channel). From the normalised data, a correlation matrix is obtained. The (upper right) correlation values are used as features, as well as the sorted complex magnitudes of the eigenvalues.
By sorting the eigenvalue features, they form a so-called spectrum of the correlation matrices.
Lacunarity
Lacunarity features are computed by first applying a DWT to split the signal in three frequency domains. DWT employs long time windows for more precise low
frequency information, and short time intervals for high frequency information. A Daubechies 4 wavelet is used, as it is considered appropriate to detect changes in ECoG signals42. The number of decomposition levels is chosen to be six. With a
sampling frequency of 512Hz, this decomposition yields the relevant detail coefficients (d) representing 16–32 Hz (d4), 8–16 Hz (d5), and 4–8 Hz (d6). Lacunarity represents the gaps or ‘lacunae’ present in a given surface. In our application, it is based on the DWT detail coefficients shifted to positive values, and subsequently calculating the first (M1) and second (M2) order moments of mass. Lacunarity(Λ) then follows as described by Zhou et al.42:
𝛬 =𝑀2− 𝑀1
2
𝑀12
(3)
Fluctuation index
The fluctuation index features use the same detail coefficients from DWT as used for lacunarity. The fluctuation index can be considered to be similar to the line length feature in a specific frequency domain, normalised for the amount of DWT coefficients in a certain scale (Nd4, Nd5, Nd6). For example, the fluctuation index in d4, representing fluctuations in the 16-32 Hz band, is calculated as follows42:
𝐹𝐼(𝑑4) = 1
𝑁𝑑4
∑ 𝑎𝑏𝑠[𝑑4𝑡−1− 𝑑4𝑡]
𝑁𝑑4
𝑖=1
(4)
Statistical analysis and interpretation
3.2 Results
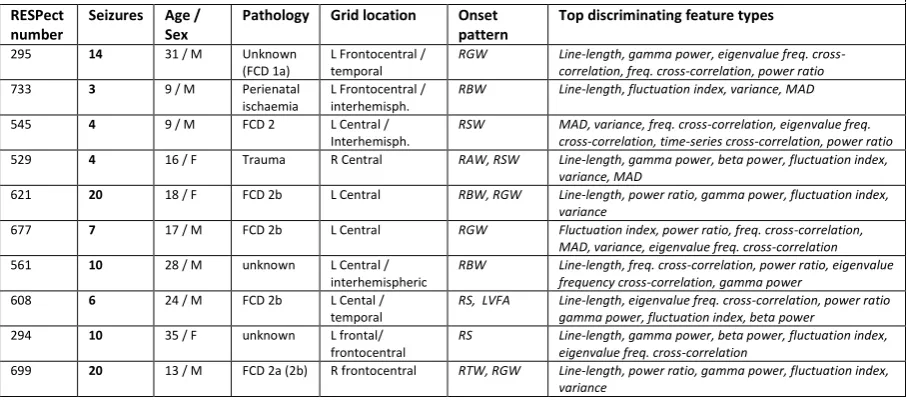
[image:21.595.71.525.241.442.2]A total of 98 seizures was analysed, with a median of 8.5 seizures per patient (range 3-20, Table 2). In the separability ranking, the highest ranking features were different for each patient. Based on the top 15 features for each patient, the feature types with the highest standardised U-statistics were variance, MAD, line-length, gamma power, beta power, power ratio, fluctuation index, time-series cross-correlation, frequency cross-correlation, and eigenvalue of the frequency cross correlation. The feature types ranking among the top 15 for each patient can be found in Table 2.
Table 2| Overview of analysed patients and top performing feature types
Up to 20 seizures were included in the analysis per patient. RESPect numbers are references for the ‘RESPect’ research database entries of the University Medical Center Utrecht epilepsy research group. FCD: Focal cortical dysplasia (ILAE classification provided if known). RAW: rhythmic alpha waves; RBW: rhythmic beta waves; RBW: rhythmic beta waves; RGW: rhythmic gamma waves; RTW: rhythmic theta waves; RS: repetitive spiking; RSW: rhythmic sharp waves; LVFA: low-voltage fast activity
RESPect number
Seizures Age / Sex
Pathology Grid location Onset pattern
Top discriminating feature types
295 14 31 / M Unknown (FCD 1a)
L Frontocentral / temporal
RGW Line-length, gamma power, eigenvalue freq. cross-correlation, freq. cross-cross-correlation, power ratio
733 3 9 / M Perienatal ischaemia
L Frontocentral / interhemisph.
RBW Line-length, fluctuation index, variance, MAD
545 4 9 / M FCD 2 L Central / Interhemisph.
RSW MAD, variance, freq. cross-correlation, eigenvalue freq. cross-correlation, time-series cross-correlation, power ratio
529 4 16 / F Trauma R Central RAW, RSW Line-length, gamma power, beta power, fluctuation index, variance, MAD
621 20 18 / F FCD 2b L Central RBW, RGW Line-length, power ratio, gamma power, fluctuation index, variance
677 7 17 / M FCD 2b L Central RGW Fluctuation index, power ratio, freq. cross-correlation, MAD, variance, eigenvalue freq. cross-correlation
561 10 28 / M unknown L Central / interhemispheric
RBW Line-length, freq. cross-correlation, power ratio, eigenvalue frequency cross-correlation, gamma power
608 6 24 / M FCD 2b L Cental / temporal
RS, LVFA Line-length, eigenvalue freq. cross-correlation, power ratio gamma power, fluctuation index, beta power
294 10 35 / F unknown L frontal/ frontocentral
RS Line-length, gamma power, beta power, fluctuation index, eigenvalue freq. cross-correlation
699 20 13 / M FCD 2a (2b) R frontocentral RTW, RGW Line-length, power ratio, gamma power, fluctuation index, variance
An example patient
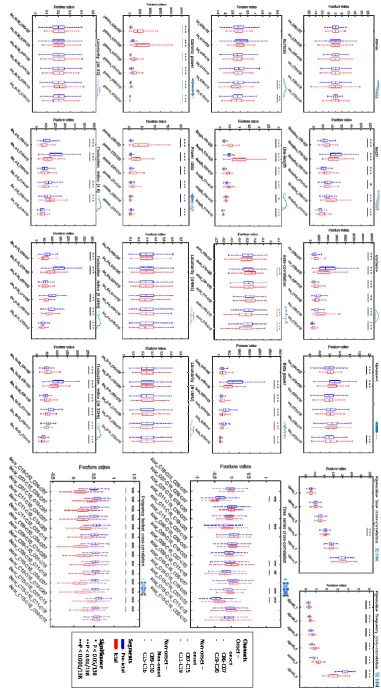
For the example patient 295, the mean and all lacunarity features showed no significant differences between the pre-ictal and interictal epochs sets. MAD and variance show co-varying significant increases and decreases of the median values in all channels. Kurtosis shows a significant decrease in channels not involved in seizure onset (NSO-NSO), whereas skewness shows a significant change in channels involved in seizure onset (SO-SO). The line-length feature has a significant increase in all six channels. Autocorrelation shows a significant decrease in NSO-NSO channels, and an increase in one SO-SO channel. Gamma power and Power rate are significant in all channels and show the highest increase in SO-SO channels. Beta power mostly has a significant decrease, although it increases in one SO-SO channel. Fluctuation index decreases in most of the channels in all three bands, while in the higher band (16-32Hz) one SO-SO channel shows a significant increase.
Aggregated results of all patients
When compiling all the results of the 10 patients (Figure 6), we see that the insignificance of the mean feature is universal for all patients. Lacunarity, however, does show significant changes in seven patients. The detail coefficient representing the 4-8Hz band only has significant lacunarity changes in one patient (608). The lacunarity of detail coefficients representing 8-16Hz and 16-32 Hz change significantly for six and seven patients respectively.
MAD and variance features co-varied in all patients, i.e. they show the same significant increases and decreases across all channels in both features. For one patient (677), there was only one channel in which the variance and MAD changed significantly. Kurtosis and Skewness were not significant for this patient. The autocorrelation feature decreased significantly in both NSO-SO channels for four patients (295,561,294,699). For one patient (529), autocorrelation increases in all channels except one NSO-SO channel.
The fluctuation index is significantly increased across all bands in at least one channel of each type for three patients (733,529,608). It also shows significant decreasing values across all types of channels and bands for the seven other patients, along with some significant increases, predominantly in the higher frequency band.
Line-length increased significantly in all channels for seven patients, and in a majority of the channels for the other three (545,529,621). For one patient (545), it did not increase significantly in both the SO-SO channels, but it did increase in the other channel types. Gamma power did also not increase significantly in patient 545’s SO-SO channels, nor did it increase in the SO-SO and NSO-SO channels of patient 677. Otherwise, it showed a general significant increase among the channels, except for one NSO-NSO channel in patient 621, in which it actually decreases. Beta power shows general increase for two patients (733,608), but there are channels with a significant decrease for four patients (295,621,677,699). In patient 677 this significant decrease occurred in both of the SO-SO channels. Power ratio increased significantly in all SO-SO for all patients and all other channels for five patients (733,677,561,608,294). A significant decrease occurred for two patients (295,699) in SO-NSO
channels, and in a NSO-NSO channel for patient 621.
Among the global features, the time-series cross-correlation between both SO-SO channels was significantly increased for two (677,608), and decreased for four patients (545,529,561,294). Between different types of channels, both significant increases and decreases occur. One patient (621) has no significant change in cross-correlation, except for one SO-SO/SO-NSO correlation. Cross-correlation eigenvalues showed no significant changes for two patients (621,699). The highest sorted eigenvalue was significantly decreased for four patients (733,677,561,294), whereas it was
significantly increased for two (545,529).
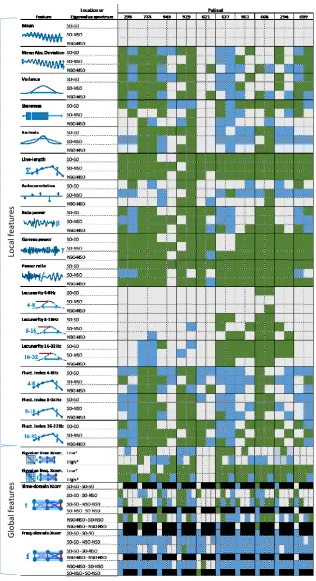
Figure 6 |Overview of significant (P < 0.01/138) changes in feature levels. Green represents a significant increase of the feature, blue a significant decrease of the feature value, grey represents no significant change. The 16 local features
types are extracted from six bipolar channels for each patient. Local feature channels are grouped in rows by their location’s involvement in seizure onset (SO-SO, NSO-NSO, NSO-SO). MAD and variance show the same behaviour in all channels. Line-length, gamma power, power ratio and show relative consistent increases in most channels. For global
Lo
cal fe
atu
re
s
G
lo
b
al fe
atu
re
3.3 Discussion
In this chapter, we described the seizure extraction method and compared the feature values from the interictal and ictal ECoG epoch sets to analyse the features’ properties and potential for detecting seizures. The general idea is that feature values that change significantly during seizures, and more specifically during seizure onset, will be useful in discriminating between interictal and ictal segments by our classifier later on. For all features that show significant differences between the ictal and pre-ictal epochs, it is important to realise that this does not directly translate to predictive power of the features. As the primary focus is on the behaviour and discriminative power of the features, each feature type is shortly discussed below.
Simple (statistical) features
None of the mean features was ever significant. This can be attributed to the used AC amplifier and pre-processing steps, such as the bipolar montage. As it is never
significant, it is unlikely to be of any added value in a classifier.
The similar behaviour of variance and MAD could be expected, as both are measures of dispersion of the time series. Variance and MAD increased during seizures in several channels, which represents the volatile nature of the ictal ECoG. However, in several channels these dispersion measures actually decreased. Although this might be due to low-amplitude characteristics of certain seizure onset types, it is more likely caused by the bipolar montage. Using bipolar channels cancels out synchronous activity with similar amplitudes in certain electrode combination. This accounts for some of the decreased variance levels.
For skewness, it is actually not relevant to consider increases distinct from decreases, as this simply depends on the polarity of the montage. Although skewness and kurtosis were never in the top 15 features, they do seem to provide information in some channels on the shape of the distribution that may contribute to the discrimination between ictal and non-ictal epochs. Most notably, skewness was differed significantly in all SO-SO channels, except for one patient (621).
Line length feature
Line-length is expected to increase, both when the data sequence magnitude and/or frequency increase. The general increase of the line-length in most channels indicates it is a strong candidate for classification. The increase was not expected in channels selected to not be involved in seizure onset (NSO-NSO), but it appears the gamma power increase in those channels is strong enough within the first 20 seconds of electrographic onset. Line-length features scored consistently among the top 15 features, and are expected to give an important contribution to classifier performance. Channels where line-length did not work well, such as the SO-SO channels of patient 545, had a lot of interictal spiking in the onset channels. As such, line-length is less capable of discriminating between ictal an non-ictal epochs.
Autocorrelation feature
The autocorrelation feature is among the hardest to interpret. As it is based on the assumption that the seizure onset pattern is different from the baseline ECoG14, it is
Band powers and ratio
All frequency band power features generally showed a convincing increase. It is likely that higher frequencies were relatively unaffected by the bipolar montage, as lower frequencies are more likely to achieve phase synchrony during seizures. It was
suggested that the combination of bipolar channels and power ratio could adequately discriminate between ictal and non-ictal epochs based on amplitude similarity and phase synchrony43.
The extracted features used pre-defined frequency bandwidths to compute band power. It is possible that for some patients band power features would perform even better if the bandwidths were adjusted to their seizure type. Still, many features based on these fixed bands rank among the top 15 features for most patients. As such, they show a strong discriminating potential between ictal and non-ictal epochs.
Cross-correlation features
The cross-correlation in the time-series did not perform very consistently across patients. It was suggested that zero-lag cross-correlation may only really increase towards the end of the seizure57, which may explain the lack of changes in
cross-correlation coefficients for many channels. We should also note that due to the bipolar montage, our channels already represent the difference in potential between two cortical electrodes. As electrodes become more synchronous, the bipolar signal will drop close to zero and so will their cross-correlations with other signals. In the time domain, there is no distinction between increases and decreases of the cross-correlation, as negative correlations simply depend on the polarity of the montage. In the frequency domain, however, feature values tend to be positive, and this feature shows a clear behaviour across all patients. The widespread strong decrease of cross-correlation coefficients in the frequency domain between these bipolar channels is remarkable. It implies that during seizures the distribution of power across 1Hz buckets becomes less similar in nearly all bipolar channels.
This is also adequately captured by the eigenvalues of the correlation matrix. Each eigenvalue reflects the correlations between all six ECoG channels, but the largest amount of correlation is represented by the highest eigenvalue. The increase in the rest of the spectrum also contains information about the changing correlations. As such, the spectrum indeed allows for a compact assessment of the evolving correlation structure.
Lacunarity
Lacunarity is among the lowest ranking features for most patients. The poor performance may be due to the computation of the feature during which the detail coefficients is shifted to positive values. As this shift depends on the minimum value of in the epoch, the resulting feature value may depend more on this minimum than on the actual lacunarity. Extracting the feature using a fixed offset, would require prior knowledge of the range that each detail coefficient may have, which would it less applicable in an online detector.
Fluctuation index
Although the fluctuation index can be thought of as a decomposition of the line-length feature in three frequency bands, it does not seem to capture the same information as the line-length feature. Whereas line-length has a significant increase in most
channels, the fluctuation index shows a lot more decreases. This can be attributed to effects of the DWT that precede the extraction of the fluctuation indices: of the decomposition, only the coefficients that represent 4 to 32Hz are used to compute the fluctuation index. Thus, fluctuations in the gamma band are largely excluded. The 16-32Hz fluctuation index behaves similarly to Beta power, so the two are likely to contain the same information.
Limitations
The selection of bipolar channels is inherently subjective and patient-dependent. Although a careful selection took place to ensure the use of artefact-free channels that capture different combinations of involvement in ictal activity (i.e. both involved in seizure onset, neither involved in seizure onset, and only one involved in seizure onset), this still does not guarantee comparable channels across different patients. The goal of including these different combinations of involvement, was to strive for capturing as much information in the bipolar channels as possible. The variation in feature behaviour among channels in each patient seems to confirm that this was successful to some extent. In choosing electrode positions, we did not discriminate between underlying cortical areas, nor did we take into account in which areas would be stimulated if the patient would actually receive a closed-loop CES device. In an actual CES implant, these factors might constrain electrode locations.
For some patients, several features did not perform as good as for other patients. Several factors can play a role in these differences. Besides the mentioned limitations in channel selection, different patients also produce different onset patterns (Table 2). The amount of seizures and variability between ECoG characteristics between seizures for the same patient, can also reduce significance of the differences between ictal and pre-ictal activity. Lastly, the baseline ECoG before each seizure may be in a specific sleep state that is harder to distinguish from seizure onset.
In creating ictal and pre-ictal epoch sets, stages of ictal activity may be included in the ictal epoch set that go beyond what can be considered seizure onset. However, reducing the amount of epochs even further would impede the possibility of achieving significant results. The use of pre-ictal epochs as opposed to inter-ictal epochs not closely preceding a seizure, may give a non-representative view of the baseline ECoG, as there is increasing evidence of the existence of a pre-ictal state58,59. For the
application of a responsive CES device, distinguishing between ictal and pre-ictal seems the most relevant, when targeting seizure onset specifically.
Perspectives for classification
The used 138-feature set, including sixteen types of local features and four global features, have a potential for discriminating between ictal and pre-ictal epochs. Variance, line-length, gamma power, beta power, power ratio, fluctuation index, time-series correlation, frequency
cross-correlation, and eigenvalue of the frequency cross correlation are the most promising feature types in this set. The combination of the line-length feature with power band features and global features could be a promising basis for classification. Other included features may complement these by adding some additional discriminative power.
4. Classification and validation
The features from the preceding chapter are used to implement a detector based on a RF classifier. The patient-specific classifier is trained and tested on patients’ data and compared with a method similar to one of the methods used by the only medically approved responsive neurostimulator (Neuropace RNS).
4.1 Methods
The early seizure detection algorithm is trained and tested on retrospective ECoG data from ten patients with sensorimotor epilepsy. We used the same set of seizures from the ten patients as described in Chapter 3 (Table 2) as a starting point for the training set for training each patient-specific classifier. ECoG recordings containing seizures are split in blocks, each containing at least one seizure and a varying amount of pre-ictal and post-ictal data. Blocks with multiple seizures are split so that in every block there is one seizure. Post-ictal data is excluded for 20 minutes after the seizure offset.
To obtain the chance of early detection without the use of overlapping windows, which would introduce extra computational demands, feature sets are computed using non-overlapping 1s epochs, as described in Chapter 3.2. Subclinical seizures are removed from the training dataset. As in chapter 3, epochs are either labelled ictal or non-ictal.
It is important that the classifier can distinguish between ictal activity and different sleep stages. Early NREM, late NREM and REM stages each have their own characteristics reflected in ECoG, which might resemble ictal activity in some regards. As we are dealing with sensorimotor cortex, a sudden change in mu-rhythms may also resemble ictal activity. Therefore, additional interictal blocks are included in the training set for each patient and labelled as seizure: at least 10 minutes of non-REM or early sleep, 10 minutes of non-REM sleep or late sleep, and 10 minutes of performing a controlled motor task or other dexterous activity.
Cross-validation
Because the number of seizures is low in some of the included patients, seizure-level leave-one-out cross validation is performed while training the classifier for each patient. In this process, one seizure and its preceding pre-ictal data is left out for testing and the classifier is trained using the remaining seizures, complemented with the additional interictal blocks. This is repeated with each seizure left out once for testing.
From the cross-validation, the sensitivity for early detection is determined by whether each seizure was detected within the first 10 second using the classifier. The end time of the first epoch to be detected successfully is considered the detection delay for that seizure. The median detection delay and delay range are used as performance indicators. The cross-validation also provides an estimate of the FDR for all the detections occurring in the left out pre-ictal data. In the end, the classifier with the best performance over the entire data is selected.
Testing dataset
Random Forest Classifier
The number of trees is set to 100. Higher numbers of trees were tested but did not increase the accuracy of classification significantly. The number of features randomly selected at each node is set
to √𝑁features rounded up, i.e. twelve features at each node. The Gini coefficient61 is used as
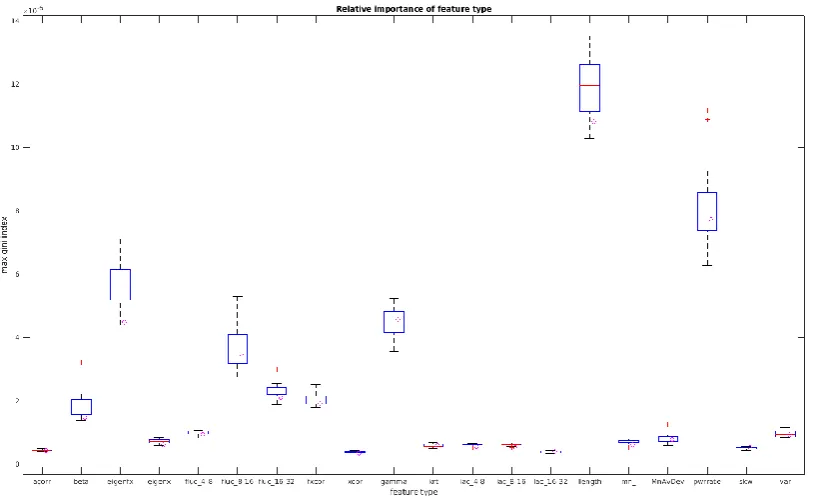
branching index in growing each decision tree of the RF. The importance of each feature is computed based on the decrease of this Gini coefficient, eliciting which features are more active.
Reference algorithm: comparison with existing neurostimulator detector
The Neuropace RNS system uses any (up to two) of three detection tools operating on 1 or 2 channels to detect seizure onset62: the half-wave tool segments the electrographic signal at local
minima and maxima resulting in half-waves representing frequency components; the area tool measures the overall power of the signal; and the line-length tool employs the sum of distances between successive points to identify changes in both amplitude and frequency.63 Since precise
assessment of the Neuropace RNS system is not possible64, the line-length based thresholding
classifier as estimated by Manzouri et al.38 is implemented as a reference algorithm to compare
performance with our algorithm.
For this approximation of the algorithm, the line-length feature as described in Chapter 3.1 is normalised by z-scoring, and a threshold is set that optimises sensitivity and FDR. A logical ‘or’-function was used to combine the results of the two SO-SO detection channels. The same cross-validation is used for the line length algorithm, as was used for the RF classifier to assess the sensitivity and obtain an estimation of the FDR, and the testing set is used to get a realistic FDR.
Performance indicators
Sensitivity, defined as the ratio of correctly detected seizures to the total number of seizures, is used as measure for the ability of the classifier to detect seizures. Early seizure detection (<10 s) sensitivity is used to measure the ability to actually detect seizure onset.