Stratification and Double-Diffusive Convection
in the Bab-el-Mandeb Strait during
Winter Monsoon
Sadrinasab, Masoud1*; Hosseinpour, Mahboubeh2
1- Dept. Of Engineering, Graduate Faculty of Environment, University of Tehran, IR Iran 2- Dept. of Physical Oceanography, Faculty of Marine and Ocanic Science Khorramshahr
University of Marine Science and Technology, IR Iran
Received: November 2015 Accepted: February 2016
© 2016 Journal of the Persian Gulf. All rights reserved.
Abstract
Investigation of stratification in marine environments is always considered by researchers. In this study double-diffusive convection and stratification in the Bab el Mandeb strait is investigated by analyzing of field data. Measurement of seawater temperature and salinity from ARGO project (2009 to2014) and also R-V Knorr (2001) cruise with the daily average of seawater temperature and salinity at different levels of HYCOM+NCODA (2001 to 2014) are used in this research. For a better understanding of the physical condition of the study area, seawater temperature, salinity, density, buoyancy frequency, density ratio and Turner angle changes versus depth are plotted and analyzed. The results illustrated that the depth of mixed layer is almost 100 meters during the winter monsoon and there is a stable stratified structure at this time of the year. Due to a thermohaline intrusion from the Red Sea, a temperature inversion is occurred, while below 150 meters the upper and lower boundary diffusive convection and a salt fingering established, respectively. In the northern part of the strait, the temperature inversion occurs below the depth of 200 meters. The double-diffusive convection is moderately weak in the northern part whereas, in the western part of the strait, it is mostly diffusive convection. Around 62.4% of the Bab el Mandeb strait exhibited favorable conditions for double diffusion processes during the winter monsoon; among that, ~4% was associated to salt fingering and ~96% to diffusive convection. Considering the fact that these conditions have been observed in different years, stable stratification and double-diffusive convection can be considered as a characteristic for the Bab el Mandeb strait during the winter monsoon.
Keywords: Intrusion, Stratification, Double-Diffusive Convection, Turner angle, Bab-el-Mandeb Strait
1. Introduction
Double-diffusive convection can occur as a result of temperature and salinity differences in different depths of marine environments. In the oceans, the
heat diffuses approximately 100 times faster than salt. In general, the water column may be statically stable, but it is susceptible to instability because of the rapid diffusion of heat from a fluid mass relative to that of salt (Kantha and Clayson, 2000). When a relatively warm and salty water mass overlay a (Marine Science)/Vol. 7/No. 23/ March 2016/12/39-50
* Email:
cooler and fresher but denser water mass, narrow vertical finger-like structures are established, which is called salt fingering. The other type of double-diffusive convection is double-diffusive convection. When a relatively cold and fresh water mass overly a warmer, saltier but denser water mass, oscillatory instability occurs which leads to a series of well-mixed layers, separated by sharp interfaces. These two diffusive regimes have been investigated by Turner using linear analysis theory in 1976. Double-diffusive convection reduces the potential energy of the fluid column and increases the vertical density stratification (Kantha and Clayson, 2000, Swift et al., 2003).
The temperature gradient between the surface and deep water, vertical salinity difference and difference between heat and salinity diffusion can permanently and naturally produce double-diffusive convection phenomenon (Ruddick, et al., 1979).
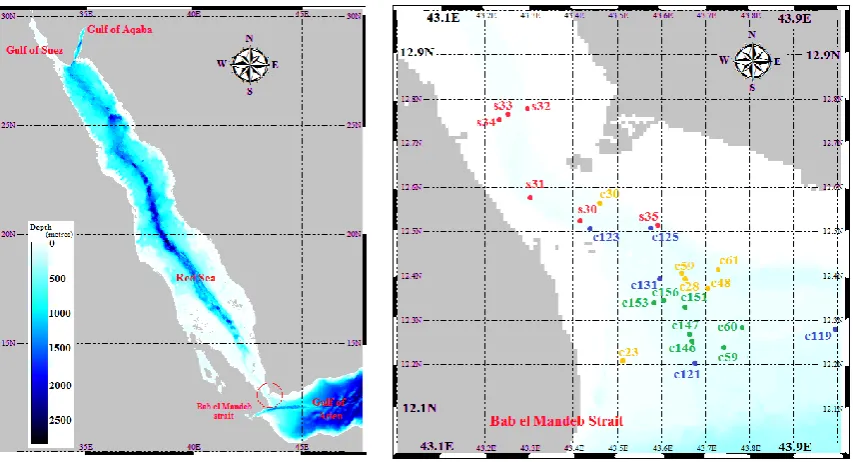
The Red Sea is a narrow and long semi-enclosed tropical marginal basin between Asia and Africa and extending from 12.5°N to 30°N. In the Northern end, two small gulfs (Gulf of Suez and Gulf of Aqaba) are connected to the Red Sea (Fig. 1). The Gulf of Suez
is a shallow basin with a maximum depth of about 100 meters. The Gulf of Aqaba with a maximum depth of about 1800 m is connected to the Red Sea through a 260 m deep sill (Yao et al., 2014).
The Red Sea has a surface area of roughly 438,000km2 and an average depth of 490m. The central trench depth in the Red Sea is more than 2,000m and its connection to the ocean is through the Bab el Mandeb Strait and the Gulf of Aden, (Sofianos, 2002). The Bab el Mandeb is a long strait with a length of 150 Km and the Island of Perim, divides the strait into two channels. The shallowest section of Bab el Mandeb consists of Hanish sill, close to Hanish Islands, and the narrowest section of it close to Perim Island (Sofianos, 2002, Murray, 1997). The high rate of evaporation, low rate of precipitation and water exchange combined with negligible river runoff, make the Red Sea the most saline basin in the world’s oceans. Salinity in the northern parts of the Red Sea is ~42.5 PSU during summer (Knowles E., 2008). The annual average freshwater loss to the atmosphere over the Red Sea is approximately estimated as 2.06 ± 0.22 myr-1 (Sofianos et al., 2002 and 2015).
Fig. 1: The bathymetry of the Red Sea (Left); locations of Gulf of Aqaba, Gulf of Suez, Gulf of Aden, and Strait of Bab el Mandeb are shown. Locations of stations of R-V Knorr2001 cruise (Red), cycles of platform 2,900,826 (Blue), cycles of platform 2,901,148(Green), cycles of platform2901452 (Orange) in the Bab el Mandeb Strait during winter Monsoon are shown (Right). s31 and etc., c123 and etc. are station and cycle numbers, respectively.
Saline water enters into the Gulf of Aden through the Bab el Mandeb strait and it is stabilized in a depth of about 800 m due to the influence of buoyancy. After being mixed with surrounding freshwater, this saline deep water will extend to the Indian Ocean subsurface (Beal et al., 2000, Bower et al., 2012). During winter, the exchange of the Red Sea through the Bab el Mandeb strait combines a surface inflow of freshwater from the Gulf of Aden and a deep outflow of saline water. During the summer, there is a three layers exchange structure including a surface outflow from the Red Sea, intermediate inflow from the Gulf of Aden and a weak and deep outflow from the Red Sea (Murray and Johns, 1997, Sofianos et al., 2000, 2002, Biton et al., 2008, 2010).
Wind patterns in the Red Sea region are controlled by two distinct monsoons; the interval to change from one monsoon to another monsoon is 30 to 45 days. The subsurface warm and high saline outflow from the Red Sea into the Gulf of Aden is distinctly seasonal. It increases during winter from October to May and attenuated or blocked in summer from July to August (Seriy, 1968, Patzert, 1974, Osman, 1985, Maillard and Soliman, 1986, Murray and Johns, 1997, Bower et al., 2000, Beal et al., 2000, Peters et al., 2005, Yao et al., 2014).
Argo is a global array of 3000-3800 free-drifting profiling floats that measure the temperature and salinity of the upper 2000m of the ocean. The original global Argo array was designed for the open ocean excluding seasonal sea-ice zones and marginal seas. In 1999, to combat lack of oceanographic data, an innovative step was taken by scientists to greatly improve the collection of observations inside the ocean through the increased sampling of old and new quantities and increased coverage in terms of time and area. Argo deployments began in 2000, and the water salinity and temperature data were collected. The Argo array is part of the Global Climate Observing System-Global Ocean Observing System GCOS-GOOS).
Several studies have been carried out on double-diffusive convection and its effects on various
phenomena in different parts of the ocean and seas; Bidokhti et al. (2011) investigated the layered structure in exchange flows between two basins (Middle and Southern basins of the Caspian Sea). Lee et al. (2014) calculated the vertical diffusivity and the fluxes of heat, salt, and buoyancy due to turbulence and double diffusion based on a 14 day time series of observations of the dissipation rates of turbulent kinetic energy and thermal variance at 0°N, 156°E from 25 October to 18 November 2012. Reiner et al. (2003) investigated a large set of historical conductivity temperature depth casts for the occurrence of double-diffusive vertical mixing due to salt finger convection. Carniel et al. (2008) studied double-diffusive layers in the southern Adriatic Sea in the Mediterranean during the Naval Research Laboratory winter cruise in March 2006.
In this study, we present the water salinity and temperature data set and focus on investigating how vertical stability and double diffusion have varied in the Bab el Mandeb strait during winter monsoon. Selection of appropriate cycles of Argo platforms is the first step. Therefore, we begin by analyzing the HYCOM+ NCODA Global reanalysis data for distinguishing seawater conditions in the Bab el Mandeb Strait.
2. Materials and Methods
The location of the stations and cycles of Argo platform are shown in Figure 1. Because each platform follows a different path near the Bab el Mandeb, the inter-comparison region in this study extends only between 43.2°E to 43.8°E.
Basic data of the research include seawater salinity and temperature data from Argo project recorded in the geographical location of 12.2°N to 12.8°N and 43.2°E to 43.8°E from 2009 to 2014 (Table1). Seawater salinity and temperature data R-V Knorr 2001 cruise were recorded (Table2). Moreover, daily averaged seawater temperature and salinity at different levels obtained by HYCOM+NCODA with a horizontal resolution of 5 minutes from 2001 to 2014 were used.
Table 1: specifications of cycles of platforms of Argo project Date Longitude latitude Cycle platform 07-03-2009 11-03-2009 15-03-2009 19-03-2009 31-03-2009 44.037E
43.67 E 43.441E 43.583E 43.39 E 12.282N
12.201N 12.51N 12.524N 12.598N 119 121 123 125 131 2900826 22-02-2010 26-02-2010 43.741E
43.796E 12.243N
12.288N 59 60 2901148 05-02-2011 09-02-2011 25-02-2011 05-03-2011 17-03-2011 43.667E
43.663E 43.651E 43.585E 43.608E 12.252N
12.269N 12.331N 12.364N 12.389N 146 147 151 153 156 2901148 30-11-2013 20-12-2013 28-12-2013 43.518E
43.638E 43.462E 12.212N
12.388N 12.569N 23 28 30 2901452 10-03-2014 23-04-2014 01-05-2014 43.706E
43.468E 43.734E 12.367N
12.405N 12.418N 48
59 61 2901452
Table 2: specifications of stations of R-V Knorr 2001 cruise Date Longitude
latitude Station number
20-02-2001 43.417E
12.527N 30
20-02-2001 43.301E
12.574N 31
20-02-2001 43.277E
12.772N 32
20-02-2001 43.251E
12.760N 33
20-02-2001 43.229E
12.751N 34
20-02-2001 43.595E
12.508N 35
Seawater stability is studied by Brunt–Väisälä
frequency , where g is the local
acceleration of gravity,
0is the fluid density andis the vertical gradient of the ambient density. In
this relation, a positive value of N 2shows a stable
stratification, and a negative value indicates an
unstable stratification. In 1973, Turner presented a
relation between salinity and temperature gradient
as stability ratio or density ratio. The density
ratio, is a key parameter to study
double-diffusive convection, where 𝛼 is the thermal
expansion coefficient and 𝛽 is the saline contraction
coefficient. When R 1 salt fingering occurs, and
when0R 1 diffusive convection occurs. R 0 shows that there is a stable gradient of temperature
and salinity, and double-diffusive convection cannot
occur. WhenR0.3, diffusive convection is weak, and
for 0.3R0.77 diffusive convection is mediocre, and when 0.77R1 diffusive convection is strong. When R 3 is weak salt fingering occurs and for
1.56R3 the salt fingering is mediocre, and when 1R1.56 strong salt fingering occurs (Zhang et
al., 1998). Ruddick (1983) made it clear and
introduced the Turner angle, thus,
salt fingering occurs when 45 Tu 90 , diffusive convection occurs when 45 Tu 90 while no double- diffusive convection occurs when
45 Tu 45
. When Turner angle is 90 and 90
the strongest diffusive convection and salt fingering
occur, respectively.
𝑁2= − g 𝜌0𝑑𝜌𝑑𝑧
𝑑𝜌 𝑑𝑧
𝑅𝜌 = 𝛼∆𝑇𝛽∆𝑆
𝑇𝑢 = 𝑡𝑎𝑛−1 𝑅𝜌+ 1
𝑅𝜌− 1
Robertson et al. (1995) presented the Turner angle in more detail: 67.5 Tu 45 for weak diffusive convection, 90 Tu 67.5for strong diffusive convection, 45 Tu67.5for a weak salt fingering and 67.5 Tu 90 for a strong salt fingering.
Here, the seawater temperature, salinity and density structures, static stability and double-diffusive convection in the Bab el Mandeb strait (between 12.2 N 12.7N ) are investigated by Turner angle and buoyancy frequency analysis in long-term. Vertical sections of daily seawater temperature and salinity figures from results of HYCOM+NCODA are plotted to distinguish seawater conditions in the study area during the Northeastern monsoon. The
curves of seawater temperature, salinity, density and Brunt–Väisälä frequency (buoyancy frequency), density ratio and Turner angle versus depth are plotted for investigating the stratification and double-diffusive convection phenomenon.
The results of HYCOM+NCODA in the Bab el Mandeb have been validated with Argo observations before these data are used.
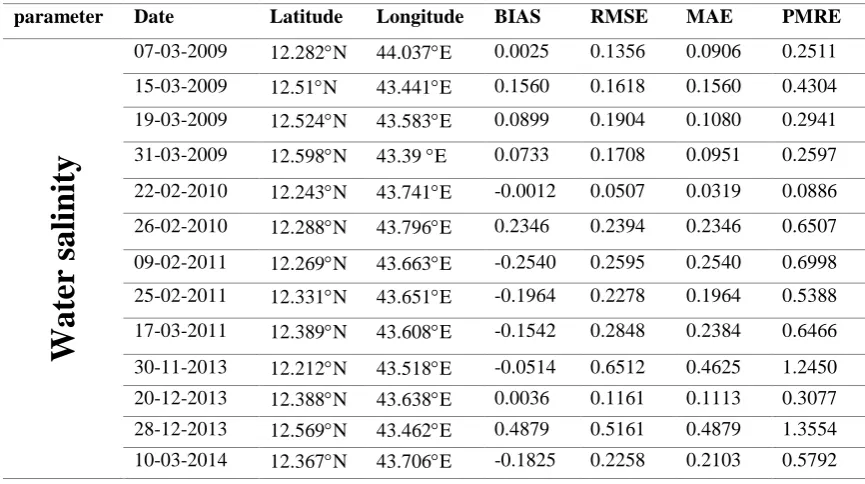
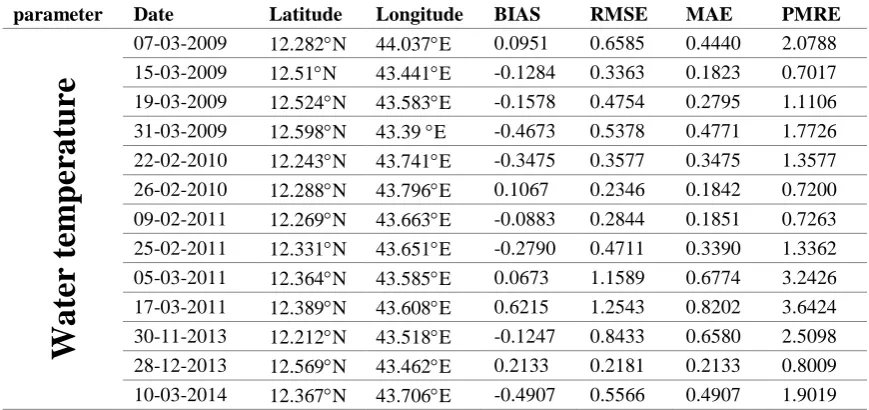
The statistical analysis includes bias (BIAS), root mean square error (RMSE), mean absolute error (MAE) and percent mean relative error (PMRE), (Table3).
Generally, the results of statistical criteria are satisfactory for both parameters, (Table 4, 5).
Table 3: Statistical criteria for evaluation of the parameterization performances. ei, mi and n are estimated, measured and the number of observations, respectively.
1 1
n i ii
BIAS e m
n
21 1
n i ii
RMSE e m
n
1
1
n i i iMAE e m
n
1
100
n i ii i
e m
PMRE
n m
Table 4: Statistical criteria for comparison between HYCOM+NCODA and observed water salinity
parameter Date Latitude Longitude BIAS RMSE MAE PMRE
Water sal
ini
ty
07-03-2009 12.282N 44.037E 0.0025 0.1356 0.0906 0.2511 15-03-2009 12.51N 43.441E 0.1560 0.1618 0.1560 0.4304 19-03-2009 12.524N 43.583E 0.0899 0.1904 0.1080 0.2941 31-03-2009 12.598N 43.39 E 0.0733 0.1708 0.0951 0.2597 22-02-2010 12.243N 43.741E -0.0012 0.0507 0.0319 0.0886 26-02-2010 12.288N 43.796E 0.2346 0.2394 0.2346 0.6507 09-02-2011 12.269N 43.663E -0.2540 0.2595 0.2540 0.6998 25-02-2011 12.331N 43.651E -0.1964 0.2278 0.1964 0.5388 17-03-2011 12.389N 43.608E -0.1542 0.2848 0.2384 0.6466 30-11-2013 12.212N 43.518E -0.0514 0.6512 0.4625 1.2450 20-12-2013 12.388N 43.638E 0.0036 0.1161 0.1113 0.3077 28-12-2013 12.569N 43.462E 0.4879 0.5161 0.4879 1.3554 10-03-2014 12.367N 43.706E -0.1825 0.2258 0.2103 0.5792
Table 5: Statistical criteria for comparison between HYCOM+NCODA and observed water temperature (C)
parameter Date Latitude Longitude BIAS RMSE MAE PMRE
Water tem
per
atur
e
07-03-2009 12.282N 44.037E 0.0951 0.6585 0.4440 2.0788 15-03-2009 12.51N 43.441E -0.1284 0.3363 0.1823 0.7017 19-03-2009 12.524N 43.583E -0.1578 0.4754 0.2795 1.1106 31-03-2009 12.598N 43.39 E -0.4673 0.5378 0.4771 1.7726 22-02-2010 12.243N 43.741E -0.3475 0.3577 0.3475 1.3577 26-02-2010 12.288N 43.796E 0.1067 0.2346 0.1842 0.7200 09-02-2011 12.269N 43.663E -0.0883 0.2844 0.1851 0.7263 25-02-2011 12.331N 43.651E -0.2790 0.4711 0.3390 1.3362 05-03-2011 12.364N 43.585E 0.0673 1.1589 0.6774 3.2426 17-03-2011 12.389N 43.608E 0.6215 1.2543 0.8202 3.6424 30-11-2013 12.212N 43.518E -0.1247 0.8433 0.6580 2.5098 28-12-2013 12.569N 43.462E 0.2133 0.2181 0.2133 0.8009 10-03-2014 12.367N 43.706E -0.4907 0.5566 0.4907 1.9019
3. Results
Figures 2 and 3 display the vertical cross sections of daily averaged seawater temperature and salinity between 12.2°N and 12.5°N from HYCOM+NCODA database. As it is clearly shown, there is a warm and saline water outflow from the Red Sea to the Gulf of Aden through the Bab el Mandeb strait below 150 m in the western part. Therefore, the double-diffusive convection formation can occur in this area.
Buoyancy frequency is positive beneath the mixed layer and its maximum is in the thermocline layer where density changes more rapidly. The buoyancy frequency is almost constant beneath the thermocline layer.
For investigating the physical parameters as well as double-diffusive convection in the study area, the seawater temperature, salinity, density, buoyancy frequency, density ratio and Turner angle changes versus depth are demonstrated in figure 4.
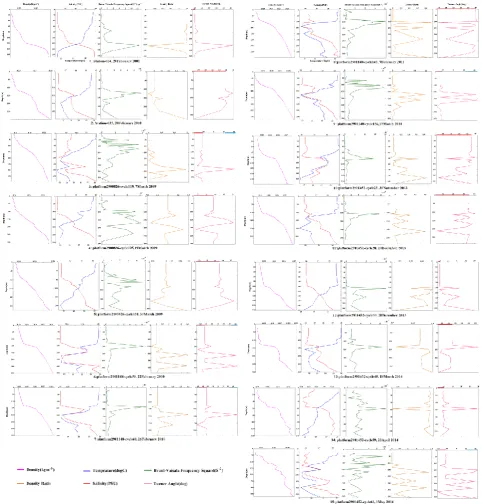
As illustrated in figure 4 (1, 2), measurements on February 20th, 2001 at all stations except for station 35 indicate a stable temperature and salinity gradient and absence of double-diffusive convection. At station35, temperature inversion and a weak diffusive convection are observed in a depth of around 200 meters, (67.5 Tu 45 ), (Fig.4-2).
Also, measurementsonMarch 7th, 2009 (Fig. 4-3) show the temperature inversion in depth of 200 and 300 m, strong salt fingering in depth of 300m, (67.5 Tu 90 ) weak diffusive convection in a depth of around 250, and below 350m. Results of measurements on March 11th, 2009 indicate temperature inversion in depth of 200 and 250m, strong salt fingering between 200 and 240m, strong diffusive convection in depth of 300m, ( 90 Tu 67.5) and weak diffusive convection in depth of about 250 and below 300m. Plots of measured data on March 15th, 2009 show a stable temperature and salinity gradient and absence of double-diffusive convection. Measured data on March 19th, 2009 (Fig. 4-4) show temperature inversion and weak diffusive convection in the depths of 100 and 200m. Plots of measured data on March 31st, 2009 (Fig. 4-5) also indicate temperature inversion and weak diffusive convection below 200m.
Collected field data on February 22nd, 2010 (Fig. 4-6), shows temperature inversion and weak salt fingering below 150m, ( 45 Tu 67.5). Plots data on February 26th, 2010 (Fig. 4-7), show temperature inversion below 150m, moderate salt fingering in the depth of about 200m and strong salt fingering below 250m.
Measurements in February 2011 indicate temperature
inversion and weak salt fingering below 150 m. There is a strong diffusive convection below 150m on February 9th, 2011(Fig.4-8), and February 25th, 2011. Plots of measured data on March 5th, 2011 show temperature inversion below 150m and there is moderate diffusive convection between depths of 150 and 200m. Results of measurements on March 17th, 2011 (Fig. 4-9), confirm temperature inversion below 150 m, strong salt fingering between depths of 150 to 250m and weak diffusive convection in the depth of around 250m.
Based on measurements on November 30th, 2013
(Fig. 4-10), the temperature inversion occurs in depths of 80 and 130m. Measurements also show strong diffusive convection in depths of 80 and 140m, as well as weak diffusive convection between these depths 80 and 140m. According to plots for December 30th, 2013 (Fig. 4-11), the temperature inversion occurs in depth of 130m, weak diffusive convection below 100m such that this regime is slightly stronger in the depth of around 200m. Measurements on December 28th, 2013 (Fig. 4-12), confirm stable temperature and salinity gradients and absence of double-diffusive convection.
Fig. 2: Vertical cross sections of the seawater temperature (left), salinity (right) between 12.2°N and 12.5°N for February 20th, 2001, March 15th, 2009, February 26th, 2010, respectively, from HYCOM+NCODA data.
Fig. 3: Vertical cross sections of the seawater temperature (left), salinity (right) between 12.2°N and 12.4°N for February 5th, 2011, December 20th, 2013 and March 10th, 2014 from HYCOM+NCODA data.
According to the measurements on March 10th, 2014 (Fig. 4-13) and April 23rd, 2014 (Fig. 4-14) the temperature inversion and weak diffusive convection occur below 150 and 120m, respectively. Data of May 1st, 2014 (Fig. 4-15) indicate that temperature
inversion occurs in the depth of 120m, strong diffusive convection happens in the depth of 120 and 300m and mediocre salt fingering exists between 100 and nearly 300m.
Analyses of seawater temperature and salinity
records of platforms of Argo for March 2009, February 2010, February and March 2011, December 2013 and March 2014 and R-V Knorr February 2001 cruise data, showed almost 100m of mixed layer depth in the study area (Figure4). As a result of the transition from the winter monsoon to the summer
monsoon, the mixed layer depth is reduced to 60m in the late April and early May (Figures 4-14 and 15).
The probability of double-diffusive convection in intermediate-deep waters at latitudes between 12.2°N and 12.4°N is higher than other areas during winter monsoon, (Table 6,7).
Fig. 4: The seawater temperature, salinity, density and buoyancy frequency, density ratio, Turner angle changes versus depth at stations 34 and 35 from R-V Knorr 2001 and from cycles 119, 125 and 131 in 2009, cycles 59 and 60 in 2010, cycles 147 and 156 in 2011, cycles 23, 28 and 30 in 2013 and cycles 48, 59 and 61 in 2014. Salt fingering occurs when 45 Tu 90 (blue line on the Turner angle axis), diffusive convection occurs when 45 Tu 90 (red line on the Turner angle axis).
Table 6: Based on the water depth: the percentage of Turner angle favorable to double diffusion and according to this percentage, the percentage of Turner angle favorable to salt fingering and diffusive convection are estimated in the Bab el Mandeb strait during winter monsoon.
Depth double diffusion
Salt fingering
Minimum of Turner angle
Maximum of Turner angle Diffusive
convection Mixed layer
(depth<100m) 13%
100% -25 -49.43
0 Weak diffusive convection
Intermediate water
(100m<depth<250m) 59.4%
89.8% -86.3 89.42
10.2% Diffusive convection and salt fingering
deep water
(depth>250m) 87.7%
92% -87.43 85.8
8% Diffusive convection and salt fingering
Table 7: Based on the geographic location: the percentage of Turner angle favorable to double diffusion and according to this percentage, the percentage of Turner angle favorable to salt fingering and diffusive convection are estimated in the Bab el Mandeb Strait during winter monsoon.
Latitude double diffusion
Salt fingering
Minimum of Turner angle
Maximum of Turner angle Diffusive
convection
Within 12.2°N-12.4°N 67.7%
95.2% -87.43 89.42
4.8% Diffusive convection and salt fingering
out of12.2°N-12.4°N 17.4% 100% -53 -35.65
0 Weak diffusive convection
4. Discussion and Conclusions
Based on daily averaged seawater temperature and salinity from HYCOM+NCODA database, a warm and saline water outflow from the Red Sea to the Gulf of Aden through the Bab el Mandeb Strait exist and analyzed data predict double-diffusive convection in water depths of more than 150m in this region. Profiles of temperature versus depth show that a jagged structure and temperature inversion layer are created by thermohaline intrusion layers. Moreover, increases of temperature difference are clearly shown in temperature inversion layers at latitudes between 12.2°N and 12.4°N. In addition profiles of the seawater salinity and buoyancy frequency versus depth indicate a statically stable structure.
Profiles of temperature, salinity and density versus depth show that there is a mixed layer below 100m and a stable stratified structure below the mixed
layer exists during a winter monsoon, between 12.2°N and 12.4°N. Due to a thermohaline intrusion from the Red Sea through the Bab el Mandeb Strait, a temperature inversion occurred below 150m, and the upper and lower boundary of this depth are adjusted to diffusive convection and salt fingering, respectively. Such regime exists between 43.6°E and 44°E. In higher latitudes, about 12.4°N, temperature inversion occurs below 200m. Consequently, at these latitudes and western longitudes for 12.2°N and 12.4°N, double-diffusive convection is moderately weak and mostly in the form of diffusive convection. Around 62.4% of the Bab el Mandeb Strait exhibited favorable conditions for double diffusion processes during the winter monsoon. According to this percentage, 4% was associated with salt fingering and 96% with diffusive convection. Generally, intermediate and deep waters (below 100m) seemed to experience both salt fingering and
diffusive convection. The strongest salt fingering could occur in the intermediate layer of the medial longitudes for 12.2°N and 12.4°N where the Turner angles values close to 90were obtained throughout the entire analyzed period. In contrast, the strongest diffusive convection occurs in the deep layer of this area.
Considering the fact that these conditions have been observed in different years, stable stratification and double-diffusive convection can be assumed as a characteristic for the Bab el Mandeb during the winter monsoon.
Acknowledgements
We are grateful to the International Argo Data System for providing critical information about a series of observations in the Red Sea, which encouraged the progress of this investigation; and thank the anonymous reviewers whose suggestions were helpful for improving the quality of this paper.
References
Alessi, C.A., 1999. Hydrographic data from the US naval oceanographic office: Persian Gulf. Southern Red Sea and Arabian Sea 1923–1996, Woods Hole Oceanographic Institution; WHOI- 99-02.
Alraddadi, T. M., 2013. Temporal Changes in the Red Sea Circulation and Associated Water Masses, PhD thesis, University of Southampton. Beal, L. M., Ffield, A., Gordon, A. L., 2000.
Spreading of Red Sea overflow waters in the Indian Ocean, Journal of Geophysical Research: Ocean 105 (C4) 8549–8564.
Bidokhti, A. A., Shekarbaghani, A., 2011. The layered structure in exchange flows between two basins (Middle and Southern basins of the Caspian Sea), International Journal of Marine Science and Engineering 1(1), 13-22.
Biton, E., Gildor, H., Peltier, W. R., 2008. Red Sea during the last glacial maximum: Implications for sea level reconstruction, Paleoceanography, 23,
PA1214.
Biton, E., Gildor, H., Trommer, G., Siccha, M., Kucera, M., van der Meer, M. T. J., Schouten, S., 2010. Sensitivity of Red Sea circulation to monsoonal variability during the Holocene: An integrated data and modeling study, Paleoceanography, 25, PA4209. Bower, A. S., & Furey, H. H., 2012. Mesoscale eddies in the Gulf of Aden and their impact on the spreading of Red Sea Outflow Water. Progress in Oceanography, 96(1): 14-39.
Bower, A. S., Hunt, H. D., Price, J. F., 2000. Character and dynamics of the Red Sea and Persian Gulf outflows, Journal of Geophysical Research: Ocean 105, 6387–6414.
Carniel, S., Sclavo, M., Kantha, L., 2008. Hartmut Prandke Double-diffusive layers in the Adriatic Sea, Geophysical Research Letters, 35, L02605. Churchill, J.A., Bower, A., McCorkle, D.C.,
Abualnaja, Y., 2014, The transport of nutrient-rich Indian Ocean water through the Red Sea and into coastal reef systems. Journal of Marine Research. 72 (3): 165-181
Johns, W., Peters, H., Zantopp, R., Bower, A., Fratantoni, D., 2001. CTD/O2 measurements collected aboard the R/V Knorr, February –March 2001: REDSOX-1, Technical Report 2001-01, University of Miami, Miami, Florida, 10 pp. plus appendices.
Kantha, L. H., Clayson, C. A., 2000. Small scale processes in geophysical fluid flow (International Geophysics) Academic Press, 682-732.
Lee, C., Chang, K.-I., Lee, J. H., Richards, K. J., 2014. Vertical mixing due to double diffusion in the tropical western Pacific, Geophysical Research Letters 41, 7964–7970.
Madah, F., 2017. Numerical simulation of the hydrodynamic processes in the Red Sea Region. PhD thesis. Christian-Albrechts Universität Kiel. Morcos, S. A., 1970. Physical and chemical
oceanography of the Red Sea, Oceanography Marine Biology Annual Review, 8, 73 – 202. Murray, S. P., Johns, W., 1997. Direct observations
of seasonal exchange through the Bab el Mandeb Strait, Geophysical Research Letters 24(21): 2557–2560.
Reiner, O., Brambilla, E, 2003. Double diffusion in the Mediterranean Sea: Observation and parameterization of salt finger convection, Journal of Geophysical Research, 108(9), 8124.
Rosen, K., Van Buskirk, R., Garbesi, K., 1999. Wind Energy Potential of Coastal Eritrea: An Analysis of Sparse Wind Data, Solar Energy, 66, (3): 201–213. Ruddick, B., 1984. The life of a thermohaline intrusion.
Journal of Marine Research 42 (4): 831–852.
Ruddick, B., Turner, J.S., 1979. The vertical scale of double-diffusive intrusions. Deep-Sea Research., 26 (8): 903–913.
Smeed, D., 1998. Seasonal variation of the flow in the strait of Bab al Mandab. Oceanographic Literature Review, 6(45), 896.
Sofianos, S., Johns, W. E., 2015. Water Mass Formation, Overturning Circulation, and the Exchange of the Red Sea with the Adjacent Basins, N.M.A. Rasul and I.C.F. Stewart (eds.), The Red Sea, Springer Earth System Sciences,
343- 353.
Triantafyllou, G., Yao, F., Petihakis, G., Tsiaras, K., Raitsos, D., & Hoteit, I., 2014. Exploring the Red Sea seasonal ecosystem functioning using a three dimensional biophysical model. Journal of Geophysical Research: Oceans, 119(3): 1791-1811. Turner, J. S., 1967. Salt fingers across a density
interface, Deep-Sea Research, 14(5): 599 to 61 l. Yao, F., Hoteit1, I., Pratt, L. J., Bower, A. S.,
Zhai, P., Köhl, A., Gopalakrishnan, G., 2014. Seasonal overturning circulation in the Red Sea: 1. Model validation and summer circulation, Journal of Geophysical Research: Oceans, 119(4): 2238–2262.
Yao, F., Hoteit1, I., Pratt, L. J., Bower, A. S., Zhai, P., Köhl, A., Gopalakrishnan, G., 2014. Seasonal overturning circulation in the Red Sea: 2.Winter circulation, Journal of Geophysical Research: Oceans, 119(4): 2263–2289.
Zhang, J., Schmitt, R. W., Huang, R. X., 1998. Sensitivity of the GFDL Modular Ocean Model to parame terization of double-diffusive processes, Journal of Physical Oceanography, 28, 589– 605.
Sadrinasab and Hosseinpour / Stratification and double-diffusive convection…
Journal of the Persian Gulf (Marine Science)/Vol .7/No .23/ March 2016/12/39-50
Journal of the Persian Gulf
(Marine Science)/Vol. 7/No. 23/ March 2016/12/39-50