Please cite this article in press as: Rostami M, Garrusi B, Baneshi MR. A Study on the use of bootstrap aggregation methods in estimation of
J Biostat Epidemiol. 2016; 2(2): 104-10.
Original Article
A study on the use of bootstrap aggregation methods in estimation of stable parameters
Morteza Rostami1, Behshid Garrusi2, Mohamad Reza Baneshi3*
1
Department of Biostatistics and Epidemiology, School of Public Health, Kerman University of Medical Sciences, Kerman, Iran 2
Department of Community Medicine, Neuroscience Research Center, Afzallipour Medical School, Kerman University of Medical Sciences, Kerman, Iran
3
Modeling in Health Research Center, Institute for Futures Studies in Health, Kerman University of Medical Sciences, Kerman, Iran
ARTICLE INFO ABSTRACT
Received 28.01.2016 Revised 19.05.2016 Accepted 27.06.2016 Published 30.06.2016
Background & Aim: In many medical studies, one data set is used to construct the model, and to test its performance. This approach is prone to over optimization, and leads to statistics with low chance of external validity. Data splitting can be used to create training and test sets but the cost is reduction in power. The aim of this study was to demonstrate the ability of bootstrap aggregating (bagging) in improving performance of classification and regression tree (CART) models.
Methods & Materials: CART was applied on a sample of 404 subjects, to identify the factors that encourage people to change their body shape by cosmetic surgeries. Comparing known status of subjects with predicted group, sensitivity and specificity of models were compared. Firstly, all data was used to construct the tree and to test its performance. Secondly, model was fitted on half of data and tested on the second half. Thirdly, bagging was applied in which we drew 100 bootstrap samples. Using each bootstrap data, a tree was constructed and its performance was tested on the unselected subjects. Final group prediction for each subject was determined following majority voting.
Results: When the whole data was used the overall accuracy was 59%. In the test data set and bagging, accuracy reduced to 53% and 56%. Corresponding figures in terms of sensitivity were 60%, 52%, and 55%, respectively.
Conclusion: Bagging corrected performance estimates for over optimization. Bagging method produces statistics which has higher chance for external validity.
Key words: Classification and regression tree (CART); External validity; Bootstrap aggregating; Data splitting; Bagging
Introduction1
In medicine and epidemiology, simple decision rules are required to classify the patients into risk groups. For example, a breast cancer surgeon needs some rules to divide the patients into low versus high risk groups in terms of risk of recurrence. Such rules assist in treatment selection and care optimization (1).
* Corresponding Author: Mohammad Reza Baneshi, Postal Address: Modeling in Health Research Center, Institute for Futures Studies in Health, Kerman University of Medical Sciences, Kerman, Iran. Email: [email protected]
As an example, in the case of breast cancer, Nottingham Prognostic Index (NPI) has been proposed (2). In development of this index, regression models were applied. This index combines stage, grade, and size of tumor and calculate a simple risk score. Based on this model, patients are classified into low, intermediate, and high risk groups. This model has been validated in several independent studies(3-5), and now is one of central tools in treatment selection and management of patients.
alternative to regression models which are popular tools that give easily interpretable rules for decision making(6). However, to be useful in practice, stability should be of concern. To show the performance of TBM, some measures of performance such as sensitivity and specificity is required. It has been shown that TBM models are sensitive to small changes in data set, and therefore suffer from instability(7). It means that when rules derived from one data set are applied to an independent data set, its performance statistics (e.g. sensitivity and specificity) usually declines.
In majority of published manuscripts, authors fit their model on an empirical data set, and then test its performance on the same data set. It has been argued that to assess the performance of models, an independent sample is needed to avoid overoptimistic results (8).
In model development and performance assessment, if possible, two data sets are required: one for model fitting (known as training set) and one for performance assessment (known as test set). However, in most cases it is not possible to collect two independent data sets. Instead, researchers might randomly divide their data set into two parts. This approach can tackle the problem of over-optimized statistics, but ultimately affects the sample size and power.
Cross-validation (CV) is another tool. In ten-fold CV, the data set will be divided to 10 equal parts. At each step, one part is considered as test set. The model is developed on the rest of data and is tested on the removed part. This method does not reduce the sample size, but bootstrap method has been established as the best tool in assessment of model performance (9).
The main idea behind bootstrap is to resample with replacement from the original data. If we resample from the original data, say 100 times, we can explore variations in results due to minor changes in the data set. Therefore, some measures of model stability are in hand (10).
Recent developments have suggested bootstrap aggregation (bagging) of results. It means that, to control over-optimization, mean of measures of association and performance (e.g. odds ratio and sensitivity) across 100 data sets can be reported. A modified version of bagging
suggests assessing the performance on subjects not selected at each bootstrap sample.
In this manuscript, our goal is to explore the problem of over-optimized statistics in TBM, and to address the practicality of bagging methods to calculate more realistic performance statistics. To do so, we used an empirical data set so as to reveal characteristics that persuade subjects to change their body shape via surgery methods.
Methods
Sampling
In the initial study, a multistage sampling was adopted (11). The total sample size was 1204. In each household, only one subject was interviewed. This was done to ensure independency of samples, and to avoid similarity between subject's characteristics within households. The initial study was approved by the Medical Thesis and Ethical Committee of the Kerman Medical Sciences University. All of participants signed informed consent.
In the initial study, 202 subjects experienced surgical procedures for body change. In the current study, we randomly selected 202 control subjects to make a balanced dataset. Therefore, total sample size in current study was 404.
Dependent and independent variables
The dependent variable was whether subjects had any surgical operation to change their body shape (yes, no). Independent variables include demographic characteristics, socio economic status (SES), body mass index (BMI), media pressure, Physical Appearance Comparison Scale (PACS), Body Esteem Scale, Perceived Socio-Cultural Pressure (PSCP), Body Dissatisfaction (BD), and Rosenberg Self-Esteem (RSE) scale. These variables were measured using standard and validated questionnaires (12-20).
Imputation of missing data
Missing rate ranged from 0.2% (for age variable) to 16% (for PSCP variable). Before statistical analysis, missing data were imputed using Expectation Algorithm (21).
Construction of TBM
variable and cut-off that best separates subjects in terms of outcome of interest. All variables with all possible cut-offs will be applied to find the optimum variable/ cut-off. The aim is to divide the patients into nodes with maximum homogeneity within nodes, and maximum heterogeneity between nodes. Gini index was used as a measure of homogeneity. To avoid an over-fitted tree, minimum sample size in parent and child nodes were set at 60 and 30. In addition, the one Standard Error (SE) rule was applied to select the optimal tree (22, 23).
Assessment of performance
Indicators used to assess the performance of TBM model were sensitivity, specificity and overall accuracy. To do so, predicted group based on TBM model was cross-tabulated versus real group membership, as shown in Table 1. The sensitivity, specificity, and overall accuracy were defined as follows:
Sensitivity = ்ାிே் (1)
Specificity = ்ேାி்ே (2)
Overall Accuracy = ାାାା (3)
Table 1. Cross classification of subjects based on prediction by Tree-based models (TBM), and real group membership
Group membership Real group Positive Negative
Prediction based on TBM
Positive True positive (TP)
False positive (FP)
Negative False negative (FN)
True negative (TN)
At the first step, whole data was used in construction of tree. Then the rules were applied on the same data and sensitivity, specificity, and overall accuracy were calculated.
Secondly, the dataset was randomly divided into training and test sets. TBM was constructed using training set. Derived rules were applied on the test set and measures of performance were computed.
Finally, bagging was applied. We draw a sample with replacement from the original data, with sample size equal to that of original sample. TBM was constructed on this sample and its
performance was checked on subjects not being selected. This process was repeated 100 times. It has been shown that, in average, each subject will be selected in 63% of samples. Therefore, group membership was approximately determined 37 times for each subject. Final group membership for each subject was defined based on majority system.
Results
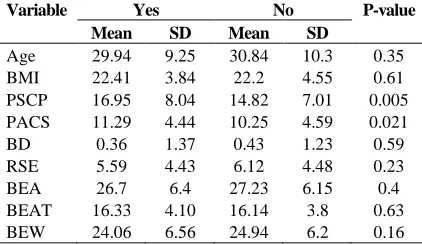
Mean age in both groups was about 30 years old. Comparing characteristics of two groups, significant differences were seen in terms of PSCP and PACS (Table 2). Mean score in the control group was significantly lower than the case group.
Table 2. Comparison of characteristics of subjects who experienced/ did not experience surgical procedures
Variable Yes No P-value
Mean SD Mean SD
Age 29.94 9.25 30.84 10.3 0.35
BMI 22.41 3.84 22.2 4.55 0.61
PSCP 16.95 8.04 14.82 7.01 0.005 PACS 11.29 4.44 10.25 4.59 0.021
BD 0.36 1.37 0.43 1.23 0.59
RSE 5.59 4.43 6.12 4.48 0.23
BEA 26.7 6.4 27.23 6.15 0.4
BEAT 16.33 4.10 16.14 3.8 0.63
BEW 24.06 6.56 24.94 6.2 0.16
BMI: Body mass index; PSCP: Perceived Socio-Cultural Pressure; PACS: Physical Appearance Comparison Scale; BD: Body Dissatisfaction; RSE: Rosenberg Self-Esteem; BEA, BEAT, and BEW are three aspects of body steam.
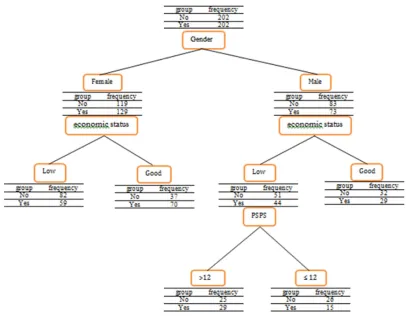
Variables contributed in construction of the tree were gender, economic status, and PSPS (Figure 1). In total, 5 terminal nodes were defined. Majority of females in low economic status did not experience surgical procedures (82 out of 141). On the other hand, 65% of females who were in high economic group experienced the surgical procedure (70 out of 107).
Figure 1. The classification and regression tree on whole data
At each node, the group with the highest percentage was considered as the predicting group.
Once the whole dataset was used as training and testing, sensitivity was 60%. About 13% reduction was seen in test set (52% versus 60%). Bagging was able to produce statistics, at 55%, which was closer to the one produced in test set. Results were the same in terms of specificity and overall accuracy (Table 3). Six percentage point difference between accuracy statistics derived from training and test sets observed (59% vs. 53%). However, this difference was halved when bagging was applied (56% versus 53%).
Table 3. Comparing the results of the Bagging model and the classification and regression tree (CART) Performance
assessed on
Sample Size
Sensitivity (%)
Specificity (%)
Accuracy (%)
Training set 404 60 58 59
Training set 202 60 58 59
Test set 202 52 54 53
Bagging sets 404*
55 56 56
* In each of 100 Tree-based models (TBM) models.
Discussion
Using one single dataset to fit the model and to assess its performance leads to over optimized statistics. In this study, we addressed whether bagging methods can correct this over optimization. According to our findings, when training and test sets were the same, the overall accuracy of CART model was 59%. This figure was reduced to 53% when the performance was checked on a test set. Bagging provided statistics which was close to the values derived on test set. Similar conclusions were made in terms of sensitivity and specificity.
whole data, and 70.2% for the decision tree model with the whole data (24).
Sabzevari et al. compared the performance of CART model and bagging. This study was carried out with 250 observations as training dataset and 70 as test dataset. The results of this study indicated that the accuracy for training dataset in CART model was 76%, and for test dataset it was 69%. However, the prediction accuracy for the bagging model was observed to be 72% for the test dataset (25).
A study was carried out by Mochizuki and Murakami to compare the accuracy of tree models in classification of maps for environmental lands in Niigata, Japan. It was demonstrated that CART model has a poor performance compared with data mining models such as bagging. The total accuracy of CART model was reported 57% for the test dataset and 65% for bagging model with 500 bootstrap samples (26).
Tan and Gilbert carried out a study for cancer classification, in which bagging and decision tree methods were used on 7129 genes. Also, 10-fold cross-validation was used to evaluate models’ performance. The accuracy of bagging model and decision tree model were both observed to be 91% (27).
In a study by Hu et al., 12533 observations were done about lung cancer to compare decision tree model and bagging model. The performance evaluation of the fitted models was carried out by the 10-fold cross-validation. The estimated accuracy of decision tree model and bagging model were 95% and 97%, respectively (28).
Sujatha and Usha Rani compared the classification performance of CART tree model and bagging model in 339 patients suffering from tumors and 10-fold cross-validation was used to evaluate models’ performance. CART model accuracy was 75% while the accuracy of bagging model was 80% (29).
Asha et al. compared classifying methods related to tuberculosis such as bagging and decision trees, which classified this disease in 700 patients into two groups: pulmonary tuberculosis (PTB) and retroviral PTB. In this study, the accuracy of decision trees classification was evaluated by 10-fold
cross-validation, which revealed the accuracy for bagging algorithm to be 98% and for decision tree to be 92% (30).
Jelinek et al. compared the decision tree and bagging for diagnosis of coronary autonomic neuropathy using a sample of 2500 patients. The 10-fold cross-validation was applied in order to avoid over fitting. The resulting accuracies of decision tree and bagging were 96% and 98%, respectively (31).
Salari et al. conducted a study on 809 people to classify acute coronary syndrome. Dividing the data to form training and test datasets was repeated 1000 times. Bagging model was applied with 1000 bootstrap samples. The total prediction accuracy of the decision tree for the test dataset was 76%, and that of bagging was 81% (32).
Alizadeh et al. compared the data mining algorithms for diagnosis of coronary artery disease in 303 patients. To evaluate the models, the 10-fold cross-validation was applied. Their findings indicate that the diagnosis of left anterior descending artery stenosis by bagging algorithm is more accurate, which is 76% for bagging and 73% for decision tree (33).
Tree models are method which provide different results if we use their results on independent data. The advantage of using bagging algorithm over decision tree is that the results obtained from bagging model are close to future results obtained from independent data by the same model. Thus bagging model produces more consistent results.
For further studies, it is recommended that if the size of data is large, combined tree models such as bagging will definitely provide better and more general results. In studies with small sample sizes, cross-validation can refine the results. In the present study, other variables could also be entered into the model, in which case, if these variables were correct and precise, better results could be expected about reasons for tendency toward cosmetic surgery.
Acknowledgments
We sincerely thank Dr. Beverly K. Mendelson, Dr. Eric Stice, and Dr. Kevin Thompson for giving us the opportunity of using their questionnaires.
References
1. Altman DG, Lyman GH. Methodological challenges in the evaluation of prognostic factors in breast cancer. Breast Cancer Res Treat 1998; 52(1-3): 289-303.
2. Haybittle JL, Blamey RW, Elston CW, Johnson J, Doyle PJ, Campbell FC, et al. A prognostic index in primary breast cancer. Br J Cancer 1982; 45(3): 361-6.
3. Todd JH, Dowle C, Williams MR, Elston CW, Ellis IO, Hinton CP, et al. Confirmation of a prognostic index in primary breast cancer. Br J Cancer 1987; 56(4): 489-92. 4. Galea MH, Blamey RW, Elston CE, Ellis IO.
The Nottingham Prognostic Index in primary breast cancer. Breast Cancer Res Treat 1992; 22(3): 207-19.
5. Balslev I, Axelsson CK, Zedeler K, Rasmussen BB, Carstensen B, Mouridsen HT. The nottingham prognostic index applied to 9,149 patients from the studies of the Danish Breast Cancer Cooperative Group (DBCG). Breast Cancer Res Treat 1994; 32(3): 281-90.
6. Baneshi MR, Warner P, Anderson N, Tovey S, Edwards J, Bartlett JM. Can biomarkers improve ability of NPI in risk prediction? A decision tree model analysis. Iran J Cancer Prev 2010; 3(2): 62-74.
7. Therneau TM, Atkinson EJ, Foundation M. an introduction to recursive partitioning using the RPART routines [Online]. [cited 2015 Jun 29]; Available from: URL: https://cran.r-project.org/web/packages/rpart/vignettes/long intro.pdf
8. Dannegger F. Tree stability diagnostics and some remedies for instability. Stat Med 2000; 19(4): 475-91.
9. Steyerberg EW, Harrell FE, Jr., Borsboom GJ, Eijkemans MJ, Vergouwe Y, Habbema JD. Internal validation of predictive models:
efficiency of some procedures for logistic regression analysis. J Clin Epidemiol 2001; 54(8): 774-81.
10. Sutton CD. Classification and regression trees, bagging and boosting. In: Rao CR, Wegman EJ, Solka JL, Editors. Handbook of statistics: data mining and data visualization. Philadelphia, PA: Elsevier; 2005. p. 303-29. 11. Garrusi B, Garousi S, Baneshi MR. Body
image and body change: Predictive factors in an Iranian population. Int J Prev Med 2013; 4(8): 940-8.
12. Al-Sendi AM, Shetty P, Musaiger AO. Prevalence of overweight and obesity among Bahraini adolescents: a comparison between three different sets of criteria. Eur J Clin Nutr 2003; 57(3): 471-4.
13. Thompson JK, Heinberg L, Tantleff S. The Physical Appearance Comparison Scale (PACS). Behav Ther 1991; 14: 174.
14. Keery H, Boutelle K, van den Berg P, Thompson JK. The impact of appearance-related teasing by family members. J Adolesc Health 2005; 37(2): 120-7.
15. Shapurian R, Hojat M, Nayerahmadi H. Psychometric characteristics and dimensionality of a Persian version of Rosenberg Self-esteem Scale. Percept Mot Skills 1987; 65(1): 27-34.
16. Mendelson BK, Mendelson MJ, White DR. Body-esteem scale for adolescents and adults. J Pers Assess 2001; 76(1): 90-106.
17. Stice E, Bearman SK. Body-image and eating disturbances prospectively predict increases in depressive symptoms in adolescent girls: a growth curve analysis. Dev Psychol 2001; 37(5): 597-607.
18. Stunkard AJ, Sorensen T, Schulsinger F. Use of the Danish Adoption Register for the study of obesity and thinness. Res Publ Assoc Res Nerv Ment Dis 1983; 60: 115-20.
19. Fallon AE, Rozin P. Sex differences in perceptions of desirable body shape. J Abnorm Psychol 1985; 94(1): 102-5.
21. Baneshi MR, Talei AR. Multiple imputation in survival models: applied on breast cancer data. Iran Red Crescent Med J 2011; 13(8): 544-9.
22. Wilkinson L. Tree structured data analysis: AID, CHAID and CART [Online]. [cited 1992]; Available from: URL: http://qpsy.snu.ac.kr/teaching/bigdata/ref1.pdf 23. Frank E. Pruning decision trees and lists.
Hamilton, New Zealand: University of Waikato; 2000.
24. Edeki CH, Pandya SH. Comparative study of data mining and statistical learning techniques for prediction of cancer survivability. Mediterr J Soc Sci 2012; 3(14): 49-56.
25. Sabzevari H, Soleymani M, Noorbakhsh E. A comparison between statistical and Data Mining methods for credit scoring in case of limited available data. Proceedings of the 3rd CRC Credit Scoring Conference; 2007 Edinburgh, UK.
26. Mochizuki S, Murakami T. Accuracy comparison of land cover mapping using the objectoriented image classification with machine learning algorithms. Proceedings of the 33rd Asian Conference On Remote Sensing; 2012 Nov 26-30; Pattaya, Thailand. 27. Tan AC, Gilbert D. Ensemble machine
learning on gene expression data for cancer classification. Appl Bioinformatics 2003; 2(3 Suppl): S75-S83.
28. Hu H, Li J, Wang H, Daggard G., Shi M. A maximally diversified multiple decision tree algorithm for microarray data classification. Proceedings of the workshop on Intelligent systems for bioinformatics; 2006 Dec 4; Hobart, Australia.
29. Sujatha G, Usha Rani K. An experimental study on ensemble of decision tree classifiers. International Journal of Application or Innovation in Engineering & Management 2013; 2(8): 300-6.
30. Asha.T, Natarajan S, Murthy KN. A data mining approach to the diagnosis of tuberculosis by cascading clustering and classification. J Comput 2011; 3(4).
31. Jelinek HF, Abawajy JH, Kelarev AV, Chowdhury MU, Stranieri A. Decision trees and multi-level ensemble classifiers for neurological diagnostics. AIMS Medical Science 2014; 1(1): 1-12.
32. Salari N, Shohaimi S, Najafi F, Nallappan M, Karishnarajah I. Application of pattern recognition tools for classifying acute coronary syndrome: an integrated medical modeling. Theor Biol Med Model 2013; 10: 57.