Iranian Journal of Electrical and Electronic Engineering, Vol. 15, No. 3, September 2019 294
Trust Classification in Social Networks Using Combined
Machine Learning Algorithms and Fuzzy Logic
M. Naderan*(C.A.), E. Namjoo** and S. Mohammadi*
Abstract: Social networks have become the main infrastructure of today’s daily activities of people during the last decade. In these networks, users interact with each other, share their interests on resources and present their opinions about these resources or spread their information. Since each user has a limited knowledge of other users and most of them are anonymous, the trust factor plays an important role on recognizing a suitable product or specific user. The inference mechanism of trust in social media refers to utilizing available information of a specific user who intends to contact an unknown user. This mostly occurs when purchasing a product, deciding to have friendship or other applications which require predicting the reliability of the second party. In this paper, first the raw data of the real world dataset, Epinions, is examined, and the feature vector is calculated for each pair of social network users. Next, fuzzy logic is incorporated to rank the membership of trust to a specific class, according to two-, three- and five-classes classification. Finally, to classify the trust values of users, three machine learning techniques, namely Support Vector Machine (SVM), Decision Tree (DT), and k-Nearest Neighbors (kNN), are used instead of traditional weighted sum methods, to express the trust between any two users in the presence of a special pattern. The results of simulation show that the accuracy of the proposed method reaches to 91%, and unlike other methods, does not decrease by increasing the number of samples.
Keywords: Trust Inference, Social Networks, Feature Vector, Fuzzy Logic, Epinions.
Highlights1
1. Presenting new feature values for trust classification in a real-world data set, Epinions;
2. Addressing the three classification algorithms, SVM, decision tree and KNN, for trust classification instead of traditional weighted sum formula; 3. Combining the fuzzy logic together with two, three
and five-class classification for more realistic modelling of trust.
Iranian Journal of Electrical and Electronic Engineering, 2019. Paper first received 10 October 2018 and accepted 01 February 2019. * The authors are with the Department of Computer Engineering, Faculty of Engineering, Shahid Chamran University of Ahvaz, Ahvaz, Iran.
E-mails: [email protected] and
** The author is with the Department of Electrical Engineering, Faculty of Engineering, Shahid Chamran University of Ahvaz, Ahvaz, Iran.
E-mail: [email protected]. Corresponding Author: M. Naderan.
1 Introduction
OWADAYS, millions of users around the world are connected by means of social networks, such as Facebook, Twitter, and Weibo. In fact, the number of users in these networks is increasingly growing despite some of them may have decrease in the number of active users, as shown in Fig. 1. On the other hand, users exchange huge amounts of information in social networks every day; based on the level of trust factor is one of the most important issues. For example, when choosing a book to read, we may choose a book that we know its writer, or a book that is suggested by someone who we trust in. Similar cases happen in social networks especially when the interaction with unknown users, who are not endorsed by other users, increases the risks. Hence, users in social networks share information with other users according to their trust in them. Due to the dimensions of social networks, the number of users that are unknown to a specific user is very high, and studying and evaluating trust between users in social
N
Iranian Journal of Electrical and Electronic Engineering, Vol. 15, No. 3, September 2019 295
Fig. 1 Number of social network users worldwide from 2010 to 2021 (in billions) [6].
networks is an important challenge.
From the psychological and sociological perspectives, trust refers to the subjective expectation about the behavior of another person in future [1]. Without trust, life would rapidly become chaotic [2]. Trust measures the confidence in entities behaving in an expected manner [3].
Numerous activities related to e-commerce are carried out in social networks, in which trust plays an important role in decision making of customers [4]. Suggestion by a friend is a common service that has been provided by almost all of the social networks, and evaluation of trust between users improves the quality of suggestions [5]. Another important point is that the huge amount of sensitive contents on Web makes the security of personal information of users a necessity. Using the trust based on access control, the privacy of users could be protected [7]. All of these points imply the importance of trust evaluation.
Based on the environment, trust could have different attributes. However, in most cases, especially in distributed environments, and in social networks, it follows certain properties that are illustrated in Fig. 2. Generally, previous works in trust could be categorized on three criteria [8] (Fig. 3):
(i) trust information collection; (ii)trust value evaluation; (iii) trust value dissemination.
Each of them could have their subcategories. Trust information collection has three subcategories: attitudes, behaviors, and experiences. Trust value assessment could be classified based on their data models into graph, user interaction and hybrid methods. Trust value dissemination could be divided into trust-based recommendation and visualization models [8].
Since in Fig. 3, the second category, trust value assessment, is the most important category in the trust inference methods, it will be described in more detail. To model the trust, numerous techniques have been employed, namely statistical and machine learning
Fig. 2 The properties of trust [8].
Fig. 3 Categorization of previous works in the trust field [8].
techniques, techniques based on heuristics, and techniques based on behavior.
The statistical and machine learning methods focus on presenting a mathematical model for trust. Heuristic methods try to build a practical model to implement trust systems. The behavior-based models focus on behaviors of users in the society.
The machine learning solutions, such as artificial neural networks, and hidden Markov model have also been used to calculate and predict trust. By analyzing the patterns of the input data, and building a model, machine learning methods are very flexible in evaluating the test data. Furthermore, different classifiers are proper solutions to classify the trust in social networks.
However, in some of the previous work, such as [14], [16], and [20], to calculate trust, for each feature present in the feature vector, a weight is chosen and then using a
Iranian Journal of Electrical and Electronic Engineering, Vol. 15, No. 3, September 2019 296 formula, the approximate value for trust is obtained. The
weight of each factor reflects its importance, and getting proper values for the weights of factors to have the best result is a very daunting task.
On the other hand, different datasets have been used for trust evaluation of users in social networks, and each has its own advantages and disadvantages. A table comparing the most used datasets in trust evaluation studies is provided later in this paper, in Section 5. However, choosing the proper dataset such that its generality enables us a comparison with other methods, is a challenging problem. In addition, features provided by each dataset is different from other ones, which causes different approaches for evaluation of the final trust. Therefore, datasets without complexities and having basic primitive features are better choices for the trust evaluation problem. A final note about the dataset remains with its reality, where datasets from real social network sites are more interesting. In this paper, a real social network is used which contains all the mentioned characteristics.
The proposed method in this paper, extracts the feature vector from a dataset of raw information after pre-processing. This feature vector is fed into a classifier, and the extra information have been removed from it. For a better granularity, the trust value in feature vectors are converted into fuzzy values using membership functions. The trust value is converted in three phases into fuzzy values with two-, three- and five-classes classification.
Then, using machine learning techniques, the model of input data is obtained. The training data are fed into the classifier to get the proposed model, and then, the trained model could be used for testing, meaning to classify the test data into two classes of “trust” and “no trust”, or three or five classes of trust. To this end, three machine learning methods are incorporated, and the results for the data with two classes, three classes, and five classes are shown.
The reason of fuzzification of trust values is that there are different trust levels for various applications. For example, if the trust degree of user 1 to user 2 is medium, user 1 may trust user 2 in suggestion of buying a book, but may not trust him in secret chats or in important questions. As another example, user 1 may trust user 2, and user 2 may trust user 3. Then, user 1 may trust user 3, or the trust degree of user 1 to user 3 may be a function of trust degrees of user 1 to user 2, and user 2 to user 3. In short, despite fuzzification of trust does have its own costs, it leads to more accurate values useful in different applications, and can make the trust in social networks more similar to the real world. In summary, the contributions of this paper are as follows:
(i) using hybrid methods (graph structure of the network and interactions of the users) for a better performance;
(ii)using a dataset with basic and limited information,
because evaluating trust with datasets with comprehensive information is much simpler and yields better results, but datasets such as the one used in this paper are more challenging; however, the processing speed of these methods are very high;
(iii) extraction of new feature based on the dataset by processing the basic features; in fact, the proposed features in this paper are not present in the previous works to the best of our knowledge; (iv) using machine learning methods for evaluating
trust instead of using weighted sums, to obtain a model that can decide whether there is trust or not, based on the feature vector; in this research, three methods are used for obtaining reliability, namely support vector machine, decision tree, and k-nearest neighbors;
(v)using fuzzy logic for a better assignment of trust into fuzzy values in two, three, and five classes; since trust is not necessarily binary, and in real world, there are various degrees of trust between users.
The rest of this paper is as follows: in Section 3, the preliminaries and basic concepts are presented; in Section 4, the proposed method is described and the dataset structure is discussed; in Section 5, the results of simulation are reported and compared to other methods, and Section 6 concludes the paper and contains suggestions for future works.
2 Related Works
According to Fig. 3, trust value evaluation is the widest area of investigation for trust in social networks. In this section, a more detailed description is provided. In [1], machine learning methods have been used. The authors realized the trust evaluation as a classification problem, and present an approach based on machine learning. One of the disadvantages of this paper is that by increasing the number of instances, the accuracy decreases, and this is a challenge for complex and big networks. Hence in this paper, we attempt to solve the problem of decreasing accuracy when the number of instances increases.
Golbeck in [8], presented Tidal trust for inference of trust in web-based social networks. In this algorithm, binary trust is used which means a user either has trust to another user or not. His goal was to extract trust based on similarities of user profiles. Golbeck proved that there exists relations between users with similar profiles and the trust among them. In addition, he extracted indirect trust among users which are not directly connected in the social network graph. An important disadvantage of this work was the binary definition of trust, since more values are needed to a better modeling of trust than just 0-1.
Adali et al. in [9], evaluated trust according to the behavioral connection of users of social networks. They
Iranian Journal of Electrical and Electronic Engineering, Vol. 15, No. 3, September 2019 297 defined behavioral trust based on conversation trust and
propagation trust. Conversation trust refers to the period of time that two users have connections with each other; the longer and the more a connection, the more the trust between these users. To compute propagation trust between two users, the volume of information exchanged between them is a main measure and implicitly for the user who propagates the information. Buskens in [10], extended the tidal trust in [8], such that the new approach includes ranking both trust and reliability. The advantage of their proposal is considering the quantity and period of interaction among users which consists of important information. On the other hand, the graph structure is incomplete for presenting lower levels of trust.
Lesani and Bagheri in [11], proposed the fuzzy inference of trust. Their algorithm extarcts trust for two users even if they are not directly connected to each other. Despite the method is promising in assigning fuzzy values to trust but it is not applicable for newfound social netwroks.
Nepal et al. in [12], presented the STrust model for social trust calculation according to interactions inside the social network. Their model consists of two types of trust: popularity of trust, which refers to the level of acceptability and admissibility of a user in the network (how much this user is reliable from the view of other users) and interaction of trust, which refers to the level of contribution of a user in the network. In general, a framework for constructing trust communities based on model which relies on social assets is presented. Trifunovic et al. in [13], proposed a social model for trust in opportunistic networks, which excite users to contribute in social interactions via applications such as content distribution and microblogs. The authors used two definitions for evaluation of trust: implicit and explicit social trust. The explicit trust is based on conscious relations. When two users are in interaction with each other, their friends’ lists are exchanged with one another and saved in friendship graphs. The trust is calculated according to the friendship graph and assigned to the direct link of the friend which has the most value of trust. Implicit trust between two users is defined according to the value and duration of the relation between them, which is calculated based on two parameters: familiarity and similarity of nodes. In this model, the explicit trust is computed according to the structural features of the network, while implicit trust is computed based on interactions of the network graph. The disadvantage of this method is that it only considers the value and duration of the relations while the spirit and nature of the relation is also important. Since, if two users have a considerable amount of relation with each other but their relation is negative, it does not mean necessarily that they trust each other.
Zhan and Fang in [14], calculated trust based on three aspects: similarity of profiles, reliability of information and social comments. The advantage of their method
which stays inside the hybrid categories is that various aspects of trust is considered. On the other hand, the final value of trust is computed according to a weighted linear sum of all factors, such that the weight of each factor reflects its importance. Reaching good values for weights which results in better final values is a hard task. Despite the accomplished values can be a reference for the trust values, they may not match with users’ expectations and hard for them to believe, since trust is a heuristic and mental concept.
Alam and Paul in [15], defined trust and celebrity in social networks according to web-based environments. The authors defined direct, indirect and world-wide trust, and applied some important factors such as distance of trust path and acceptability of service, which have not been considered in previous work.
Amer-yahia in [16], studied the problem of item recommendations to group users. They used the sum of point’s strategy, which is similar to the weighted sum over all factors. On the other hand, instead of using a direct formula, they used machine learning methods for recognition of input patterns. Machine learning methods have a high level of adaptability in testing samples in the test phase.
Similar to [14] and [16], the authors in [20] have calculated the trust value with a weighted sum of features present in the feature vector. Then using a formula, the approximate value for trust is obtained. The weight of each factor reflects its importance, and getting proper values for the weights of factors to have the best result is a very daunting task.
In [21], a novel and complex method is proposed to obtain the trust chain based on the 1-hop trust (the trust between users that are directly in contact). The authors have used Facebook and INFOCOM 2006 datasets, and have also presented a mathematical analysis to prove their method.
On the other hand, different datasets have been used for trust evaluation of users in social networks, and each has its advantages and disadvantages. One of these datasets is based on a real social network, namely Epinions [17]. In this paper, it is used due to its proper structure for extracting features which are also general in other datasets. In the epinions website, people could review the products. They could sign up for free, and write subjective texts about various products such as software, music, TV shows, hardware, and office supplies.
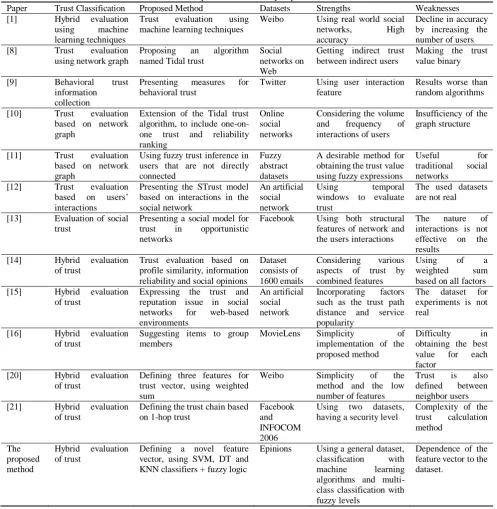
As a final note, the previous works investigated in this section about trust are summarized in Table 1 to avoid lengthy details, in addition to the proposed method at the end of this table.
3 Preliminaries
Since in this research, three classifiers (support vector machine, decision tree, and k-nearest neighbors) are used, in the following, each of them will be described in
Iranian Journal of Electrical and Electronic Engineering, Vol. 15, No. 3, September 2019 298
Table 1 A comparison and summary of previous works.
Paper Trust Classification Proposed Method Datasets Strengths Weaknesses [1] Hybrid evaluation
using machine learning techniques
Trust evaluation using machine learning techniques
Weibo Using real world social networks, High accuracy
Decline in accuracy by increasing the number of users [8] Trust evaluation
using network graph
Proposing an algorithm named Tidal trust
Social networks on Web
Getting indirect trust between indirect users
Making the trust value binary
[9] Behavioral trust information collection
Presenting measures for behavioral trust
Twitter Using user interaction feature
Results worse than random algorithms
[10] Trust evaluation based on network graph
Extension of the Tidal trust algorithm, to include one-on-one trust and reliability ranking
Online social networks
Considering the volume and frequency of interactions of users
Insufficiency of the graph structure
[11] Trust evaluation based on network graph
Using fuzzy trust inference in users that are not directly connected
Fuzzy abstract datasets
A desirable method for obtaining the trust value using fuzzy expressions
Useful for
traditional social networks
[12] Trust evaluation based on users’ interactions
Presenting the STrust model based on interactions in the social network
An artificial social network
Using temporal windows to evaluate trust
The used datasets are not real
[13] Evaluation of social trust
Presenting a social model for trust in opportunistic networks
Facebook Using both structural features of network and the users interactions
The nature of interactions is not effective on the results
[14] Hybrid evaluation of trust
Trust evaluation based on profile similarity, information reliability and social opinions
Dataset consists of 1600 emails
Considering various aspects of trust by combined features
Using of a weighted sum based on all factors [15] Hybrid evaluation
of trust
Expressing the trust and reputation issue in social networks for web-based environments
An artificial social network
Incorporating factors such as the trust path distance and service popularity
The dataset for experiments is not real
[16] Hybrid evaluation of trust
Suggesting items to group members
MovieLens Simplicity of implementation of the proposed method
Difficulty in obtaining the best value for each factor
[20] Hybrid evaluation of trust
Defining three features for trust vector, using weighted sum
Weibo Simplicity of the method and the low number of features
Trust is also defined between neighbor users [21] Hybrid evaluation
of trust
Defining the trust chain based on 1-hop trust
Facebook and INFOCOM 2006
Using two datasets, having a security level
Complexity of the trust calculation method
The proposed method
Hybrid evaluation of trust
Defining a novel feature vector, using SVM, DT and KNN classifiers + fuzzy logic
Epinions Using a general dataset, classification with machine learning algorithms and multi-class multi-classification with fuzzy levels
Dependence of the feature vector to the dataset.
brief.
3.1 Support Vector Machine
The support vector machine method is one of the supervised learning methods with is used for classification and regression [1]. This method has been shown to have a better performance than older methods, such as perceptron neural networks. The goal of these methods is to find and distinguish complicated patterns in data (using clustering, classification, ranking, data cleaning, etc.)
This method assumes that the classes can be separated
linearly, and makes hyperplanes with the highest support to distinguish classes. In the case that the data could not be separated linearly, data are mapped into another space with higher dimensions, to be able to separate them linearly. When there are n dimensions, the equation for the separation line is as follows:
0
0
n
i i i
w X b
(1)We draw two border planes, parallel to the classification plane, and push them far from each other
Iranian Journal of Electrical and Electronic Engineering, Vol. 15, No. 3, September 2019 299 in order to clash with the data. The classification plane
with more distance with the border planes is the best separator.
3.2 Decision Tree
Decision tree is a method for approximating the objective functions with discrete values [22]. This method can handle noises well, and can learn disjunctive combination of conjunctive statements. The decision tree is a tree in which the instances are classified in such a manner that the tree is grown from downwards the root, and finally ends in leaves.
Also, the instances are ordered based on their feature values. Each node in the decision tree represents a feature in instances that are to be classified, and each branch represents the value that the node can have. Instances are classified starting from the root, and their ordering is based on their feature values. The feature that can classify the training data better than the others is considered as the root. Then, a similar process is repeated on each section of training data. Hence, the decision tree analyzes the input data to find the best features for a split in nodes. In each node, features are analyzed and the feature that minimizes the entropy is selected.
3.3 K-Nearest Neighbors
The k-Nearest Neighbors method (k-NN), is a supervised classifier, like Naïve Bayes [23]. The accuracy of this algorithm is highly dependent to the value of k. If k is set too high, irrelevant data will be taken into account and thus, the accuracy will decrease. If k is set too low, such as k=1, the one neighbor that will be considered may be noise, and hence, the test data may be labelled incorrectly. In other words, if k is low, the information will be local, and if k is high, the information will be global. For example, consider a neighborhood in which we want to predict if a certain family is rich or poor. For this problem, we set k to 3, hence, it is 3-NN.
3-NN works in a way that considers three neighbors that have are the most highly related families. The relation between families is not necessarily the geographic proximity, but means relational proximity. To compute the proximity, various measures could be considered, of which the simplest is the Euclidean distance. If after calculating the Euclidean distance, we conclude that two neighbors are rich and one is poor, the 3-NN algorithm predicts the family as rich.
In k-NN, to predict the label of a new instance, its Euclidean distance to all of the instances should be calculated. Then, we take the k nearest neighbors and predict its label based on them. Algorithms like k-NN are called instance-based or lazy learners, because:
1) There are no models in these methods to apply to our data. The data should be always available to classify new instances. Hence, it is called
instance-based.
2) There is no training and testing in this algorithm, and the classification is accomplished in one phase. Thus, it is called lazy.
The advantage of k-NN is that it does not restrict itself to a specific model, and hence, if the data do not follow a certain model, it will not matter. The disadvantage of this method is the high number of calculations. However, it works well in different situations.
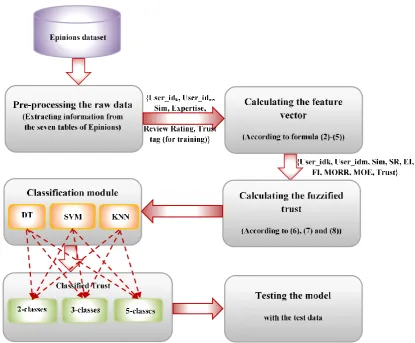
4 The Proposed Method
Fig. 4 demonstrates the state diagram of the proposed paper. In the following, each of the phases will be explained in detail:
(1)Preprocessing the raw data of the dataset;
(2)Calculating the features for the feature vector and for each pair of users;
(3)Calculating the fuzzy trust values;
(4)Training and classification using decision tree, support vector machine and kNN;
(5)Evaluation of the proposed system by the test samples.
4.1 The Data Set and Preprocessing
In the first phase, the raw data are preprocessed, in such a way that they could be mapped into a feature vector using the formulas that are presented later in this paper.
A number of well-known datasets related to the trust factor in social networks are available for researchers, some of which are presented in Section 4 and investigated in this research. These datasets have different features, for example the number of users, the number of opinions or reviews, …. Accordingly, the Epinions dataset that we have used in our paper has the highest number of opinions (reviews) and therefore is one of the richest dataset in this sense. This dataset is easy to download and available, and its simple and partial structure has made it more understandable compared to other ones.
Another reason for choosing Epinions dataset is that the features taken from this dataset are general and hybrid ones which could also be calculated for other datasets as well. In fact, choosing the dataset with hybrid properties, such that the feature vector could be calculated for it is of great importance. The final factors in choosing a dataset is having the “trust” label that we need in training and testing phases using machine learning methods.
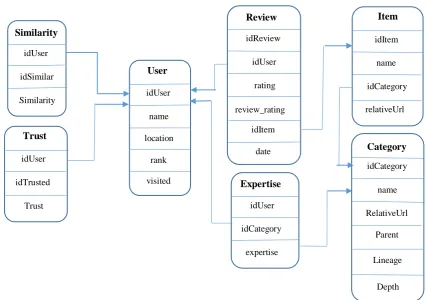
The Epinions dataset contains seven tables (Fig. 5) and each table includes a number of properties. The raw data in the dataset need to be preprocessed in order to get usable.
In the Epinions website [17], users could review various products, could sign up for free and write subjective reviews about products such as software, music albums, TV shows, hardware, and office supplies.
Iranian Journal of Electrical and Electronic Engineering, Vol. 15, No. 3, September 2019 300
Fig. 4 State diagram of the proposed method.
One of the interesting properties of Epinions is that users could rate review helpfulness. The ratings of each user has been stored alongside their profile, friends list, etc. Some of the tables are about the users themselves, such as the User and the Expertise tables, and the others are about the relationship of the user with other users, such as Similarity and Trust tables.
The User table contains personal properties of a user which includes name, location, id, etc.
The Similarity table expresses the similarity of profile of a user to other users of the social network.
The Reviews table contains information about each review. This includes the ratings that a user has assigned to a product, and other information such as product ID and review date. The last property in this table, review_rating, is a property related to a user and a product, and shows that based on other people’s opinions, how much the review that the user has written about the product can be helpful. When a user writes a review about a product and gives a rating to it, the other users can rate him/her review’s helpfulness.
The Expertise table shows that each user has expertise in which fields. The Item and Category tables contain information about the products.
The last table, the Trust table, is the definitive one because it contains the labels of the training data. In this
table it is shown that in reality, each user in this social network trust which users, and does not trust which users. In fact, the trust means the subjective expectation of a person from the future behavior of a person and the trust of user U1 to user U2 is shown as Tr(U1, U2). In this study, the trust value has been considered as binary, in three classes, and in five classes. It should be noted that the label in test instances has been set to 0, and in training instances is between 0 and 1. The feature vector is defined from U1 to U2, and is shown by V(U1, U2) = (f1, f2, …, fk). fi shows the feature value, and
some of these features are related to U2 while the others are related to both users. The incorporated features and a sample of the feature vector will be shown in the results section.
4.2 Feature Vector
To calculate each feature, the data are not incorporated directly from the dataset, but are useful for trust evaluation are combined with other data, leading to the feature vector. Furthermore, only those information that are useful for trust evaluation are incorporated. This results in using less and more efficient data, as the dataset may have various data.
It is desirable that by preprocessing these features, the
Iranian Journal of Electrical and Electronic Engineering, Vol. 15, No. 3, September 2019 301
Fig. 5 Tables of the Epinions dataset, and their relationships.
feature vector could be obtained and then, using the feature vector, the trust value of U1 to U2 could be
calculated.
1, 2
1, 2
T s
Tr U U V U U R (2)
where α is a weight vector for the feature vector. This question means that is there a linear relation between trust value and feature vector? Since the feature vector contains arbitrary features and the trust is a vague and qualitative variable, it seems unlikely. Hence, instead of a linear equation, we need a solution that by using the feature vector, identifies whether U1 can trust U2 or not. For the feature vector, seven features are considered that are obtained from the raw features of the dataset, as:
Similarity: It shows the similarity of the profiles of two users. This similarity is calculated using some functions in [18] that is part of the basic information and is obtained from the similarity table.
Sub-ratings: for each of the n products that both users uk and ul have reviewed, the following
formula is calculated in which M is the constant number, 50, and has been obtained by testing various values.
1
n
i k i l
i
M rating u rating u SR
M
(3)The reason of choosing this feature is that when opinions and tastes of two people are more similar, it could be deducted that the trust value between them is much higher. Hence, this feature is calculated such that when the opinions are more similar, the subtraction value will become smaller, and a lower number is subtracted from M, and the numerator will be larger, and hence, the SR value for the pair of users will be higher.
Expertise Intersection: Each user can have expertise in some fields. For calculating this feature, the number of fields that both users have expertise in, is divided to the number of all of the available fields.
1
2
Expertises User Expertises User
total number
(4)
Friends Intersection: The ratio of the mutual friends between two users to the number of friends of both users.
1
( 2)
Friends User Friends User
total number
(5)
When two users have more mutual friends, it could be deducted that these two users are closer, and this leads to a higher value for this feature, thus having a higher trust value.
Mean of Review Ratings (MORR): The mean of Similarity
idUser
idSimilar
Similarity
idUser
idTrusted
Trust
idUser
name
location
idReview
idUser
rating
idUser
idCategory
expertise
idItem
name
idCategory
idCategory
name
RelativeUrl Trust
User
rank
visited
Review
review_rating
idItem
date
Expertise
Item
relativeUrl
Category
Parent
Lineage
Depth
Iranian Journal of Electrical and Electronic Engineering, Vol. 15, No. 3, September 2019 302 review ratings values that are stored for U2. The
code for calculating this feature is presented in the appendix of the paper.
Mean of Expertises (MOE): This feature is the mean value of the expertises of U2. Numbers are assigned based on expertises, in such a way that when the user has a higher expertise in a field, he/she gets a higher number. If the user has higher number of expertises, the value of this feature becomes larger. The code for calculating this feature is presented in the appendix of the paper.
Trust: This shows the real value of trust of U1 to U2, which is a normal value, and the real trust of U1 to U2. For the test instances, this feature shows the value evaluation, and is the label. In the test instances, this value is set to 0. In the next phase, the label value in the feature vector, i.e. the trust evaluation is mapped into a fuzzy value.
In an example, the feature values for a feature vector are as follows:
User-Id1 User-Id2 Sim Sub-ratings (SR)
1000 1005 0.7 0.92
EI FI MORR MOE Trust
0.002 0.032 4.96 1.6 Weak
It should be noted that since trust is asymmetric, the trust of U1 to U2 is not necessarily equal to trust of U2 to U1. However, some of the features in the feature vector
are for both users, such as similarity, sub-ratings, expertise intersection, and friends’ intersection. If the feature vector consists of only these features, the trust evaluation will be symmetric. But in this study, there are MOE, MORR, and trust features that make the trust asymmetric. These features are related to U2 because the
target node is as important as the source node, and the objective is to evaluate the trust of the source node to the target node.
4.3 Fuzzification of Trust Values
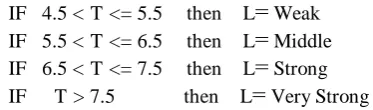
Since it is desirable for trust values not to be binary and trust should be defined with different granularities, the trust values are fuzzified. To this end, two, three, and five classes categories are chosen, for which the membership function is illustrated in Figs. 6-8.
The following fuzzy rules are for two classes: IF T < 6.5 then L = Dis Trust IF T >= 6.5 then L = Trust
The fuzzy rules for trust with three classes are as follows:
IF T < 5 then L=Weak IF 5<= T <= 7 then L=Middle IF T > 7 then L= Strong
And fuzzy rules for trust with five classes are as following:
IF T <
=
4.5 then L= Very WeakIF 4.5 < T <= 5.5 then L= Weak IF 5.5 < T <= 6.5 then L= Middle IF 6.5 < T <= 7.5 then L= Strong IF T > 7.5 then L= Very Strong
4.4 Classification of Instances
The classification phase consists of the three SVM, DT and kNN methods. In fact, classification is tested with these three classifiers to select the best results. The support vector machine used in this study uses a polynomial kernel, in which the parameter C is set to 5 and W is set to 2. In the case with three classes for trust, SVM draws a line to distinguish the samples with high trust from the instances with middle and low trust. In the case with five classes, for example to distinguish the instances with the very high trust, SVM draws a line distinguishing the very high trust instances from the instances belonging to other classes.
The decision tree incorporated in this study has the pruning factor of 0.2, with the minimum number of instances set to 3, and is applied on the training dataset. A part of the resulting tree of running this algorithm with the proposed method with three classes is illustrated in Fig. 9. If the feature value in the feature vector is higher than the label of each of the non-leaf
Fig. 6 Binary membership function for trust.
Fig. 7 Trust membership function with three classes.
Fig. 8 Trust membership function with five classes.
Iranian Journal of Electrical and Electronic Engineering, Vol. 15, No. 3, September 2019 303
Fig. 9 Part of the decision tree obtained from the proposed method.
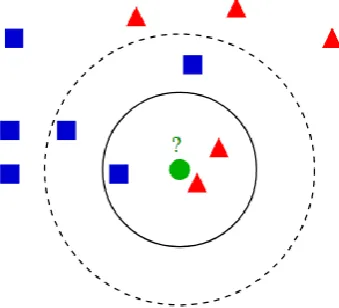
Fig. 10 The k-nearest neighbors in the proposed method.
nodes, the tree will be traversed from right on, and if it is lower, it will be traversed from left on. The tree traversal is repeated until the instance reaches a leaf, which is a trust class.
In the k-nearest neighbors algorithm, k is set to 3, and for obtaining the three nearest neighbors to a certain instance, linear search is incorporated which measure the distance between two points by the Euclidean distance. For example, in Fig. 10, suppose that the green circle is the instance that should be labeled as trust or distrust. The red color depicts trust, and the blue color denotes distrust. In the proposed method, after calculating the distance of the instance from other instances, three instances that are closer based on Euclidean distance are chosen, and since the number of neighbors with the trust label is 2 instances, and the number of instances with the distrust label is 1, the test instance will be labeled as trust.
5 Simulation Results and Comparisons
As mentioned previously, a number of well-known datasets related to the trust factor in social networks are available for researchers, some of which are presented in Table 2 and investigated in this research. This table contains the datasets used by researchers in previous works that were referred to in Table 1. As seen, the Epinions dataset has the highest number of opinions (reviews) which is a key factor in evaluations [17, 18]. Table 3 shows some of the properties of the Epinions dataset.
The Epinions dataset was a set of tables that were stored in one file. To use the tables, they were loaded separately in the MySQL database in the PHPMyAdmin environment. Then, using the C# programming language in Visual Studio 2016, the connection was established with the database. To connect to the database, the ConnectC#ToMySQL library was used. MOE
Sim Rating
0.1
MOE Sim
Rating
0.3
Rating
1.4
Medium
Strong MOE
Strong Medium
Strong Weak
Medium
0.65 1.44 0.8
0.32
Iranian Journal of Electrical and Electronic Engineering, Vol. 15, No. 3, September 2019 304
Table 2 Properties of some datasets used for evaluation of trust.
Dataset Name Context Data type Number of users Number of opinions
Ciao Trust General 7,357 99,746
Epinions Trust General 71,002 104,000
FilmTrust Trust Movies 1,500 35,000
MovieLens Recommender Systems Movies 900 100,000
Facebook Trust General 4,039 88,230
Table 3 Some of the properties of the Epinions dataset.
Number of users 317,755
Number of reviews 1,127,673
Number of users with at least one review 113,629 Number of users that have at least one trust relationship 47,522
Table 4 Results of SVM with trust in two classes. Precision FP Rate TP Rate Class Name 0.69 0.4 0.809 Trust 0.73 0.191 0.6 Distrust 0.71 0.301 0.71 Mean
Table 6 Results of SVM with trust in five classes. Precision FP Rate TP Rate Class Name 0.95 0.004 0.86 Very High Trust
0.89 0.11 0.93 High Trust 0.78 0.10 0.87 Middle Trust 0.83 0.191 0.8 Low Trust 0.92 0.01 0.57 Very Low Trust
0.88 0.08
0.89 Mean
Table 5 Results of SVM with trust in three classes. Precision FP Rate TP Rate Class Name 0.94 0.700 0.65 Low Trust 0.75 0.33 0.93 Middle Trust 0.89 0.04 0.66 High Trust 82/0 19/0 80/0 Mean
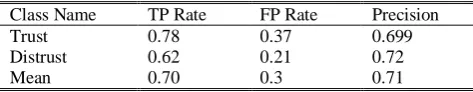
Table 7 Results of decision tree with trust in two classes. Precision FP Rate TP Rate Class Name 0.699 0.37 0.78 Trust 0.72 0.21 0.62 Distrust 0.71 0.3 0.70 Mean
To use the data, they should be transformed into the feature vector. This vector includes features to calculate the trust of U1 to U2. In this paper, using the C# programming language and by reading the data from the dataset, the feature vectors for all of the pairs of users have been obtained. In the next phase, using the feature vector and machine learning methods, the model is obtained.
One of the software packages that has been used in this paper, is the well-known Xampp software. Xampp is a software suite including Apache Server, MySQL, and PHP. It should be noted that in this paper, Apache Server and MySQL were used, and to use MySQL, the online PHPMyAdmin application has been incorporated.
One of the other software packages that were used in this paper is Visual Studio 2016. Using this software and the C# programming language, a connection is established to the MySQL server, and the data for the pairs of users are read, and then the feature vector for them is calculated. Finally, the output file is generated in a way that could be read by the Weka software. The software we have used to implement the classifiers in this study is Weka 6.3 [19].
After calculating the feature vector using the C# codes, the output is saved in a file readable for Weka, and in this stage, the first phase of the method is finished. To obtain 1000 records of data, about 24 hours are needed. Because of the time constraint, the first 1000 records are calculated. The calculation has been
done on a system with a Core i3 processor with the frequency of 2.4 GHz, 3 MB of cache, and 3 Gigabytes of RAM.
Before reporting the results of simulation, the measures for evaluation of the model are introduced:
TP Rate: From the instances selected for testing, the number of instances that have been correctly classified in a certain class, to all of the instances of that class.
FP Rate: From the instances selected for testing, the number of instances that have not been in a certain class but have been incorrectly classified in that class, to all of the instances.
Precision: The most important measure for performance of a classifier is precision, which shows how accurate is a classifier. This is the most well-known and general measure for evaluating the performance of classifiers. It reports the ratio of the correctly classified instances to all of the instances.
The results of implementation of the proposed method by SVM for two, three, and five classes have been shown in Tables 4-6.
The second implemented method is decision tree, with prune factor set to 0.2, and the minimum number of instances set to 3. The results of the decision tree have been reported in Tables 7-9.
Finally, the results of implementation of the method with the 3-nearest neighbors algorithm is reported in Tables 10-12. The reported values are according to the
Iranian Journal of Electrical and Electronic Engineering, Vol. 15, No. 3, September 2019 305
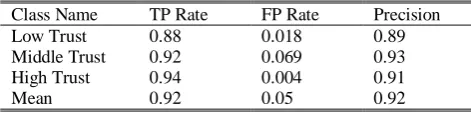
Table 8 Results of decision tree with trust in three classes. Precision FP Rate TP Rate Class Name 0.89 0.018 0.88 Low Trust 0.93 0.069 0.92 Middle Trust 0.91 0.004 0.94 High Trust 0.92 0.05 0.92 Mean
Table 10 Results of 3-nearest neighbors with trust in two classes. Precision FP Rate TP Rate Class Name 0.69 0.4 0.809 Trust 0.73 0.191 0.6 Distrust 0.71 0.301 0.71 Mean
Table 9 Results of decision tree with trust in five classes. Precision FP Rate TP Rate Class Name 0.91 0.014 0.93 Very High Trust
0.94 0.06 0.93 High Trust 0.87 0.05 0.89 Middle Trust 0.85 0.016 0.78 Low Trust 0.75 0.03 0.64 Very Low Trust
0.9 0.05
0.901 Mean
Table 11 Results of 3-nearest neighbors with trust in three classes. Precision FP Rate TP Rate Class Name 0.95 0.01 0.95 Low Trust 0.93 0.134 0.96 Middle Trust 0.92 0.032 0.92 High Trust 0.90 0.1 0.92 Mean
Table 12 Results of 3-nearest neighbors with trust in five classes. Precision FP Rate TP Rate Class Name 0.92 0.009 0.73 Very High Trust
0.87 0.152 0.95 High Trust 0.84 0.06 0.87 Middle Trust 0.71 0.004 0.25 Low Trust 0.1 0.0 0.14 Very Low Trust
0.86 0.01
0.86 Mean
10-fold cross-validation mechanism, and the mean trust value in the case of three classes is reputed as 92%. As the datasets of other baseline and state-of-art methods is different from Epinions, comparison of the results is a hard and nearly impossible task. Despite, some datasets have similar features with Epinions and therefore, we were able to extract the feature vector from their information. In addition, implementations of these methods mostly require parameters or have some ambiguities, which results in incomplete code and reaching different results from the original paper. Finally, the fuzzified values of our proposed method are not comparable with others that have 0-1 results unless we fuzzify their results also. According to these limitations, we were able to compare the proposed method with three other ones presented in [1, 20, 21]. To compare the proposed method, named TI, with TC [1] and AUTrust [20], we need to make AUTrust similar to the two other methods. In this method, trust is a normal number between (0, 1). This interval is divided into two parts, (0, 0.5) and (0.5, 1), in which the first part belongs to distrust, and the second part is for trust. If the AUTrust prediction is in the first interval, it shows distrust, and if it is in the second interval, it shows trust. This way, AUTrust could be compared to the two other methods.
The comparison diagram is shown in Fig. 11. In this comparison, the accuracy (the ratio of instances that are correctly classified to all of the instances) is calculated when the number of instances increases.
In the proposed method (TI), by increasing the number of instances, the accuracy increases, and after a certain point, becomes better than the other methods. It is one of the strengths of TI. The trend of accuracy in
Fig. 11 Comparison of the proposed method with similar methods.
Fig. 12 Comparison of the proposed method and the TBP method.
the proposed method, TI, is upwards, but the trends in the two other methods are downwards. In real social networks with the high number of users, those methods perform better that with larger datasets, yield better accuracy values.
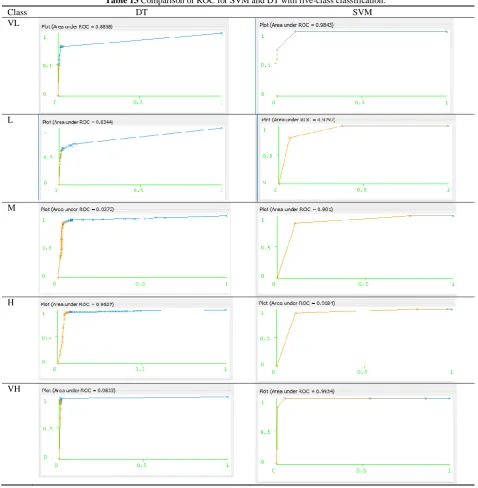
Another important measure for comparison is sensitivity, which is the ratio of the instances that are correctly classified. In Fig. 12, the proposed method (TI) is compared with TBP in [21] based on sensitivity. To have an evaluation metric for the correctness of the results, we have also presented the ROC diagram for the two classifiers, SVM and DT, according to the five-class five-classification. The corresponding diagrams are shown in Table 13.
Iranian Journal of Electrical and Electronic Engineering, Vol. 15, No. 3, September 2019 306
Table 13 Comparison of ROC for SVM and DT with five-class classification.
Class DT SVM
VL
L
M
H
VH
According to the results of this study, we can conclude the following outcomes:
The results of the trust with three classes is better than the results of binary fuzzification in all three classifiers, since it has led to better accuracy, and the data are not overlapped.
The fuzzification to five classes, for SVM, are better than the classification with three classes.
For DT and kNN, the results of fuzzification to three classes outperform fuzzification to five classes.
Among the three classifiers, DT has performed the best in trust classification than the other two methods.
Hence, it could not be deducted that by increasing the number of classes, the results will always improve. In fact, the number of classes should be such that they are large enough to encompass all the details, and they should not be so high that a class is divided into two parts. Therefore, the number of classes is important and effective on the results.
Finally, it is concluded that the best result is obtained by applying decision tree on trust in three classes, and its result, which is 92%, is the best obtained result.
6 Conclusion and Future Works
In this paper, trust evaluation in the Epinions social network has been studied. First, the raw data in the
Iranian Journal of Electrical and Electronic Engineering, Vol. 15, No. 3, September 2019 307 dataset are processed, and then are converted to a
feature vector using the aforementioned equations. The label of the feature vector, i.e. the trust value, is converted to fuzzy values with two, three, and five classes. Finally, the feature vector and labels are fed into three classifiers: support vector machine, decision tree, and k-nearest neighbors to find the pattern of trust and distrust.
One of the advantages of the proposed method is using a feature vector with combined features that contain structural and interactional properties of the network. In addition, in most of the similar studies, a feature vector is incorporated that includes only raw data, but this paper contains a preprocessing stage in which the information are converted into a feature vector. It should be noted that each feature in the feature vector is a combination of raw features of the two users. All of the calculation formulas for the feature vector belong to this study, and the few number of features in this paper is another advantage, which leads to a higher speed, which is desirable in social networks for researchers.
One of the most important suggestions for having a better performance in future works is to define a user interface to obtain the information directly from the social network. However, in this method, people should be accessed directly to give their opinions about other users in the social network to have the label.
Some of the features that are significant in Semantic Web could be effective in trust evaluation, but those are not present in the information obtained from the social networks. In the future works, more focus could be on these types of information and their calculation. Furthermore, since trust evaluation is an important factor in improving recommender systems, we suggest applying the proposed method in this paper on these systems to show its performance.
Appendix
Codes to calculate MORR and MOE features: //MORR
/*
* Review rating levels *
* Show = 1
* Not Yet Rated = 2 * Somewhat Helpful = 3 * Helpful = 4
* Very Helpful = 5 *
*/
string morr_query = "SELECT review_rating FROM review WHERE iduser='" + user2 + "'";
MySqlCommand cmd8 = new
MySqlCommand(morr_query, connection); MySqlDataReader morr_dataReade = cmd8.ExecuteReader();
int MORR_sum = 0;
int morr_num = 0;
while (morr_dataReader.Read()) {
string rr =
morr_dataReader["review_rating"].ToString().Trim(); MORR_sum += getReviewRatingValue(rr);
morr_num++; }
morr_dataReader.Close(); if (morr_num == 0) MORR = 0; else
MORR = (float)MORR_sum / morr_num;
//MOE /*
* Review rating levels *
* advisor = 1 * category leads = 2 * top reviewer = 3 *
*/
int MOEE_sum = 0;
string moee_query = "SELECT * FROM expertise WHERE iduser='" + user2 + "'";
MySqlCommand cmd11 = new
MySqlCommand(moee_query, connection); MySqlDataReader moee_dataReader = cmd11.ExecuteReader();
while (moee_dataReader.Read()) {
string rr =
moee_dataReader["expertise"].ToString().Trim(); MOEE_sum += getExpertiseValue(rr);
}
moee_dataReader.Close(); //typical user
if (MOEE_sum == 0) MOE = (float)0.001; else
MOE = (float)MOEE_sum/500; MOE = (float)MOE * 100;
References
[1] Z. Kang and P. Li, “A machine learning based trust evaluation framework for online social networks,” in IEEE 13th International Conference on Trust, Security and Privacy in Computing and Communications, Beijing, 24-26 Sep. 2014.
[2] Y. Zhang, H. Chen, and Z. Wu, “A social network-based trust model for the semantic web,” in The 6th International Conference on Autonomic and Trusted Computing, Wuhan, China, pp. 183–192, 3-6 Sep. 2006.
Iranian Journal of Electrical and Electronic Engineering, Vol. 15, No. 3, September 2019 308 [3] W. Sherchan, S. Nepal, and C. Paris, “A survey of
trust in social networks,” ACM Computing Surveys, Vol. 45, No. 4, Aug. 2013.
[4] E. K. Clemons, F. Jin, J. Wilson, F. Ren, C. Matt, T. Hess, and N. Koh, “The role of trust in successful ecommerce websites in china: Field observations and experimental studies,” in 46th Hawaii International Conference on System Sciences, pp. 4002–4011, HI, USA, 7-10 Jan. 2013.
[5] P. Massa and P. Avesani, “Trust-aware recommendation systems,” in Proceedings of The ACM Conference on Recommender Systems, Minnesota, USA, pp. 17– 24, 19-20 Oct. 2007.
[6] Statista, “Number of social media users worldwide
from 2010 to 2021,”
http://www.statista.com/statistics/278414/number-of-worldwide-social-network-users.
[7] B. Lang, “Trust degree based access control for social networks,” in International Conference on Security and Cryptography (SECRYPT), Athens, Greece, pp. 1–6, 26-28 Jul. 2010.
[8] J. A. Golbeck, “Computing and applying trust in web-based social networks,” Ph.D. Thesis, University of Maryland at College Park, MD., 2005.
[9] S. Adali, R. Escriva, M. K. Goldberg, M. Hayvanovych, M. Magdon-Ismail, B. K. Szymanski, W. A. Wallace, and G. Williams, “Measuring behavioral trust in social networks,” in IEEE International Conference on Intelligence and Security Informatics (ISI’10), Vancouver, BC, Canada, pp. 150–152, 23-26 May 2010.
[10]V. Buskens, “The social structure of trust,” Social Networks, Vol. 20, No. 3, pp. 265–289, Jul. 1998.
[11]M. Lesani and S. Bagheri, “Fuzzy trust inference in trust graphs and its application in semantic web social networks,” in World Automation Congress (wac), Budapest, 24-26 Jul. 2006.
[12]S. Nepal, W. Sherchan, and C. Paris, “STrust: A trust model for social networks,” in 10th IEEE International Conference on Trust, Security and Privacy in Computing and Communications (TrustCom’11), Changsha, China, pp. 841–846, 16-18 Nov. 2011.
[13]S. Trifunovic, F. Legendre, and C. Anastasiades, “Social trust in opportunistic networks,” in INFOCOM IEEE Conference on Computer Communications Workshops, San Diego, CA, USA, 15-19 Mar. 2010.
[14]J. Zhan and X. Fang, “A novel trust computing system for social,” in IEEE International Conference on Privacy, Boston, MA, USA, 9-11 Oct. 2011.
[15]F. Alam and A. Paul, “A computational model for trust and reputation relationship in social network,” in International Conference on Recent Trends in Information Technology (ICRTIT), Chennai, India, 8-9 Apr. 2016.
[16]S. Amer-Yahia, S. Roy, A. Chawlat, G. Das, and C. Yu, “Group recommendation: Semantics and efficiency,” in Proceedings of the VLDB Endowment, Vol. 2, No. 1, pp. 754–765, 2009.
[17]Epinion, http://www.epinions.com.
[18]S. Meyffret, E. Guillot, L. M´edini, and F. Laforest, “RED: A rich Epinions dataset for recommender systems,” Technical Report at LIRIS UMR CNRS, Nov. 2018.
[19]Weka, https://www.cs.waikato.ac.nz/ml/weka, 2017.
[20]G. Yin, F. Jiang, S. Cheng, X. Li, and X. He, “AUTrust: a practical trust measurement for adjacent users in social network,” in IEEE Second International Conference on Cloud and Green Computing, Xiangtan, China, pp. 360–367, 1-3 Nov. 2012.
[21]L. Guo, C. Zhang and Y. Fang, “A Trust-Based Privacy-Preserving Friend Recommendation Scheme for Online Social Networks”, IEEE Transactions on Dependable and Secure Computing, Vol. 12, No. 4, pp. 413-427, 2015.
[22]J. R. Quinlan, “Induction of decision trees,” Machine Learning, Vol. 1, No. 1, pp. 81–106, 1986.
[23]E. Alpaydin, Introduction to machine learning. 3rd Edition, MIT press, 2014.
M. Naderan received her B.Sc. degree in Computer Engineering in 2004 and the M.Sc. degree in Information Technology in 2006, both from Sharif University of Technology (SUT), Tehran, Iran. She received the Ph.D. degree in Computer Engineering, major in computer networks in Feb. 2012, from Amirkabir University of Technology (AUT), Tehran, Iran. Dr. Naderan joined the Computer Engineering Department of Shahid Chamran University (SCU) in Ahvaz, Iran in Sep. 2012. She was the head of the Computer Engineering department from 2013 to 2015. She is currently the director of the HPC Center in Shahid Chamran University of Ahvaz (SCU-HPCC). She has reviewed papers in several national and international journals and conferences such as VTC, ICC, JNCA, JPDC, J. of Supercomputing and Trans. on Communications. Her research interests include computer networks, wireless and mobile networks, IoT and cloud computing, social networks, object tracking, network optimization, simulation of network protocols and bio-inspired and intelligent methods in networks.
Iranian Journal of Electrical and Electronic Engineering, Vol. 15, No. 3, September 2019 309
E. Namjoo received his Ph.D. degree in Electrical Engineering from University of Tabriz, Tabriz, Iran, in 2011. Since 2011, he joined the Electrical Engineering Department in Shahid Chamran University of Ahvaz, Ahvaz, Iran, as an Assistant Professor and conducted many M.Sc. and Ph.D. students. Dr. Namjoo is the head of the Information Theory and Machine Learning Laboratory in Faculty of Engineering, Shahid Chamran University of Ahvaz. His research interests include statistical pattern recognition, machine learning, information theory algorithms and telecommunications.
S. Mohammadi received her B.Sc. and M.Sc. degrees in Computer Engineering, major in Artificial Intelligence from Shahid Chamran University of Ahvaz (SCU), Ahvaz, Iran in 2013 and 2018, respectively. Her research interests include artificial intelligence, deep learning algorithms and libraries, distributed systems, fuzzy logic and evolutionary methods in networks.
© 2019 by the authors. Licensee IUST, Tehran, Iran. This article is an open access article distributed under the terms and conditions of the Creative Commons Attribution-NonCommercial 4.0 International (CC BY-NC 4.0) license (https://creativecommons.org/licenses/by-nc/4.0/).
![Fig. 2 The properties of trust [8].](https://thumb-us.123doks.com/thumbv2/123dok_us/21035.2002256/2.595.310.543.82.520/fig-the-properties-of-trust.webp)