Electronic Journal of Plant Breeding,
ISSN 0975-928X DOI :
10.5958/0975-928X.2016.00020.X
http://ejplantbreeding.com
145
Genetic divergence in ground nut (Arachis hypogaea L.)
Satyenrda Singh Raghuwanshi, V. H. Kachhadia, J. H. Vachhani*, L. L. Jivani and M. B. Patel Main Oilseeds Research Station, JAU, Junagadh-362 001 (Gujarat).
E-mail:[email protected]
(Received: July 2015; Accepted: September 2015)
Abstract
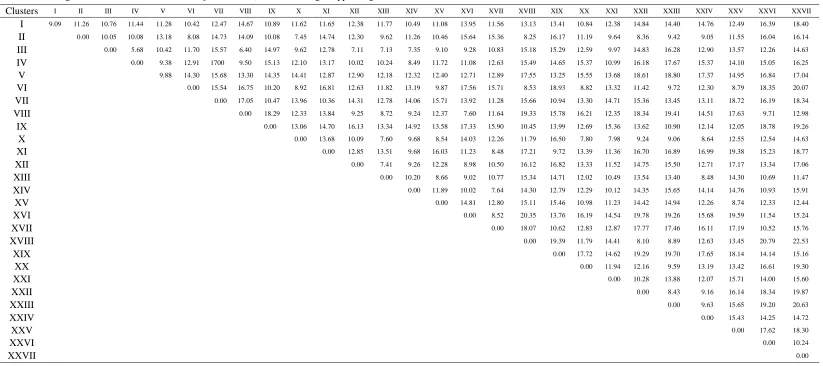
Divergence analysis among fifty groundnut genotypes using Mahalanobis’s D2 statistic grouped into twenty-seven clusters. The maximum inter-cluster distance was found between clusters XXVII and XVIII (D=22.53) followed by clusters XXVI and XVIII (D=20.79) and XXVII and XXIII (D=20.63) indicated that these groups of genotypes were highly divergent from each other. The genotypes in above clusters revealed substantial difference in the means for important yield contributing characters suggesting that the genotypes belonging to these clusters form ideal parents for improvement in groundnut. Keywords: Clusters, genetic divergence, groundnut (Arachis hypogaea L.)
Success of plant breeding programme depends largely on the choice of appropriate parents. It is expected that the utilization of divergent parents in hybridization results in promising recombinants. Genetic improvement mainly depends upon the amount of genetic variability present in the population. To a plant breeder, single character is not of much importance as the combined merit of number of desirable traits becomes more important when he/she is concerned with a complex trait like pod yield. Thus, for improving the pod yield, selection of parents based on number of characters having quantitative divergence is required which can be assessed by D2-statistic developed by Mahalanobis (1936). The use of Mahalanobis’s D2 statistics for estimating genetic divergence had been emphasized by Murty and Arunachalam,1966, because it permits precise comparison among all the population in given any groups before effecting actual crosses, therefore, the present study was carried out to ascertain the nature and magnitude of genetic divergence among the 50 groundnut genotypes, which will help to plan hybridization programme to develop groundnut varieties with high pod yield and high oil percentage.
Fifty genotypes of groundnut were sown in a Randomized Block Design (RBD) with three replications during summer 2014. Each genotype was sown in a single row of 3.0 m length with a spacing of 45 x 15 cm. The experiment was surrounded by two guard rows to avoid damage and border effects. The fertilizers was applied at the rate of 25.0 kg N2 ha
-1
and 50.0 kg P2O5 ha -1
as it is a recommended dose for summer cultivation of groundnut in the region. Other recommended agronomical practices in vogue were followed for reaping good crop. Data were recorded on randomly selected five plants from each genotype and average value was used for the statistical analysis for sixteen characters viz., days to 50%
flowering, days to maturity, plant height, number of primary branches per plant, number of mature pods per plant, sound mature kernel, pod yield per plant, pod weight, kernel yield per plant, 100-kernel weight, biological yield per plant, shelling out-turn, harvest index, oil content and protein content. The data was subjected to analysis of genetic divergence using Mahalanobis (1936) as described by Rao (1952).
The significant mean squares due to genotypes suggested the preface of ample variability. The D2 -values between all possible pairs indicated the presence of greater diversity among the genotypes for all the traits.
Composition of clusters:
146
Inter and intra cluster distances (D= ):
The maximum inter-cluster distance varied from 5.68 (cluster III and IV) to 22.53 (cluster XXVII and XVIII), which indicates considerable diversity among the genotypes evaluated whereas the lowest inter-cluster distance (D=5.68) was found between clusters IV and III (Table 2). The Intra-cluster distance ranged from 9.09 (cluster I) to 9.88 (cluster V). Intra-cluster distances were lower than the inter-cluster distances showing that the genotypes included within a cluster tended to diverse less from each other.The clustering pattern of genotypes showed that the genotypes of different origins were clubbed into one cluster, whereas the genotypes belonging to same origin were grouped into different clusters indicating that the geographic distribution was not the sole criterion of genetic diversity. This indicated no parallelism between geographic distribution and genetic diversity (Kumar et al., 2011). The earlier findings of Murty and Arunachalam (1966) showed that genetic drift and selection in different environments could cause greater diversity than geographic distance. Further, the free exchange of genotypes among the different regions consequently causes character constellations because of the human interference and genotype may lose its individuality.
Cluster means for various characters:
High coefficient of variation was recorded for kernel yield per plant (15.06 %) followed by number of mature pods per plant (13.54 %), pod yield per plant (13.48%) and harvest index (10.18%) while it was low for days to maturity (1.38%) followed by oil content (2.38%) and days to 50% flowering (3.21%) (Table 3). The cluster XXVII was the best for pod yield per plant, 100-pod weight, kernel yield per plant, 100-kernel weight and harvest index (Table 3). The cluster XXV was best for biological yield per plant. The cluster XXIII was best for oil content. The cluster XIX was best for number of primary branches per plant. The cluster XVIII was best for shelling out-turn. Clusters XIV, XVII and XVIII were best for days to 50% flowering while cluster XVII is best for days to maturity. The cluster XVI was best for sound mature kernels. The cluster XXI had desirable value for plant height because it showed the longer plant height. The cluster IV was the best for number of mature pods per plant. The cluster III was the best for protein content. Therefore, intercrossing of genotypes involved in these clusters would be useful for inducing variability in the respective characters and their rationale improvement for increasing the pod yield in groundnut.
Contribution of various characteristics to total divergence:
The analysis of per cent contribution of various characters towards the expression of total genetic divergence (Table 3) indicated that number of primary branches per plant followed by biological yield per plant, days to maturity, number of mature pods per plant, 100-kernel weight, days to 50% flowering, oil content, 100-pod weight, plant height, harvest index and kernel yield per plant contributed maximum (98%) towards divergence in the present study. The earlier findings of Suneetha
147
Table 1.
Grouping of 50 genotypes of groundnut in various clusters on the basis of D2– statistic
Cluster No. of
genotypes
Name of the Genotypes Source
I 16
Rajkot Valencia, C-124, 1025, Samarala, AH-25, SB-XI India
28-204 Benin
U 4-4-2 Sierra Leone
US-9 Argentina
Russian International-2 Surinam
Porte Alegre Brazil
Ah-7091 South Africa
Ah-7158 Cuba
EC-37483 Australia
PI-337409 Argentina
C-123 India
II 1 U 4-4-8 South Africa
III 1 EC-16681 Not available
IV 1 GG-7 India
V 9
GG-2, GG-5, GJG-9, S-227, JL-24 (Spanish group), RS-66 India
B-1 Uganda
U 4-7-14 Sudan
EC-38603 United States
VI 1 Osmanabad India
VII 1 NCAc-749 United States
VIII 1 GJG-31 India
IX 1 C-45 India
X 1 Ah-6990 Not available
XI 1 EC-76446 Uganda
XII 1 PB-148 Not available
XIII 1 Kadiri-3 India
XIV 1 ND 1-1 India
XV 1 NG-268 India
XVI 1 JL-501 India
XVII 1 NCAc-2718 United States
XVIII 1 WCG-156 Brazil
XIX 1 M-13 India
XX 1 Mixture Not available
XXI 1 NCAc-2751 United States
XXII 1 BH 5-3-2 India
XXIII 1 88/6/7 United States
XXIV 1 C-41 India
XXV 1 NCAc-12 United States
XXVI 1 VAR-154 China
148
Table 2.Average inter and intra–cluster distance ) values for 50 genotypes of groundnut
Clusters I II III IV V VI VII VIII IX X XI XII XIII XIV XV XVI XVII XVIII XIX XX XXI XXII XXIII XXIV XXV XXVI XXVII
I 9.09 11.26 10.76 11.44 11.28 10.42 12.47 14.67 10.89 11.62 11.65 12.38 11.77 10.49 11.08 13.95 11.56 13.13 13.41 10.84 12.38 14.84 14.40 14.76 12.49 16.39 18.40
II 0.00 10.05 10.08 13.18 8.08 14.73 14.09 10.08 7.45 14.74 12.30 9.62 11.26 10.46 15.64 15.36 8.25 16.17 11.19 9.64 8.36 9.42 9.05 11.55 16.04 16.14
III 0.00 5.68 10.42 11.70 15.57 6.40 14.97 9.62 12.78 7.11 7.13 7.35 9.10 9.28 10.83 15.18 15.29 12.59 9.97 14.83 16.28 12.90 13.57 12.26 14.63
IV 0.00 9.38 12.91 1700 9.50 15.13 12.10 13.17 10.02 10.24 8.49 11.72 11.08 12.63 15.49 14.65 15.37 10.99 16.18 17.67 15.37 14.10 15.05 16.25
V 9.88 14.30 15.68 13.30 14.35 14.41 12.87 12.90 12.18 12.32 12.40 12.71 12.89 17.55 13.25 15.55 13.68 18.61 18.80 17.37 14.95 16.84 17.04
VI 0.00 15.54 16.75 10.20 8.92 16.81 12.63 11.82 13.19 9.87 17.56 15.71 8.53 18.93 8.82 13.32 11.42 9.72 12.30 8.79 18.35 20.07
VII 0.00 17.05 10.47 13.96 10.36 14.31 12.78 14.06 15.71 13.92 11.28 15.66 10.94 13.30 14.71 15.36 13.45 13.11 18.72 16.19 18.34
VIII 0.00 18.29 12.33 13.84 9.25 8.72 9.24 12.37 7.60 11.64 19.33 15.78 16.21 12.35 18.34 19.41 14.51 17.63 9.71 12.98
IX 0.00 13.06 14.70 16.13 13.34 14.92 13.58 17.33 15.90 10.45 13.99 12.69 15.36 13.62 10.90 12.14 12.05 18.78 19.26
X 0.00 13.68 10.09 7.60 9.68 8.54 14.03 12.26 11.79 16.50 7.80 7.98 9.24 9.06 8.64 12.55 12.54 14.63
XI 0.00 12.85 13.51 9.68 16.03 11.23 8.48 17.21 9.72 13.39 11.36 16.70 16.89 16.99 19.38 15.23 18.77
XII 0.00 7.41 9.26 12.28 8.98 10.50 16.12 16.82 13.33 11.52 14.75 15.50 12.71 17.17 13.34 17.06
XIII 0.00 10.20 8.66 9.02 10.77 15.34 14.71 12.02 10.49 13.54 13.40 8.48 14.30 10.69 11.47
XIV 0.00 11.89 10.02 7.64 14.30 12.79 12.29 10.12 14.35 15.65 14.14 14.76 10.93 15.91
XV 0.00 14.81 12.80 15.11 15.46 10.98 11.23 14.42 14.94 12.26 8.74 12.33 12.44
XVI 0.00 8.52 20.35 13.76 16.19 14.54 19.78 19.26 15.68 19.59 11.54 15.24
XVII 0.00 18.07 10.62 12.83 12.87 17.77 17.46 16.11 17.19 10.52 15.76
XVIII 0.00 19.39 11.79 14.41 8.10 8.89 12.63 13.45 20.79 22.53
XIX 0.00 17.72 14.62 19.29 19.70 17.65 18.14 14.14 15.16
XX 0.00 11.94 12.16 9.59 13.19 13.42 16.61 19.30
XXI 0.00 10.28 13.88 12.07 15.71 14.00 15.60
XXII 0.00 8.43 9.16 16.14 18.34 19.87
XXIII 0.00 9.63 15.65 19.20 20.63
XXIV 0.00 15.43 14.25 14.72
XXV 0.00 17.62 18.30
XXVI 0.00 10.24
149
Table 3. Cluster mean for 15 different characters in groundnut Clusters Days to
50% flowering
Days to maturity
Plant height
(cm)
No. of primary branches
/plant
No. of mature pods/plant
Sound mature kernels (%)
Pod yield/plant
(g)
100-pod weight
(g)
Kernel yield/plant
(g)
100-kernel weight
(g)
Biological yield/plant
(g)
Shelling out-turn
(%)
Harvest index
(%)
Oil content
(%)
Protein content (%)
1 2 3 4 5 6 7 8 9 10 11 12 13 14 15
I 34.65 112.48 29.21 4.34 12.82 86.98 12.03 95.19 7.98 38.36 55.24 67.90 21.65 50.41 27.16
II 37.67 120.33 34.81 3.60 16.07 88.59 16.10 100.25 11.36 42.87 54.30 70.52 29.61 50.48 27.55
III 37.33 109.00 28.00 4.07 17.20 88.23 15.77 91.68 11.16 38.66 42.97 70.82 36.58 47.17 28.78
IV 37.00 109.67 34.93 4.20 20.33 86.68 17.99 88.88 12.31 40.53 52.85 68.31 34.46 46.98 28.17
V 38.11 108.78 31.48 4.73 17.33 89.89 17.07 95.28 11.76 42.13 62.45 68.78 26.57 49.94 27.64
VI 36.00 115.33 28.59 3.00 13.27 87.64 11.08 83.43 7.32 34.97 58.80 65.94 18.85 51.55 25.92
VII 34.33 121.00 25.51 5.33 9.73 90.76 9.51 96.62 6.10 41.20 41.74 64.31 22.76 52.52 23.76
VIII 39.00 108.33 26.88 4.40 18.47 94.17 18.67 101.07 12.55 42.61 39.74 67.06 46.86 46.89 28.10
IX 35.33 124.00 28.85 4.40 14.20 89.84 12.74 89.15 8.46 42.83 66.64 66.66 19.11 53.11 26.64
X 37.33 114.67 30.88 3.27 12.93 94.16 14.50 112.35 9.08 41.44 46.06 63.06 31.56 52.65 26.23
XI 34.33 112.00 34.06 5.53 9.47 88.90 10.82 112.85 6.80 36.90 39.89 64.08 27.10 50.55 27.65
XII 39.67 107.67 27.53 4.07 10.80 90.10 8.45 72.40 5.13 32.09 29.07 65.57 29.13 50.33 26.24
XIII 40.00 113.00 26.00 4.07 17.27 91.59 16.09 93.46 11.32 42.43 43.29 70.38 36.81 52.99 26.30
XIV 32.00 110.33 33.91 4.07 12.13 93.79 12.73 98.75 8.04 38.94 37.22 66.42 34.51 48.92 28.49
XV 37.33 110.33 25.62 3.33 14.40 91.81 16.66 115.80 11.54 50.68 58.01 69.26 29.35 50.67 26.02
XVI 38.00 108.33 27.02 5.13 19.27 94.48 16.63 82.78 11.42 35.45 38.54 71.72 43.03 51.27 25.60
XVII 32.00 107.33 28.95 4.67 11.33 91.79 11.44 101.06 7.73 39.47 36.07 67.58 31.71 52.37 24.71
XVIII 32.00 124.00 34.66 3.33 9.80 91.12 8.44 84.63 6.13 35.26 46.85 72.86 17.96 50.16 28.63
XIX 33.00 115.33 34.09 5.60 11.53 87.39 14.54 121.27 9.70 55.85 52.29 66.70 27.77 51.61 25.77
XX 34.00 114.67 26.23 3.60 12.20 89.67 13.63 111.87 9.13 32.44 51.10 66.99 26.66 52.05 26.25
XXI 38.33 112.67 35.29 4.13 11.27 85.55 12.60 130.49 7.73 46.63 38.77 61.95 28.94 48.59 28.09
XXII 36.33 123.00 34.76 3.40 6.20 88.24 6.72 108.64 4.63 42.44 31.01 69.03 21.59 50.28 28.01
XXIII 36.33 125.33 31.15 3.33 12.53 92.15 12.36 98.56 7.80 35.49 50.78 62.93 24.33 54.40 24.09
XXIV 39.67 123.33 26.68 3.73 13.80 90.86 13.06 97.12 8.32 46.39 38.30 69.14 34.03 52.51 26.62
XXV 33.67 113.33 28.68 2.80 16.27 86.60 15.28 103.54 10.27 49.33 73.41 67.36 22.71 52.10 27.89
XXVI 35.33 110.33 28.25 4.00 12.00 92.69 14.69 121.35 10.45 54.32 32.36 71.21 45.42 52.01 24.04
XXVII 39.67 115.00 27.20 4.13 19.27 88.69 26.10 135.37 18.52 65.39 51.89 70.85 50.22 53.21 26.57
Mean 36.06 112.94 29.99 4.26 14.06 89.12 13.85 98.68 9.33 41.15 51.95 67.92 27.13 50.63 26.99
S.Em. ± 0.67 0.90 0.95 0.11 1.10 3.99 1.08 3.52 0.81 1.37 2.49 1.77 1.59 0.70 0.70
150
Table 4. Percentage contribution of characters towards total divergence
1 2 3 4 5 6 7 8 9 10 11 12 13 14 15
No. of times appearing first
60 210 31 281 125 8 24 32 3 102 257 4 26 60 2
%
151
References
Arunachalam, V. 1981. Genetic distances in plant breeding. Indian J. Genet., 41: 226-236. Dashora A. and Nagda, A. K. 2004. Paper presented in
the National Symposium on "Enhancing Productivity of Groundnut for Sustaining Food and Nutritional Security" held at NRCG Junagadh during October 11-12, 2004.
Kumar, S. I.; Govindaraj, M. and Kumar, V. I. 2011. Es timation of correlation co-efficient and genetic diversity of new advance breeding lines of groundnut (Arachis hypogaea L.). World J. Agric. Sci., 6:547- 555.
Mahalanobis, P. C. 1936. On the generalized distance in statistics. Proc. Nat. Inst. Sci. (India), 2:49-55.
Murty, B. R. and Arunachalam, V. 1966. The nature of divergence in relation to breeding systems in crop plants. Indian J. Genet., 25A:188-198. Odedra, R. K.; Dobariya, K. L.; Jivani, L. L.;
Ponkia,H. P. and Khanpara, M. D. 2008. Genetic divergence in groundnut (Arachis hypogaea L.). Intl. J. Bioscience Reporter, 6: 277-281.
Rao, C. R. 1952. Advanced Statistical Methods in: Biometric Research. John Wiley and Sons, New York, pp 357-363.
Sonone, N. G. and Thaware, B. L. 2009. Study on genetic diversity in groundnut. Annl. Agric. Res., 26:1-4.
Sonone, N. G.; Thaware, B. L.; Bhave, S. G.; Jadhav, B. B.; Joshi, G. D. and Dhekale, J. S. 2011. Multivariate studies in groundnut (Arachis hypogaea L.). J. Oilseeds Res., 28(1): 24-28.
Sumathi, P. and Muralidharan, V. 2008. Genetic divergence analysis in some bold seeded genotypes of groundnut (Arachis hypogaea L.). J. Oilseeds Res., 25: 1-3.