Research Article
Analysis of Effect of Genotype x Environment Interaction on Rice Grain’s
Iron Content in Indonesia using Graphical GGE-Biplot Method
Suwarto1* and Nasrullah2
1
Laboratory of Plant Breeding, Faculty of Agriculture, Jenderal Soedirman University, Purwokerto, Indonesia; 2Laboratory of Biometric, Faculty of Agriculture, Gadjah Mada University,Yogyakarta, Indonesia
*Email: [email protected]
(Received:01 Feb 2011; Accepted:03Aug 2011)
Abstract:
GGE-Biplot method was used to analyze data of iron (Fe) content of 10 rice genotypes evaluted at eight paddy fields during the wet and dry seasons of 2007 – 2008. The objective of this study was to determine the effect of genotype (G) and genotype x environment interaction (GE) on the iron content of 10 rice genotypes. Experiments were conducted using a randomized completely block design with three replications at each environment. Results indicated that environment (E), G and GE had significant effect on rice grain’s iron content. Environment explained 74.43% of the total (G + E + GE) variation, whereas G and GE explained 5.60% and 19.67% of the total variation, respectively. The first two principal components (PC1 and PC2) were used to create a two-dimensional GGE-biplot, and these principal components explained 70.40% and 15.36% of the GGE sum of squares, respectively. Barumun genotype was desirable for its highest iron content, especially in term of ability and stabil ity. Cilongok environment was the best representative of the overall environments and the most powerful environment to discriminate the genotypes.
Key words: Rice, iron content, genotype×environment interaction, GGE-biplot
Introduction
Micronutrient trait expression and the extent of genotype×environment interactions across different environments largely determine screening, breeding, and testing methodologies used, and reflect trait heritability, genetic variation, and, hence, potential genetic gain. For the purpose of breeding for increased iron (Fe) content in rice (biofortification), the stability of Iron-dense traits of genotype across environment is inevitable (Suwarto and Nasrullah, 2011).
Crop performance, the observed phenotype, is a function of genotype (G), environment (E) and genotype×environment interaction (GE). GE is commonly observed as differential ranking of cultivar performances among locations or years. GE is said to occur when different cultivars or genotypes respond differently to diverse environments. Researchers have long been aware of the various implications of GE in breeding program.GE is important only when it is significant and causes significant change in genotypes` ranks in different environments (Crossa, 1997). GE has a negative
impact on heritability. A significant GE can seriously impair efforts to selecting superior genotypes for crop introductions and cultivar development programs (Yan and Racjan, 2002). Knowing the effect of GE, as well as the estimate of its magnitude relatives to the magnitude of G and E effects is very important for efficient breeding program. Therefore, understanding the structure and nature of GE is particularly useful to breeders as it help determine whether to develop cultivars for all environments or to develop specific cultivars for specific target environments (Bridges, 1989).
component analysis (PCA) and linear regression, with AMMI analyses, and showed that traditional analyses were not always effective in analyzing multiple-environment trial (MET) data structure. ANOVA is an additive model that describes main effects effectively and determines if GE is a significant source of variation, but it does not provide insight into the patterns of genotypes or environments that give rise to the interaction. Principal component analysis is a multiplicative model that contains no sources of variation for additive G or E main effects and does not analyze the interactions effectively. Linear regression method uses E means, which are frequently a poor estimate of environments, such that the fitted lines in most cases account for a small fraction of the total GE.
Linear-bilinear models are useful tools for analysing MET data, and examining and interpreting genotype environment interaction (GEI) (Crossa and Cornelius, 1997). Useful linear-bilinear models, among others, are the AMMI model and the Sites Regression (SREG) model.
Biplots are useful for summarizing patterns of response that exist in the original data. Biplots graph scores of sites and genotypes of the first bilinear term against scores of sites and genotypes of the second bilinear term. A full description of the interpretation of the biplots of multiplicative models is given in Gower and Hand (1996). Briefly, the cultivar and site scores are represented as vectors in a two-dimensional space. The cultivar and site vectors are drawn from the origin (0, 0) to the end points determined by their scores. An angle less than 900 or larger than 2700 between a cultivar vector and a site vector indicates that the cultivar had a positive response at that site. A negative cultivar response is indicated if the angle is between 90o and 270o. The cosine of the angle between two sites (or cultivars) approximates the phenotypic correlation of the two sites (or cultivars) with an angle of zero indicating a correlation of +1, an angle of 90o (or -90o) a correlation of 0, and an angle of 180o a correlation of –1.
A standard biplot of the SREG model was reported by Yan et al. (2000). He proposed to connect the scores of the furthest cultivars in the biplot such that they are at the corners of an external polygon and, for each side of the polygon, drawing a line segment perpendicular to that side that passes through the origin. These line segments subdivide the polygon into sectors involving different subsets of sites and cultivars. The genotype that is at the corner of one sector is the best performer in the sites included in
that sector. Sites located far away from the origin discriminate the cultivars more than those near the origin.
The GGE-biplot refers to genotype main effect (G) plus genotype by environment interaction (GE) which is the two sources of variation of the SREG model. The biplot from the SREG model shows that ideal genotypes should have large primary effects (high mean yield) and near zero secondary effects (more stable) and the ideal sites should have large primary effects (high power to discriminate cultivars) and small secondary effects. Such properties tend to occur if the primary effects of cultivars are highly correlated with the cultivar means (Yan et al., 2000; Crossa et al., 2001).
Material and methods
Ten rice genotypes that represent the major genotypes grown in commercial fields of Central Java, Indonesia, were used in this study. They were Bahbutong(G1), Cimelati(G2), Fatmawati(G3), Barumun(G4), Aeksibundong(G5), IR64(G6), Sintanur(G7), Bengawan Solo(G8), Maligaya Special(G9) and Gilirang(G10). Yield potential of these genotypes ranges from high (Fatmawati) to good (other genotypes), milling quality ranges from excellent (Cimelati) to average (IR64), and maturity ranges from very early (Maligaya Special) to mid-season (Barumun). These rice genotypes were evaluated at four locations in Central Java, Indonesia, namely: Banyumas, Gombong, Cilongok and Baturaden during the wet and dry seasons of 2008. At each location, a randomized complete block design with three replications was used to arrange treatments. Each experimental plot was of size 2 x 10 m2. Grain yield was obtained from a harvested area of 13.12 m2at the center of each plot.
Iron contents in rice grains were analyzed using 200 g of whole grain sample (non- polished rice). Analysis of rice grain’s iron content was carried out at the Laboratory of Food Sciences, Faculty of Agriculture, University of Jenderal Soedirman, Indonesia. Soil analysis was carried out in all experimental sites to determine Fe, NO3-N, P, K
contents and soil pH.
included soil Fe content (factor 2), soil NO3-N (factor
3), soil P content (factor 4), soil K content (factor 5) and soil pH (factor 6).The first two principal components (PC1 and PC2) were used to create a two-dimensional GGE-biplot.
Results and discussion
Soil iron content at the experimental locations ranged from high (Cilongok) to low (Gombong), and soil pH ranged from high (Gombong) to low (Cilongok) (Table1). Rice grain iron content was highly varied across locations and seasons (Table 2). Analysis of variance showed that environment, genotype and genotype x environment interaction significantly influenced rice grain iron content. Environment explained 74.43% of total (G + E + GE) variation, whereas G and GE captured 5.60% and 19.67%, respectively. Based on two-dimensional GGE-biplot, PC1 and PC2 explained 70.40% and 15.36% of GGE sum of squares. Effects of G, E and their interaction were significant on rice grain iron content. The effect of GE was three times of the contribution of G (Table 3, 4). Rice grain iron content was unstable depending on location. Iron content in wheat grains was also highly unstable (Oury et al., 2006; Joshi et al., 2010).
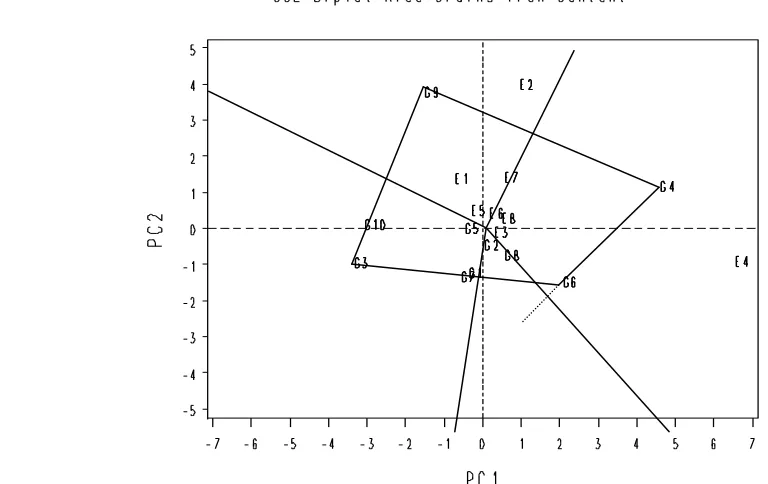
Identification of the best genotype in each environment: Visualization of the” which-won-where” pattern of MET data is important for studying the possible existence of different environments in a region (Gauch and Zobel, 1997; Yan et al., 2000;
Yan et al., 2001). The polygon view of a biplot is the
best way to visualize the interaction pattern between genotypes and environments and to effectively interpret a biplot (Yan and Kang, 2003). The vertex genotypes in this investigation were Barumun (G4), Maligaya Sp.(G9), Fatmawati (G3) and IR 64 (G6). The vertex genotype for each sector is the one that gave the highest rice iron content for the environments that fall within that sector (Figure 1). Another important feature of Figure 1 is that it indicates environment grouping, which suggests the possible existence of different environments. Only two sectors of the four sectors contained environments and these were identified as the two groups of environment. The group of environments that share the same best genotype (s) (identified as being located at the corner of the polygon) is termed the mega-environment (Yan et al., 2000; Yan and Hunt, 2002). Hence, Barumun (G4) had the highest rice grains iron content at Cilongok wet season (E4), Maligaya Sp. (G9) had the highest rice grains iron content at Banyumas wet season (E1) and Baturaden wet season (E2).
Mean of performances and stability genotypes: Yield performance and stability of genotypes were evaluated by an average environment coordination (AEC) method (Yan, 2001; Yan and Hunt, 2002; Yan 2002). In this method, an average environment is defined by the average PC1 and PC2 scores of all environments, represented by small circle (Figure 2). Genotypes with above average rice grain iron content means were Barumun (G4), IR64 (G6) and Maligaya Sp.(G9). A longer projection to the AEC ordinate, regardless of the direction, represents a greater tendency of the GEI of genotype, which means it is more variable and less stable across environments or vice versa. Barumun (G4) was more stable as well as high yielding, and it was the best genotype in terms of better rice grain iron content mostly at Cilongok wet season.
Result from AMMI analyses also indicated that Barumun genotype was the best genotype in terms of better rice grains iron content and it was more stable as well as high yielding (Suwarto and Nasrullah, 2011). Result from AMMI and GGE-biplot analyses indicated that Barumun genotype was the most stable as well as high rice grains iron content. Both analyses indicated that Barumun was the best genotype.
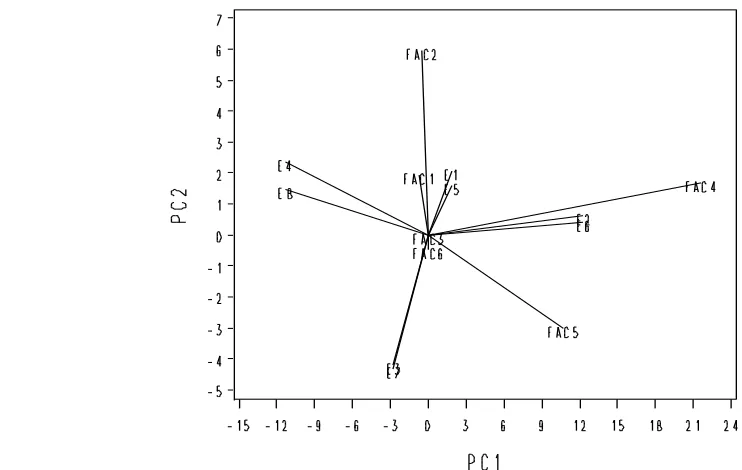
Characterizing the environments using an environment x factor –biplot: The environment vectors are drawn to facilitate visualization of the interrelationship among factors (Figure 3). When they are well represented by the biplot, the cosine of the angle between the vectors of two factors approximates the correlation coefficient between them. Rice grain iron content (factor 1) was closely positively associated with soil Fe (factor 2), but closely negatively with soil pH (factor 6). Rice grains iron content was not associated with soil N (factor 3), soil P (factor 4) and siol K (factor 5).
Conclusions
different environments, and to identify high yielding varieties across environments, the best varieties and the best environment.
Acknowlegement
The authors thank the financial support from the Ministry of National Education, Indonesia, Rector of Jenderal Soedirman University, Purwokerto - Indonesia and the Post Graduate Programs of Gadjah Mada University, Yogyakarta - Indonesia.
References
Bridge WC Jr. 1989. Analysis of plant breeding experiment with heterogeneous variance using mixed model equation. In: Applications of Mixed Models in Agriculture and Related Dicipline. So. Coop. Ser. Bull. No. 343. Baton Rouge, LA: Lousiana Agricultural Experiment Station: 145–151.
Crossa J. 1997. Statistical analyses of multilocation trials. Adv. Agron., 44:55–85.
Crossa, J, Cornelius P L, Yan W. 2001. Biplot of linier-bilinier models for stability crossover genotype×environment interaction. Crop Sci., 42: 619–633.
Gauch HG Jr and Zobel RW. 1997. Identifying mega-environments and targeting genotypes.
Crop Sci.,37: 311–326.
Joshi AK, Crossa J, Arun B, Chad R, Trethowan R, Vargas M, Ortiz-Monasterio I. 2010. Genotype×environment interaction for zinc and iron content of wheat grain in eastern Gangetic plains of India. Field Crops Res.,
116: 268–277.
Oury FX, Leenhardt F, Remesy C, Chanliaud E, Duperrier B, Balfourier F, Charmet G. 2006. Genetic variability and stability of grain magnesium, zinc and iron content in bread wheat. Eur J Agron., 25: 177–185.
Suwarto and Nasrullah. 2011. Genotype × environment interaction for Iron concentration of rice in Central Java of Indonesia. Rice Sci., 18 (1) : 75 – 78. Yan, W., L.A Hunt., Q. Sheng, and Z. Szlavnics.
2000. Cultivar evaluation and mega-environment investigation based on GGE biplot. Crop. Sci.,40 : 507-605.
Yan, W., P.L. Cornelius, J. Crossa, and L.A. Hunt. 2001. Two types of GGE biplot for analyzing multi-environment trial data.
Crop. Sci. ,41 : 656 – 663.
Yan, W. 2001. GGE biplot – a windows application for graphical analysis of multienvironment trial data and other types of two-way data.
Agron. J. ,93 : 1111-1118.
Yan, W. 2002. Singular value partitioning in biplot analysis of multienvironment trial data. Agron. J. 94 : 990 – 996
Yan, W. and L.A. Hunt. 2002. Biplot analysis of diallel data. Crop Sci.,42 : 21 – 30.
Yan, W., and M.S. Kang. 2003. GGE biplot analysis : A graphical tool for breeders, geneticist, and agronomists. CRS PRESS. Boca Raton, FL.
Yan, W., and Racjan, I. 2002. Biplot analysis of test sites and trait relations of soybean in Ontario. Crop Sci. 42 : 11-20
Table 1. Mean of Fe, NO3-N, P, K contents in the soil and soil pH at the experimental locations in
Central Java, Indonesia
Parameter Banyumas Baturaden Gombong Cilongok
Wet season
Dry season
Wet season
Dry season
Wet season
Dry season
Wet season
Dry season
(E1) (E5) (E2) (E6) (E3) (E7) (E4) (E8)
Fe (g/kg) 53.30 50.80 52.60 51.40 25.63 24.42 72.23 70.43
NO3-N(%) 0.12 0.14 0.17 0.15 0.13 0.11 0.03 0.03
P (mg/kg) 583.29 588.43 794.52 799.42 466.52 462.35 287.61 288.32 K (mg/kg) 345.12 332.52 485.48 480.83 327.78 324.68 227.60 221.20
pH 4.43 4.02 5.68 6.02 7.51 7.88 4.44 4.04
Table 2. Rice grain iron content of 10 evaluated genotypes at eight environments in Central Java, Indonesia
Genotype
Banyumas (E1) (E5)
Baturaden (E2) (E6)
Gombong (E3) (E7)
Cilongok (E4)
(E8) Average
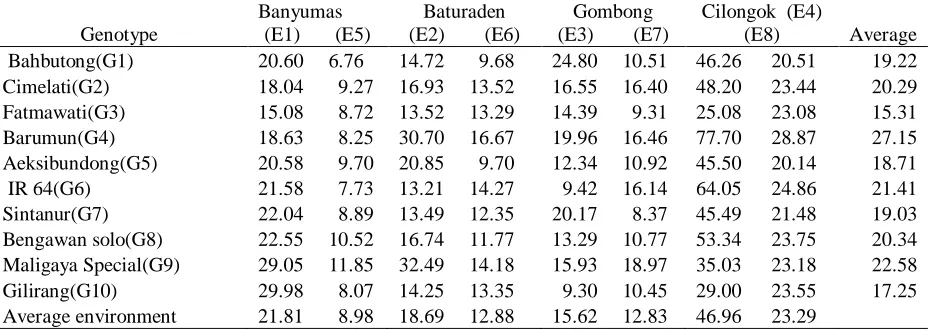
Bahbutong(G1) 20.60 6.76 14.72 9.68 24.80 10.51 46.26 20.51 19.22 Cimelati(G2) 18.04 9.27 16.93 13.52 16.55 16.40 48.20 23.44 20.29 Fatmawati(G3) 15.08 8.72 13.52 13.29 14.39 9.31 25.08 23.08 15.31 Barumun(G4) 18.63 8.25 30.70 16.67 19.96 16.46 77.70 28.87 27.15 Aeksibundong(G5) 20.58 9.70 20.85 9.70 12.34 10.92 45.50 20.14 18.71 IR 64(G6) 21.58 7.73 13.21 14.27 9.42 16.14 64.05 24.86 21.41 Sintanur(G7) 22.04 8.89 13.49 12.35 20.17 8.37 45.49 21.48 19.03 Bengawan solo(G8) 22.55 10.52 16.74 11.77 13.29 10.77 53.34 23.75 20.34 Maligaya Special(G9) 29.05 11.85 32.49 14.18 15.93 18.97 35.03 23.18 22.58 Gilirang(G10) 29.98 8.07 14.25 13.35 9.30 10.45 29.00 23.55 17.25 Average environment 21.81 8.98 18.69 12.88 15.62 12.83 46.96 23.29
Table 3. Analysis of variance of the effects of genotype, environment, genotype×environment (GE) on rice grains iron content
Sources of variation df SS MS F value P value Model SS(%)*
Environment 3 29569.269 4224.181 5577.70 <.0001 Random 74.42
Replication (Env) 16 12.098 0.756 1.00 0.5502
Genotype 9 2222.953 246.994 326.14 <.0001 Fixed 5.60
Genotype x Env 63 7817.099 124.081 163.84 <.0001 Random 19.67
Residual 144 109.056 0.757
Total 239 39730.477
* percentage from total SSG, E dan GE
Table 4. GGE biplot analysis of rice grain iron content of 10 evaluated genotypes at eight environments in Central Java, Indonesia
Principal Component Singular Values Eigen Values Total Eigen Values (%) Cumulative (%)
PC1 84,07 7068,15 70,40 70,40
PC2 39,28 1542,76 15,36 85,76
PC3 27,69 767,13 7,64 93,40
Residu 662,00 6,60 100,00
Total 10040,04*
Table 5. Eigenvector 10 evaluated genotypes and the eight environments
Factor Code PC1 PC2
Genotype G1 -0.18049 -1.10891
Genotype G2 0.24378 -0.34297
Genotype G3 -3.15347 -0.82573
Genotype G4 4.80065 1.27613
Genotype G5 -0.27119 0.12212
Genotype G6 2.27146 -1.36373
Genotype G7 -0.38284 -1.21591
Genotype G8 0.77021 -0.64479
Genotype G9 -1.31202 3.89987
Genotype G10 -2.78609 0.20390
Environment E1 -0.55038 1.47425
Environment E2 1.15301 4.09254
Environment E3 0.48891 -0.00062
Environment E4 6.74489 -0.80888
Environment E5 -0.10878 0.59871
Environment E6 0.37023 0.53132
Environment E7 0.75262 1.51376
Environment E8 0.67748 0.41020
Figure 2. Average environment coordination (AEC) views of the GGE-biplot for the means performance and stability of genotypes
Figure 3. Vector view of an environment x factor biplot summarizing the interrelationship among rice grain iron content (Fac 1) and soil factors. PC1 and PC2 are first and second principle components, respectively. Fac 2, soiliron content; Fac 3, soil NO3-N content; Fac 4, soil P content; Fac 5, soil K content; Fac 6, soil pH.
AEC
Stable
Unstable
High yield