Dynamic Equipment Deployment at a Container Terminal:
Transfer System Based on Real-Time Positioning
Nam Kyu Park1,*
–
Branislav Dragoviü2–
Ju Young Kim3 1Tongmyong University, Department of Distribution Management, Republic of Korea 2
University of Montenegro, Maritime Faculty, Montenegro 3
Tongmyong University, Port Logistics Institute, Republic of Korea
In container terminals, containers are transported from the quay to the storage yard and vice versa by yard trucks (YTs) which are used for transfer operations. We focus on the operational management of the dynamic transfer equipment deployed between the quay and the container yard during the container unloading/loading process with a given number of ships according to a previously planned berth schedule. This study discusses how information technology enhancement activities raise port competitiveness. Advanced operation systems are designed, and selected according to their investment effects. These systems are preferred to infrastructure expansion and additional equipment acquisition. Using simulation methodology, we attempt to prove that real-time data collection by using radio frequency identification (RFID) and dynamic operation of YT improves productivity and enhances resource utilization. As a result,, it was found that about 25% of productivity improvement may be realized by simulation study.Computational calculations for validation of simulation models based on real-time data are provided.
© 2009 Journal of Mechanical Engineering. All rights reserved.
Keywords: container terminals, container transport, operational management, simulation, information technology
0 INTRODUCTION
Simulation methodology is widely used for dynamic planning and operation at a container terminal. We present a general framework to support the operational decisions for dynamic transfer system deployment based on real-time positioning.
A container terminal is a complex system with various interrelated components. There are many complicated decisions that operators or planners have to make. The handling operations in container terminals include three types of operations: ship operations associated with ship-berth link, receiving/delivery operations for external trucks, and container handling and storage operations in a yard. Container ships are loaded and unloaded where containers are temporarily stored while awaiting a new journey. Inbound containers arrive by ship and quay cranes (QCs) transfers containers from ship to a yard truck (YT). The YT then delivers the inbound container to a yard crane (YC) which may be a rubber tired gantry crane (RTGC) or rail mounted gantry crane (RMGC). The YC picks it off the YT, which returns to the QC to
receive the next unloaded container. In the loading operation the process is carried out in the opposite direction. These are indirect transfer systems where a YT delivers a container between the apron and the container yard. RTGCs or RMGCs transfer containers between yard trucks and yard stacks in the container yard.
Firstly, several alternative handling operations in container terminals are currently being used and to maximize the efficiency of the operations they are usually planned in advance. In this paper, dynamic YT deployment based on real-time positioning is assumed. The capycity of the resources used in the planning operation are usually limited. Thus priorities among handling activities that require these resources must be determined during the planning operation. The resources include berths, QCs, YTs, YCs, container yard space and other handling equipment.
Secondly, the next subsection will give an overview of the literature reffering to container port simulation models. Section 1 discusses YT deployment planning at a container terminal. In
Section 2, we present the problem statement.
presents a brief description of simulation modeling procedure consisting of model structure, data collection and applied simulation algorithm. In Section 4, computational results are reported to evaluate the efficiency of the models. Finally, a summary of the results and contributions of is given.
0.1 Literature Review
Simulation models have been used extensively in the planning and analysis of operating processes at a container terminal. Many different simulation models regarding terminal operation, especially anchorage-ship-berth link, terminal design, container yard optimization planning, YC deployment, container handling and storage operations in a yard and others, have been developed in papers [1] to [33]. These models are coded in different simulation languages, as seen in Table 1.
It should also be pointed out ,that there are a few overview concepts of container port operation literature given by Vis and Koster [34], Steenken et al. [35], Stahlbock, and Voß [36], Günther and Kim [37], and Kim [38] as shown in Table 1. In these papers good surveys of container port operation were done.
One can conclude that all of these main port links have been adequately analyzed and modeled by using different simulation approaches. Various operations research models and methods in the field of optimizing main port link planning are increasingly applied in the world terminals.
All the previous studies assumed that the objective simulation models were developed in a different environment and that optimal solutions can be found. However, in container terminals there are many complicated constraints to be dealt with so finding an optimal solution itself is a difficult problem. This is why simulation models of dynamic transfer operations based on real-time positioning are applied to the YTs deployment problem in container terminals.
1 YARD TRUCK DEPLOYMENT PLANNING
We focus on the operational management of the dynamic YT deployed between the apron and the container yard, during the container unloading/loading process with a given number of ships according to a previously planned berth schedule. This methodology indicates how this approach can be successfully integrated in an
Table 1. Literature overview
Considered problems Approaches References
Simulation of ports and container terminals (CT)
PORTSIM Modsim III
Object oriented programming, C++ ARENA, SLX
Visual SLAM AweSim Witness software Taylor II GPSS/H
Extend-version 3.2.2 Scenario generator Java
Generic simulation model
Discrete event simulation
Nevins et al. [5];
Gambradella et al. [6] and [11]; Yun and Choi [8];
Tahar and Hussain [10]; Merkuryev et al. [4] and [9]; Lee et al. [17]; Park et al. [27]; Kozan [30]; Legato and Mazza [12];
Nam et al. [13]; Ng and Wong [28];
Shabayek and Yeung [14]; Martinez et al. [21]; Kia et al. [15];
Pachakis and Kiremidjian [16]; Dragoviü et al. [24] and [25];
Sgouridis et al. [18]; Hartmann >22@; Bielli et al. [26]; Otjes et al. [29];
Dahal et al. [20];Canonaco et al. [31]; Petering & Murty [32]; Petering et al. [33]. Overview concept and
surveys of recent research on CT
Quantitative models for various decision problems in CT;
Logistics processes and operations in CT – optimization methods;
Operations research at container terminals: a literature update;
CT and terminal operations;
Models and methods for operations in CT.
Vis and Koster >34@; Steenken et al. >35@;
Stahlbock and Voß [36];
already available simulation model to support dynamic assignment of YT to allocated QCs. In such a model the resource assignment, in terms of representation, allocation and management of the resources, plays a vital role regarding the efficiency of the whole dynamic YT deployment architecture.
The YT assignment process is the allocation of handling tasks to container-handling equipment. Loading/unloading tasks are assigned to one of the QCs, based on the berth schedule and the number of loading/unloading tasks for each ship. Transfer tasks are assigned to YCs dynamically, based on real-time information on waiting tasks and the status of each crane.
There are two types of strategies for assigning delivery tasks to YTs. One is a dedicated strategy and the other is a pooled strategy. With the former, a group of YTs is assigned to a QC and deliver containers only for that QC. In the latter, all the YTs are shared among different QCs thus any YT can deliver containers for any QC, which is a more flexible strategy for utilizing YTs. However, when YTs are shared by more than one QC (pooled dispatching) or QC mixes with alternating unloading and loading operations (dual cycle QC operation), both of which can be found rarely in practice, empty travels may be significantly reduced [38] and [39].
If the productivity of each area e.g. a quay, yard, and gate is harmoniously achieved, then the total productivity of a whole terminal can be improved. In particular, the productivity of YT in the container yard has a significant effect upon the overall productivity of a container terminal.
Productivity maximization of YT, minimization of QCs and YCs waiting time by effective fulfillment of work order and remarkable utility rate improvement by dynamic vehicle assignment – all these are essential technologies for a state-of-the-art port stevedoring system. For this reason and to increase the efficiency of YT, the development of a dynamic assignment technique (or dynamic operation) based on a real-time location system is much needed.
Firstly, this paper discusses the YT deployment system. To attain the highest terminal productivity, it is essential that the activities of the YTs are properly coordinated, so the YTs serve QCs effectively. The above
mentioned highlights the challenging nature of real-time YT operations control problems at a container terminal. Accordingly, we have considered two types of strategies for assigning delivery tasks to YTs: the dedicated strategy and the pooled strategy. Then simulation models for both of them were performed to measure their quantitative effect. The two YT assignment strategies presented here are directly tied into a detailed simulation models: a current model for dedicated strategy and an improved model related to pooled strategy. Both models are tested and shown to be viable in a real-time environment. Computational results indicate that one of these models is superior to the other.
In order to improve the reliability of each simulation model, we collected the operation data of Hanjin Gamman Container Terminal (HGCT) located in Busan for one year [27]. We used Arena as a simulation language [40] and a visual basic for a linkage to event handling.
2 PROBLEM STATEMENT
The crucial terminal management problem is to optimize the balance between the shipowners who request quick service of their ships and the economic use of the allocated resources. Since both, the container ships and the container port facilities are very expensive, it is desirable to utilize them as intensively as possible. In representing random and complex environment of container terminal simulation modeling is better than the analytical one. The different types of simulation languages that were used for modeling the main container terminal link processes include PORTSIM, Modsim III, AweSim, Arena, Extend, Witness, GPSS/H and other. Another problem is also choosing the simulation tool to develop the model. There are two options in which the model of container terminal can be developed by a general purpose programming language and simulation package or language.
2.1 Operational Situation
the necessity of real-time data and also provided the needed data for simulations. Consequently, operational problems and the requirements for advancement of HGCT are defined.
In most cases, the bottlenecks in the operational process are usually caused by YT more than QCs or YCs. Furthermore, certain ports [27] included a pooling system or a dual cycle system for improved YT efficiency. But because of inaccurate location recognition and scanty wireless communication infrastructure, these systems ended in failure.
In many Korean ports, the final job location of a crane can be checked by crane operator’s input, consequently lowering the accuracy of input data. As for YT, it is almost impossible to conduct location tracking.
2.2 Requirements for Improvement
According to the realized interview, the problem at HGCT where YTs are assigned to specific QC until the work is completed is addressed. A more efficient YT assignment method called pooled strategy will be proposed. In this process, YTs return to any QC after delivering the containers and YTs can be dynamically assigned to the QC. A dynamic approach may be more advantageous, such as: when a YT arrives at a container stack point in the yard after receiving a container from a QC under unloading operation, instead of going back to the QC which is situated far from the present location, it proceeds to the next stack point which is close to the present location to receive a container for export, and then proceeds to another QC under loading operation.
3 SIMULATION MODELS
Simulation of the logistics activities related to the arrival, loading/unloading, transfer and departure processes of YTs in container terminal can be used for different activities such as designing storage yard, increaseing productivity and efficiency of terminal equipment (YTs, QCs and YCs), analysing and planning of terminal transfer operations from the quay to the storage yard, etc. These logistics activities are particularly complex and very expensive since they require the combined use of expensive infrastructure capacities like berths and storage
yard. Terminal transfer operations need to serve containers as quickly as possible. Thus, in order to successfully design and develop terminal transfer operations and utilize it as efficiently as possible, it is necessary to develop a simulation model that will support decision making processes of terminal managers. The results, analysis and conclusions given here are intended to provide guidance on achieving time efficiency, raise productivity of YT and accuracy in the modeling and calibration of simulation models for HGCT.
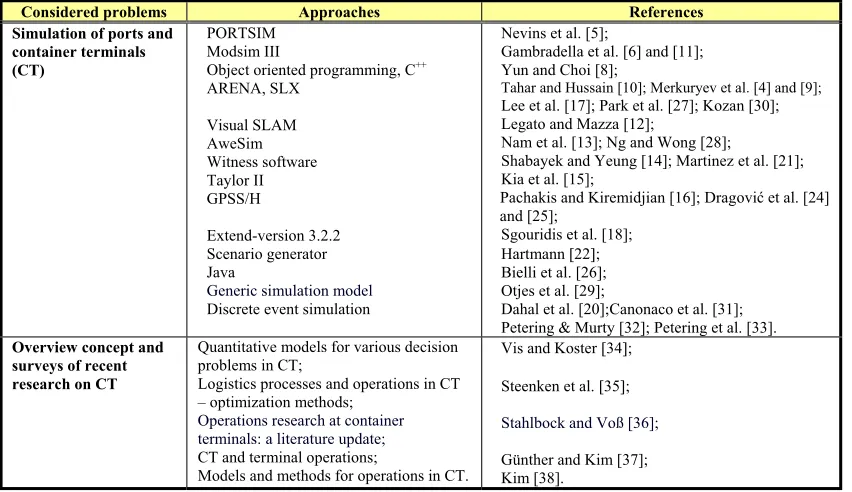
Simulation model development is required to test the efficacy of dynamic operation based on RTLS. We need to analyze the current business process and then design an improved business process. A current model YTs operation method is based on a group of YTs, that is, a certain number of YTs per QCs thus performing the job of loading and unloading for QC. At this time each YT group can be distinguished by their flag. Fig. 1 shows the current YT operation concept of the dedicated strategy where a group of YTs is assigned to a QC and deliver containers only for that QC.
Fig. 1. An illustration ofcurrent YT operation concept (dedicated strategy)
However, the pooled dispatching strategy is different. In the pooled strategy, all the YTs are shared among different QCs and thus any YT can deliver containers for any QC as illustrated in Fig. 2. This strategy can be composed for a ship or for a whole container terminal.
Fig. 2. An illustration ofimproved YT operation concept (pooled strategy)
As this method is FIFO-based assignment of YT, it can coordinate the YT imbalances utility rate. Referring to the job situation including the moving distance from the current job place, YTs can be dynamically assigned to the QC and YC, thus considerably reducing empty movement.
3.1 Initial Environment Setup for Simulation
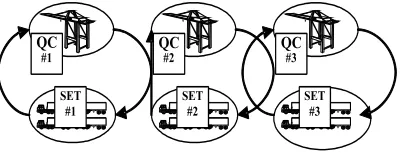
This study has assumed that one berth has three QCs, one QC has one group organization composed of five YTs and each group works for 10 hours. Transfer distance was counted according to the required time of each movement lines for YTs as illustrated in Fig. 3 (environment setup for a current model). On the other hand, the improved model based on 15 YTs was dynamically assigned to 3 QCs. The environment setup provides another powerful advantage for improving the YT assignment processes at the HGCT.
Fig. 3. Terminal layout and movement lines of YTs
An important part of the implementation of the models is the correct choice of the values of the simulation parameters. The input data of the mother ships are collected for one year (2005) [27]. Related to statistical analysis, the obtained data comes from the HGCT and includes the following values: the arrival and departure time of mother ship, work time, the number of assigned QCs, the number of YTs, the number of YCs, and storage position at the container yard. The average of each value and probability distributions were calculated by input analysis with Arena. YT’s waiting time for YC, working hours, YT’s travel speed and transfer distance were calculated based on real data. Table 2 and Fig. 4 show the values of major input variables.
In addition, we developed simulation models where service times were calculated by using a particular distribution. To obtain accurate data, we first fitted the empirical distribution of service times to the appropriate theoretical distribution for serviced ship. Service time distribution is given in Fig. 4.
Table 2. The major simulation input variables
Variable Type Value
Service time distribution of ships Distribution 1+GAMM (2.58, 5.48) hrs
Number of QC Average value 3
Loading time for QC Distribution TRIA (20, 30, 40) sec
Number of YT Average value 5 YTs per QC
Travel speed of YT Average value 115 meters/minute
Waiting time distribution of YC Distribution TRIA (0.4, 1, 1.5) minute
YC working hours Distribution NORM (3, 0.2) minute
Fig. 4. Service time distribution of ships (1+GAMM (2.58, 5.48) hrs)
We carried out extensive numerical work for the high/low values of the HGCT models characteristics. For purposes of validation of the simulation model and verification of the simulation computer program, the results of simulation model were compared with the actual measurement. Our output computational calculation is based on different parameters of various HGCT characteristics such as: total handling volume at the same hours, handling volume per YT and delayed working hours owing to YT’s waiting. And then the research on correlationship between handling volume and YT’s working hour delay was made.
3.2 Simulation Modeling
Storage yards at container terminals serve as temporary buffers for inbound and outbound containers. YTs is the most frequently used equipment at terminal for transfer operations. The efficiency of transfer operations heavily depends on the productivity of these YTs. As the workload distribution in the terminal changes over time, dynamic deployment of YTs between quay and container storage areas is an important issue of terminal operations management. These models address the YT deployment problem. Given the forecasted workload of each YT in each period of the day, the objective is to find the asignment strategy and routes of YT movements between quay and storage yard so that the productivity at terminal is improved and average delay time of QC is minimized. The problem is solved by the simulation model. To improve the performance of this approach, we augment the new model and modify the solution procedure accordingly.
Computational calculation shows that the modified model generates better results.
In particular, simulation modeling is suitable for the complex environment of a container terminal, which requires various criteria and scenarios. Most container terminal systems are sufficiently complex to warrant simulation analysis which determines systems performance.
We now present simulation models of dynamic transfer operations based on RTLS. These models, based on the authors experience and on extended discussions with managers and staff members at HGCT, are designed to show dependence of assigning strategies for YTs in real time.
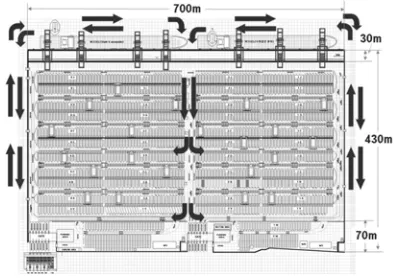
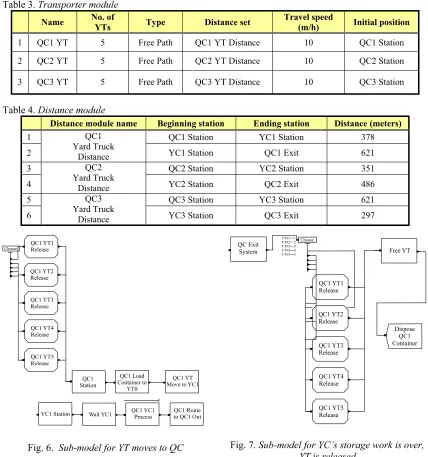
Let’s assume that we conduct modeling based on one ship. The modeling can be divided into three parts. Firstly, if containers come, it needs to be checked whether there are YTs available or not. If available, YTs will be assigned to QC, and if not, QC is to wait YTs. At the same time, the QC’s waiting time for YT is counted. This procedure is explained in Fig. 5. Group of 5 YTs was assigned by using the transporter module for QC referring to Table 3.
Fig. 5. Sub-model for YT available after job completion of QC
Table 3. Transporter module
Name No. of
YTs Type Distance set
Travel speed
(m/h) Initial position
1 QC1 YT 5 Free Path QC1 YT Distance 10 QC1 Station
2 QC2 YT 5 Free Path QC2 YT Distance 10 QC2 Station
3 QC3 YT 5 Free Path QC3 YT Distance 10 QC3 Station
Table 4. Distance module
Distance module name Beginning station Ending station Distance (meters)
1 QC1 Station YC1 Station 378
2
QC1 Yard Truck
Distance YC1 Station QC1 Exit 621
3 QC2 Station YC2 Station 351
4
QC2 Yard Truck
Distance YC2 Station QC2 Exit 486
5 QC3 Station YC3 Station 621
6
QC3 Yard Truck
Distance YC3 Station QC3 Exit 297
Fig. 6. Sub-model for YT moves to QC
Finally, if YC’s storage work is over, YTs will be released, and containers handling will also finish. This procedure is shown in Fig. 7.
One of the productivity terms is the time of YTs for one container, which is incurred by the travel of trucks in the yard. The travel time is proportional to the travel distance of YTs and availability of YC at time. YTs travel from the quay to the storage yard and then return to the quay. The model developed here can be used to¸ obtain results that can be important to the terminal management.
Fig. 7. Sub-model for YC’s storage work is over, YT is released
Fig. 8. Difference between the current model (a) and the improved model (b)
4 COMPUTATIONAL RESULTS
This section presents some simulation results. The Arena software was used for solution procedure.
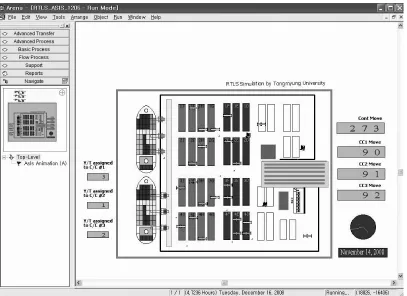
The results of both simulation models include total handling volume, handling volume per YT, average delay time of QC in YT waiting time and the relationship between delay time and throughput. The strategy assignment, based on real-time positioning, is introduced next in order to improve the performance parameters of the terminal transfer operations. The priority is therefore assigned to pooled strategy of YTs to each YT and the output is considered in order to help port management establish the best service strategy. To achieve accuracy, we first evaluate the queue properties, and then we deal with productivity of YTs. In order to enhance the readability of simulation, animation was made. Also, for easier understanding of YT’s flow, the animation was expressed as shown in the Fig. 9.
Table 5. The major output values
Output values Unit Current model Improved model
Total handling volume TEU 870 1,100
Handling volume per YT TEU 58 73
Average delay time of QC in YT waiting Minute 1.6 0.8
The simulation models were run for 100 statistically independent replications. The average results were recorded and used in comparisons. Two different models were simulated referring to Fig. 8. The two models had 5 and 15 YTs, and their delivery orders, respectively. Group of 5 YTs was assigned to QC for current model. The improved model based on 15 YTs was dynamically assigned to 3 QCs according to resource conditions and shortest distances.
Table 5 shows the experimental results for major output values for the current and improved model. These results supported the argument that the total handling volume and handling volume per YT could be increased by pooled strategy of YTs. At the same time, the objective was to minimize the average delay time of QC in YT waiting time, and hence the average time that YTs spend in quay area. Our results show that YTs arrivals over time are needed as input data for the optimization of the considered problem. In addition to the arrival date and YTs time in quay area, it also generates the number of lifts per ship (i.e. the number of containers to be served per ship). On the basis on YT and QC productivity, this number of lifts per ship can easily be converted into the average service time of YT needed at the quay area.
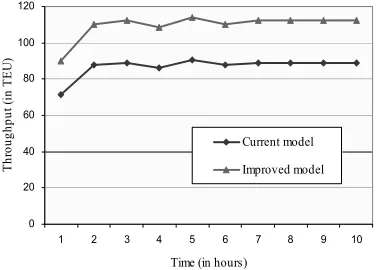
Fig. 10 shows the status of throughput according to time progress, while Fig. 11 gives the relationship between delay time and throughput. Figure 10 compares the status of throughput according to time progress of different models at a terminal. They graphically show the sensitivity of throughput. Figure 11 presents how delay time of YTs reduces the throughput for each model. The results shown here support the argument that the throughput could be decreased by increasing the delay time of YTs
In this paper we have presented a new approach that combines the advantages of the simulation models and the dynamic transfer operations based on real-time positioning. We have shown that our improved model is able to generate competitive solutions quickly, even in
comparison to traditional planning approaches that are much more time consuming.
0 20 40 60 80 100 120
1 2 3 4 5 6 7 8 9 10
Time (in hours)
T
h
roug
hput
(
in
T
E
U
)
Current model
Improved model
Fig. 10. The status of throughput according to time progress
Fig. 11. The relationship between delay time and throughput
5 CONCLUSIONS
strategy of YT assignment would lead to an improvement of the main operational parameters.
Therefore, our research has found that the dynamic resources assignment of YT based on real-time locating data can raise productivity by more than 25% over the dedicated assignment method. If an error range is reduced by using RFID technology, and if RTLS is applied not only to the YT, but also to the YCs and containers, than higher productivity improvement is expected.
Recently, port operation systems of many advanced countries have become more intelligent and object-oriented, and also tremendous efforts have been made to quickly respond to the rapidly changing environments. In the end, RTLS technology is becoming more prominent. In this respect, this study is expected to make a contribution to the introduction of RTLS.
Our contribution is twofold: simulation models development and analysis of dynamic transfer operations based on real-time positioning for HGCT (Korea), and an iterative combination of simulation and animation models validation based on real-time data are provided.
Finally, these models address the issues such as the performance criteria and the model parameters to propose an operational method of YTs assigned to a QC based on real-time positioning and increases the terminal efficiency. Also, we are developing alternative simulation based approaches to current and improved models. An improved model based on real-time positioning transfer system looks as the most promising practical technique to support decisions for the YTs deployment problem. This model can be used by the port management to improve the various operations involved in the process of YTs assignment to QC. In addition, the satisfaction or dissatisfaction of HGCT managers with respect to priority assignment is another important consideration that needs to be taken into account in future research.
6 ACKNOWLEDGEMENT
This work was supported by the grant No. B0009720 from the Regional Technology Innovation Program of The Ministry of Knowledge Economy (MKE).
7 REFERENCES
[1] Ballis, A., Abacoumkin, C. (1996) A container terminal simulation model with animation capabilities, Journal of Advanced Transportation 30(1), p. 37-57.
[2] Ramani, K. V. (1996) An interactive simulation model for the logistics planning of container operations in seaports, Simulation 66(5), p. 291-300.
[3] Bruzzone, A., Signorile, R. (1998) Simulation and genetic algorithms for ship planning and shipyard layout, Simulation 71(2), p. 74-83.
[4] Merkuryev, Y., Tolujew, J., Blumel, E., Novitsky, L., Ginters E., Viktorova, E., Merkuryeva, G., Pronins, P. (1998) A modelling and simulation methodology for managing the Riga Harbour container terminal, Simulation 71(2), p. 84-95.
[5] Nevins, M.R., Macal, C.M., Love, R.J., Bragen, M.J. (1998) Simulation, animation, and visualization of seaport operations, Simulation 71(2), p. 96-106.
[6] Gambradella, L.M., Rizzoli, A.E., Zaffalon, M. (1998) Simulation and planning of intermodal container terminal, Simulation 71(2), p. 107-116.
[7] Thiers, G.F., Janssens, G.K. (1998) A port simulation model as a permanent decision instrument, Simulation 71(2), p. 117-125. [8] Yun, W.Y., Choi, Y.S. (1999) A simulation
model for container-terminal operation analysis using an object-oriented approach. International Journal of Production Economics 59(1-3), p. 221-230.
[9] Merkuryeva, G., Merkuryev, Y., Tolujev, J. (2000) Computer simulation and metamodelling of logistics processes at a container terminal, Studies in Informatics and Control 9(1), p. 53-59.
[10] Tahar, M.R., Hussain, K. (2000) Simulation and analysis for the Kelang Container Terminal operations, Logistics Information Management 13(1), p. 14-20.
[11] Gambradella, L.M., Mastrolilli, M., Rizzoli, A.E., Zaffalon, M. (2001) An optimization methodology for intermodal terminal management, Journal of Intelligent Manufacturing 12(5-6), p. 521-534.
container terminal via discrete event
simulation, European Journal of
Operational Research 133(3), p 537-547. [13] Nam, K.C., Kwak, K.S., Yu, M.S. (2002)
Simulation study of container terminal performance, Journal of Waterway, Port, Coastal, and Ocean Engineering 128(3), p. 126-132.
[14] Shabayek, A.A., Yeung, W.W. (2002) A simulation model for the Kwai Chung container terminal in Hong Kong, European Journal of Operational Research 140(1), p. 1-11.
[15] Kia, M., Shayan, E. and Ghotb, F. (2002) Investigation of port capacity under a new approach by computer simulation, Computers & Industrial Engineering 42(2-4), p. 533-540.
[16] Pachakis, D. and Kiremidjian, A.S. (2003) Ship traffic modeling methodology for ports. Journal of Waterway, Port, Coastal, and Ocean Engineering 129(5), p. 193-202. [17] Lee, T.W., Park, N.K., Lee, D.W. (2003) A
simulation study for the logistics planning of a container terminal in view of SCM, Maritime Policy & Management 30(3), p. 243-54.
[18] Sgouridis, S.P., Makris, D., Angelides, D. C. (2003) Simulation analysis for midterm yard planning in container terminal, Journal of Waterway, Port, Coastal, and Ocean Engineering 129(4), p. 178-187.
[19] Demirci, E. (2003) Simulation modeling and analysis of a port investment, Simulation 79(2), p. 94-105.
[20] Dahal, K., Galloway, S., Burty, G., Mcdonaldz, J., Hopkins, J. (2003) A port system simulation facility with an optimization capability, International Journal of Computational Intelligence and Applications 3(4), p. 395-410.
[21] Martinez, F.M., Gutierrez, I.G., Oliveira, A.O., Arreche Bedia, L.M. (2004) Gantry crane operations to transfer containers between trains: a simulation study of a Spanish terminal, Transportation Planning and Technology 27(4), pp. 261-284.
[22] Hartmann, S. (2004) Generating scenarios for simulation and optimization of container terminal logistics, OR Spectrum 26(2), p. 171-192.
[23] Yang, C., Choi, Y., Ha, T. (2004) Simulation-based performance evaluation of transport vehicles at automated container terminals, OR Spectrum 26(2), p. 149-170. [24] Dragoviü, B., Park, N.K., Radmiloviü, Z.,
Maraš, V. (2005) Simulation modeling of ship-berth link with priority service, Maritime Economics & Logistics 7(4), p. 316-335.
[25] Dragoviü, B., Park, N.K., Radmiloviü, Z. (2006) Ship-berth link performance evaluation – simulation and analytical approaches, Maritime Policy & Management 33(3), p. 281-299.
[26] Bielli, M., Boulmakoul, A., Rida, M. (2006) Object oriented model for container terminal distributed simulation, European Journal of Operational Research 175(3), p. 1731-1751. [27] Park, N.K., Seo, C.G., Choi, H.R., Dragoviü, B., Chen, T., Lee, Y.C., Lim, S.Y., Cho, K.S., Lee, J.Y. (2006) A study on improvement of calculation system of optimal throughput per berth in Korea container terminal, Final Report for MOMAF,Republic of Korea.
[28] Ng, W.C. and Wong C.S. (2006) Evaluating the impact of vessel-traffic interference on container terminal capacity, Journal of Waterway, Port, Coastal, and Ocean Engineering 132(2), p. 76-82.
[29] Ottjes, J.A., Veeke, H.P.M., Duinkerken, M.B., Rijsenbrij, J.C., Lodewijks, G. (2006) Simulation of a multiterminal system for container handling, OR Spectrum 28(4), p. 447-468.
[30] Kozan, E. (2006) Optimum capacity for intermodal container terminals, Transportation Planning and Technology 29(6), pp. 471-482.
[31] Canonaco, P., Legato, P., Mazza, R., Musmanno, R. (2008) A queuing network model for the management of berth crane operations, Computers & Operations Research 35(8), p. 2432-2446.
[32] Petering, M.E.H., Wu, Y.L.W., Goh, M., de Souza, R. (2008) Development and simulation analysis of real-time yard crane control systems for seaport container transshipment terminals, OR Spectrum,
DOI 10.1007/s00291-008-0142-7.
systems on overall performance at a seaport container transshipment terminal, Computers and Operations Research,
doi: 10.1016/j.cor.2008.04.007.
[34] Vis I.F.A., de Koster, R. (2003) Transshipment of containers at a container terminal: an overview, European Journal of Operational Research 147(1), p. 1-16. [35] Steenken, D., Voss, S., Stahlbock, R. (2004)
Container terminal operation and operations research – a classification and literature review, OR Spectrum 26(1), p. 3-49.
[36] Stahlbock, R., Voss, S. (2008) Operations research at container terminals: a literature update, OR Spectrum 30(1), p. 1-52.
[37] Günther, H-O., Kim K.H. (2006) Container terminals and terminal operations, OR Spectrum, 28(4), p.437-45.
[38] Kim, K.H. (2005) Models and methods for operations in port container terminals, Book Chapter, Logistics Systems: Design and Optimisation, Edited by Andre Langevin and Diane Riopel, Springer, p. 213-243.
[39] Kim, K.H., Park, Y-M. Jin, M-J. (2008) An optimal layout of container yards, OR Spectrum 30(4), p. 675–695.