Vol.9 (2019) No. 3
ISSN: 2088-5334
Kinetics of CO
2
Absorption into Aqueous MDEA Solution Promoted
by Mixture of Potassium Salt of l-Arginine and l-Glutamic Acid
Toto Iswanto
#, Ali Altway
#, Maya Shovitri
+, Muhammad Haikal
#, Septiani Ayustiningrum
#, Tri Widjaja
#* #Department of Chemical Engineering, Faculty of Industrial Technology, Institut Teknologi Sepuluh Nopember, Surabaya, 60111, Indonesia E-mail: *[email protected]
+
Department of Biology, Faculty of Science, Institut Teknologi Sepuluh Nopember, Surabaya, 60111, Indonesia
Abstract—Amino acid salt can be a promising alternative as the promoter for increasing the absorption kinetics rate of MDEA toward CO2. In this study, the absorption kinetics of carbon dioxide (CO2) into an aqueous 40 wt% equivalent Methyldiethanolamine
(MDEA) solution promoted by 1 and 5 wt% of mixed amino acid salt, potassium salt of l-arginine (Arg) and l-glutamic acid (Glu), was performed using a wetted wall column at temperatures from 303.15 to 323.15 K. Effect of various mixture ratios of those promoters on the reaction rate parameters and its physicochemical properties was investigated based on the fast pseudo-first-order regime. The reaction between CO2 and amino acid was described with the zwitterionic mechanism. Aqueous MDEA without promoter was set as
the control. The result revealed that the mixed promoter has affected to increase CO2 absorption rate into the aqueous MDEA
solution compared with the control and using the single promoter due to the interaction between Arg and Glu. In addition, the overall reaction rate constant, kov, significantly increased with the increase of mixed promoter concentration and temperature under the
investigated range. The aqueous MDEA solution promoted by 5% of mixed Arg and Glu in 1:1 ratio was obtained as the best CO2
absorbent.
Keywords— CO2 absorption kinetics; l-arginine; l-glutamic acid; MDEA; mixed promoter; wetted wall column.
I. INTRODUCTION
Nowadays, biogas as renewable and sustainable energy receives significant attention due to its potential utilization innovations which can be used in the various commercially feasible methods such as electricity generation; transport fuel; and multigeneration of heat, steam, electricity, and cooling in industry. Moreover, biogas can be utilized for energy storage applications; to stabilize intermittently operated wind and solar renewable energy systems or in cooking and lighting applications in rural districts [1]. However, the presence of CO2 as major gas products in
biogas, besides methane (CH4), has given disadvantages
because of its corrosive nature that can destroy pipelines and equipment. CO2 also reduces the heating value of biogas due
to its role as an inert gas in terms of combustion [2], [3]. The biogas which contains 60 vol% of CH4 and 40 vol% of CO2
has a low heat value (LHV) of 17,717 (kJ kg−1) or about 2.9 times lower than 100 vol% CH4 gas which has the LHV of
50,200 (kJ kg−1) [4]. Therefore, CO2-capture technologies
are so essential prior to that biogas utilization.
One of that technologies is based on the chemical absorption process which has widely employed due to its higher capture efficiencies even at low concentrations of CO2, higher selectivity and lower cost than the other
processes [5]. In chemical absorption, a solvent with high CO2 loading capacity and low regeneration energy is an
interesting topic to be developed recently. In this case, MDEA was reported has a higher CO2 loading capacity
compared to commonly used alkanolamine such as monoethanolamine (MEA) and diethanolamine (DEA). In addition, it is not corrosive to carbon steel and has lower energy requirements for regeneration, lower solvent degradation rate compared to MEA and DEA, and high selectivity toward H2S as the trace element in raw biogas [6],
[7]. Unfortunately, its reaction rate to CO2 is lower than
MEA and DEA. Therefore, the suitable alternative promoters to improve its reaction rate are highly needed.
knowledge, one of which was never used with others as a mixed promoter in MDEA solution.
In this study, the potassium salt of Arg and Glu were selected as a mixed promoter in aqueous 40 wt% equivalent MDEA solution to capture CO2 under the biogas
circumstance. Arg is an expensive amino acid which has a higher CO2 absorption kinetics rate and apparent rate
constant than Glu. In contrast, Glu has a relatively low pKa value and high overall rate constant which is potentially good for minimizing energy requirements during the regeneration or desorption process. Therefore, their combination was hypothesized to give a better CO2
absorption process at a lower cost. Therefore, this study aims to investigate the effect of utilization of mixed Arg and Glu as promoter at various ratio and temperature on the kinetics of CO2 absorption into the MDEA solution and to determine
the reaction rate constant of each promoter in aqueous MDEA/Arg/Glu solution system to evaluate its performance as a mixed promoter.
II. MATERIALS AND METHOD A. Chemical
L-arginine (≥99% purity) and l-glutamic acid (≥99% purity) were purchased from Sigma Aldrich. MDEA was received with a given purity of ≥98%. A mixed gas of CO2
and N2 have been used with the fixed volumetric
concentration ratio of CO2 to N2 at 40:60. The high
concentration of CO2 in the gas feed was adapted to typical
biogas characteristic. Nitrogen has been used to substitute methane gas, which is acceptable due to the same characteristic as inert gas toward the absorbent solution. Potassium hydroxide (KOH), sodium hydroxide, hydrogen chloride, barium chloride, sodium borate, oxalic acid, and other chemicals used for titration analysis were purchased from Merck.
B. Experimental section
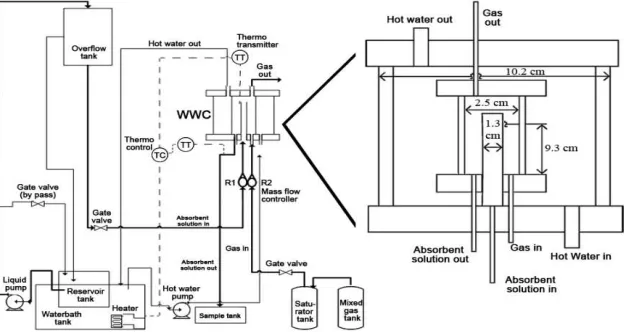
The experiment was conducted at 303.15, 313.15, 323.15, and 333.15 K using a wetted wall column (WWC) under modified design from the previous work of [12]. WWC’s dimension and other supporting apparatus in the present study are presented in Fig. 1. The absorbent solution was made by mixing an aqueous 40 wt% equivalent MDEA solution supplemented by 1 or 5 wt% of mixed Arg and Glu
with the ratio of 1:0, 0:1, 1:1 and 1:2. Aqueous MDEA solution without promoter was set as a control. Arg and Glu have been deprotonated using equimolar of KOH, forming the amino acid salt solution which is more reactive toward CO2. The temperature of the absorbent solution was adjusted
using a hot water bath. After reaching out the operating temperature, it was pumped to overflow tank and prepared to enter the WWC. Mixed gas from the mixed gas tank was firstly saturated with water vapor in a saturator tank to easily maintain the balance CO2 mass during CO2 absorption. That
absorbent solution and mixed gas were set in 200 mL min-1 and 6 L min-1, respectively using mass flow controller before introducing to the WWC. The process phenomenon in WWC has been explained in detail by [13]. For short, it can allow counter-current contact between a falling thin liquid film and a flowing gas stream with a measurable surface area of the column for accurate measurements of CO2 flux into the
solution.
C. Analysis
To determine the absorption rate of CO2 (q) into the
absorbent solution, CO2 concentration in liquid samples
before and after contacting process in the WWC has been analyzed and calculated by equation (1). The liquid sample was drawn from the WWC outlet when the system reached steady state condition. The concentration of free dissolved CO2 and RNHCOO- in the liquid sample was analyzed using
the method as described by [14] which allowed converting those species to HCO3
-, then to CO3 2-
using excess NaOH. An excess amount of 0.5M barium chloride (BaCl2) solution
was added into the sample to precipitate all carbonate in form of BaCO3. Then, that precipitation was filtered using
vacuum filtration through a 0.45 Millipore filter and dissolved with a known volume of 0.1M HCl in excess. The remaining excess amount of HCl was calculated using titration with NaOH in the presence of methyl orange as an endpoint indicator.
q = ν ([CO2] final - [CO2] initial) (1)
The pH of the liquid sample was determined by pH-meter from Laqua (HORIBA Advanced Techno Co. Ltd). Its density and viscosity were measured using pycnometerand Ostwald viscometer, respectively, to estimate the liquid-film thickness and the contact time in the WWC [15].
D. Reaction Kinetic Measurements
MDEA is a tertiary amine group while arginine and l-glutamic acid are amino acids which more reactive toward CO2. The molecular structure of MDEA, Arg, and Glu are
presented in Table I.
TABLEI
MOLECULAR STRUCTURE OF THE SPECIES IN ABSORBENT SOLUTION
Name of species
Molecular
Structure pKa Ref.
MDEA 8.62 [16]
l-Arginine
2.01(-COOH) 9.04 (-NH3+) 13.8 ± 0.1 (R group)
[13]
[17]
l-Glutamic
acid 9.98 [11]
If these amino acid are dissolved in water, the amino group will be completely protonated. The ionic equilibrium of the amino acids is shown in equation (2) [11].
HO2CRNH3+↔H++−O2CRNH3+↔2H++−O2CRNH2 (2)
In aqueous solutions, the reaction of CO2 with amino acid,
Arg and Glu (denoted by RNH2), is similar with primary and
secondary alkanolamines because they have the same functional groups [11], as written below:
CO2 + 2RNH2
2
⎯⎯⎯
RNH3+ + RNHCOO- (3)where is as described in the equation (44). The direct reaction between CO2 with Arg and Glu results in
the zwitterion intermediate as shown in equation (4). Then, the zwitterion is deprotonated by the bases (B) in the solution such as OH-, guanidinium group in the side chain of arginine (see Table I), H2O, and MDEA.
CO2 + RNH2
↔ RNH2+COO- (4)
RNH2+COO- + B
↔
RNHCOO- + BH+ (5)Furthermore, a reaction of carbamate reversion could be occurred during the process, to form bicarbonate. Its overall reaction is written in equation (8) which is not possibly resulted by direct reaction with water. It is suggested that reaction has resulted from the competing mechanisms of carbamate formation and the bicarbonate formation. Reference [18] described that the sum of the reverse carbamate formation and the bicarbonate formation in equation (6) and (7), respectively, gives the explanation for that carbamate reversion.
RNH3+ + RNHCOO-
↔CO2 + 2RNH2 (6)
CO2 + H2O + RNH2
↔
RNH3+ + HCO3- (7)RNHCOO- + H2O
↔ RNH2 + HCO3- (8)
CO2 gas was absorbed into aqueous MDEA solution and the
stoichiometry and equilibrium reaction are described as the following equations;
CO2 + H2O + MDEA
⎯⎯⎯⎯⎯ MDEAH+ + HCO3- (9)
H2O
⎯⎯⎯ H+ + OH- (10)
CO2 + H2O
⎯⎯ H+ + HCO3 -
(11) HCO3
⎯ H+ + CO32- (12)
MDEA + H+ ⎯ MDEAH+ (13) Where,
KMDEA=
. !"#
!" . (14)
Kw = $ . $% # (15)
K1 =
!"# .
!" (16)
K2 =
!" # .
!"# (17)
K3 =
. (18)
In the present study, there were several assumptions to measure the kinetic reaction value.
1. The concentration of formed bicarbonate that became carbonate was very small. Hence its concentration was equal to MDEAH+ concentration.
2. Promoter concentration is constant.
By rearranging the equations (14)-(18), $% # and
$% , could be determined as the equation (19) and (20), respectively:
$% #'(( !" #!"# (19)
$ % , ' (( ( ) !"#*+ !" #
(20)
Then Kw was determined as below [19]:
,-' exp)140.932 67899:.;< 6 22.4773* (21)
K1 and K2 were obtained from equation (22) and (23),
respectively [20]. K3 was determined by equation (24), as
described by [10, 11]
,7' exp)235.482 67+@;+.7< 6 36.7816 ln D* (22)
,+' exp)220.067 67+987.E< 6 35.4819 ln D* (23)
,8'7@)# F.G G.G HF I*7 (24)
,JKLM' ,7,8 (25)
The following reaction mechanisms have also occurred in the solution:
CO2 + H2O
"
⎯⎯⎯⎯ HCO3- + H+ (26)
CO2 + OH-
" N
⎯⎯⎯⎯ HCO3- (27)
The forward reaction is pseudo first order, and the reverse reaction rate is constant. Hence, its reaction rate is
O% N% #' % #$% #)$ % 6 $ % , * (28)
which kOH- have been explained by [22] as:
PQR7@ % #' 13.635 6 < )(*+S;: (29)
Diffusivity coefficient in the gas and liquid phase was defined by the following equation (30) [23] and (31), respectively:
TMU ' V+;S,7: (< W 7,E:
X 0,167X 10N9 (30)
TMY/[Y' 1,173 X 10N7\])^_[*`a<bG,c (31)
Mass transfer coefficient at the gas side (kg) was measured
by equation (32) [24]:
d'ef K < fg (32)
where,
hi 'kj `jK g (33)
l '9 m ng
o m p (34)
q 'kj r f
`j (35)
hℎ ' 1.075 ) q hi pf*@.S: (36)
Solubility data were obtained from Henry’s equation below [25]:
(37)
Г
@ ' @ 298 qXu vNp wx
p)I* X V 7 <6
7 +;SWy
(38) where zNp {|
p)I* } for CO2 was 2400 K [26].
The concentration of carbon dioxide in the solution interface, $% ,~, was determined by the trial of kov using
equation (39):
$ % ,~'
j• € !" ,•]K ‚ ƒ„
j •€]K ‚ ƒ„ (39)
After determining the value of $% ,~ , kov has been
determined using the following equations [22]:
^ ' z …†m j m •
j • N • j •N…†} (40)
^ ' ]TMYX r (41)
From previous research by [27], kMDEA was determined by
equation (9) where kMDEA= 4,01 x 10⁸ exp (-5400/T). The
overall reaction (rov) could be defined as the equation (42),
as reported by [13]:
Or' r)$ % 6 $ % ,•* (42)
Where kov is the constants of reaction rate for overall pseudo
first order:
r' % #$% #+ ˆ $ + JKLM$JKLM (43)
ˆ $ ' r6 % #$% #6 JKLM$JKLM (44) where,
ˆ $ ' M d$M d+ Uw‰$Uw‰ (45) The individual reaction rate constants of kArg and kGlu were
expressed by the Arrhenius equation:
Y = B + m X1 (46)
where,
' Š q#‹I (47) Equation (46) was modified to be equation (48):
ln ' ln Š NL< (48)
thus,
Y = ln kPromoter; B = ln Apromoter; m =
R
E and X1 =
T
1 (49)
III.RESULTS AND DISCUSSION
A. Effect of the mixed promoter on density, viscosity, and CO2 absorption rate
Density, viscosity, and CO2 absorption rate have been
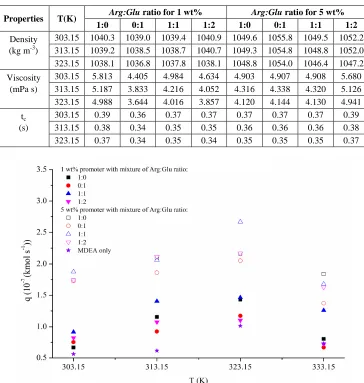
investigated for aqueous 40 wt% equivalent MDEA solution promoted by 1 wt% and 5 wt% of mixed Arg and Glu with different ratios at the temperature of 303.15, 313.15, and 323.15 K, as listed in Table II. pH of the sample during the steady-state condition was in the range of 10.6-11.03.
The results revealed that the promoter concentration and temperature certainly influence the density, viscosity, and CO2 absorption rate. At the same mixed promoter’s
concentration and ratio, density and viscosity decreased as temperature increase. In contrast, CO2 absorption rates
increased as temperature and promoter concentration increase (see Fig. 2). That was occurred due to the increase of molecular kinetic energy that took effects on the acceleration of reacted molecular substances [28], and therefore caused the faster absorption reaction of CO2 into
the absorbent solution.
In addition, it was caused by the presence of amine group in the chain of Arg and Glu which allow to react quickly with CO2 to form zwitterions and transfer protons to MDEA [29].
Hence, the absorption rate of CO2 was increased greatly,
compared with the aqueous MDEA (only) solution. The zwitterionic mechanism was presented in equation (4).
The contact time (tc), has been derived from the WWC hydrodynamics, Equation (50) [22]. It showed the time needed to contact between the gas and absorbent solution in the WWC. The measured tc are presented in Table II.
Œ•'Ž•f '+f8 Vdk8`W 7/8
VoprW+/8 (50)
2 2 1 1 0
log hI h I He
He
+ =
TABLEII
DENSITY AND VISCOSITY OF 40 WT%EQUIVALENT MDEA WITH MIX PROMOTER
Properties T(K) Arg:Glu ratio for 1 wt% Arg:Glu ratio for 5 wt%
1:0 0:1 1:1 1:2 1:0 0:1 1:1 1:2
Density (kg m-3)
303.15 1040.3 1039.0 1039.4 1040.9 1049.6 1055.8 1049.5 1052.2 313.15 1039.2 1038.5 1038.7 1040.7 1049.3 1054.8 1048.8 1052.0 323.15 1038.1 1036.8 1037.8 1038.1 1048.8 1054.0 1046.4 1047.2
Viscosity (mPa s)
303.15 5.813 4.405 4.984 4.634 4.903 4.907 4.908 5.680 313.15 5.187 3.833 4.216 4.052 4.316 4.338 4.320 5.126 323.15 4.988 3.644 4.016 3.857 4.120 4.144 4.130 4.941
tc
(s)
303.15 0.39 0.36 0.37 0.37 0.37 0.37 0.37 0.39 313.15 0.38 0.34 0.35 0.35 0.36 0.36 0.36 0.38 323.15 0.37 0.34 0.35 0.34 0.35 0.35 0.35 0.37
Fig. 2 CO2 Absorption rate in 40 wt.% equivalent MDEA with different of Arg:Glu ratio for 1 wt% and 5 wt% of mixed promoter
The CO2 absorption rate was calculated using equation (1) and shown in Fig. 2 which demonstrates the obvious effect on absorption behavior. The addition 1 wt% of single promoter presented in Arg:Glu (1:0 ratio) has a better CO2
absorption rate than Arg:Glu (0:1 ratio) in along with the rise of temperature. Arg shows a high absorption rate because it has the primary amino group and a guanidinium group in its side chain, causing a pKa value higher than Glu. The basicity of an amine (pKa) can affect the CO2 reaction rate
of the amine to form a carbamate, catalyzes the hydration of CO2, and promotes the amine to accept a proton. Where the
higher pKa value will lead to an increase of kapp value and
maximise the initial CO2 absorption rates [9]. The
conjugation of double bonded nitrogen and nitrogen lone pairs in the guanidinium group is able to delocalize positive charge to participate in multiple hydrogen bonds with water, which would be helpful to form the carbamate and promote the CO2 absorption [13]. However, another study has also
stated that the high pKa would probably require larger energy input in the desorption process [11]. This is a consideration for further applications of Arg. Therefore, using a cheaper promoter with a relatively low pKa such as
Glu in their mixture would come as a good strategy because
their CO2 absorption rate was higher than those as a single
promoter.
In this investigation, the mixture of Arg and Glu with 1:1 ratio has resulted in the highest CO2 absorption rate in both
of addition 1 wt% and 5 wt% of a mixed promoter. For 1 wt% of the mixed promoter with 1:1 ratio, CO2 absorption rate
showed a satisfied performance than the addition of 1 wt% of Arg as a single promoter. However, its value was not a significant difference in CO2 absorption at 323.15 K. in
contrast with the addition 5 wt% of the mixed promoter which obtained a higher CO2 absorption rate with the
promoter ratio of 1:1 at 323.15K.
The mixed promoter ratio of 1:1 has given close CO2
absorption rate with Arg as a single promoter, which means that Arg substitution by Glu has given a saving of cost. In this experiment, the CO2 absorption rate for aqueous MDEA
without promoter was obtained 0.6159 x 10⁻⁷ kmol s-1 at 313.15K. In the same temperature, the addition of 1 and 5 wt% of mixed promoter with 1:1 ratio has been increasing the CO2 absorption rate to 1.404 x 10⁻⁷ kmol s-1 (~2.3 times
primary amine which was the most reacted amine towards CO2 because it has more hydrogen cluster to be protonated.
The Reaction between CO2 and amino acid was stable and
faster than the reaction between CO2 and alkanolamine [11].
TABLEIII
FAST PSEUDO-FIRST ORDER EVALUATION ON 40 WT%EQUIVALENT MDEA WITH MIX PROMOTER
Properties T(K) Arg:Glu ratio for 1 wt% Arg:Glu ratio for 5 wt%
1:0 0:1 1:1 1:2 1:0 0:1 1:1 1:2
kL
(x 10-5 m.s
-1
)
303.15 8.64 9.05 8.87 8.98 8.91 8.91 8.91 8.69
313.15 9.89 10.4 10.24 10.31 10.22 10.22 10.21 9.93
323.15 11.05 11.64 11.46 11.53 11.43 11.43 11.42 11.08
Hatta Number
303.15 20.1 22.1 28.6 24.8 67.5 67 76.2 69.4
313.15 44.5 31.9 56 38.9 105 85.9 101.7 109.4
323.15 68.2 49.3 68.1 45.9 128.1 116.7 196.4 109.4
½ Ei
303.15 105.4 107.6 111.7 109.3 144 143.1 150.2 109.4 313.15 153.7 144.9 164.5 150.4 211.8 194.6 208.6 109.4
323.15 212 197.1 214.1 193.2 279.5 267.3 345.4 109.4
However, the CO2 absorption rate sharply decreased at the
temperature of 333.15 K. This phenomena was also found in the study of [30]. They reported that when the lean amine temperature reaches about 330.15 to 333.15 K, the solubility of CO2 in the amine solution will decrease and usually
become the overriding factor, and the net CO2 pickup will
begin to decrease. In that condition, the solubility will take over in the determination of absorption rate, not reaction kinetic anymore. Moreover, that was probably caused by MDEA degradation which can be occurred at that temperature range.
B. Fast Pseudo-first Order Evaluation
The reaction of CO2 absorption into MDEA solution with
a mixture of Arg/Glu promoter was investigated based on the fast pseudo-first order reaction regime. The regime must be satisfied with this condition, 3 < Ha (Hatta number) << ½Ei, where the Hatta number was calculated by the following equation:
• ' ]K!" ƒ„‚ (51)
Where kL has been determined using equations below:
Y' ‘9 m K ofam b’“” (52)
l ˆm' kd•+o (53)
– ' VkdoK8`—W7/8 (54)
Ei is an infinite enhancement factor. It is dimensionless
and formulated as follow :
˜™' ‘KKa‚‚+›.‹ š !" ,~‘
Ka‚
K ‚ (55)
All Hatta numbers of the absorbent have satisfied the required condition of fast pseudo-first order reaction regime (see Table III), which those numbers have more than 3 and much less than ½ E.
C. Kinetic Data
In the previous chapter, a higher CO2 absorption rate was
obtained in 40 wt% equivalent MDEA with addition 5 wt% of the promoter. The value of rov, kov, and kapp for this
promoter concentration were calculated using equation (42), (43), and (44), respectively at 303.15, 313.15, and 323.15 K. The value of rov and kapp are listed in Table IV. While the
overall absorption kinetics constant (kov) is displayed in Fig.
3. It reveals that the highest rov, kov, and kapp value were
obtained from the ratio 1:1 which this composition could be used as recommended consideration for further applications.
TABLEIV
KINETICS DATA IN 40 WT%EQUIVALENT MDEA WITH VARIOUS MIXED
PROMOTER RATIOS
Properties T (K) Arg:Glu ratio for 5 wt%
1:0 0:1 1:1 1:2
rov
303.15 753 669 724 644
313.15 2474 1357 1670 2234
323.15 4162 3043 9331 3720
kapp
(s-1)
303.15 15610 15390 19926 15739
313.15 39422 26372 36964 40485 323.15 59640 49410 139985 60305
The value of reaction rate constant of Arg and Glu as a mixed promoter in CO2 absorption can be evaluated from
measured kapp at all variables of promoter concentration and
mixture ratio under the investigated temperature, as shown in the equation (45). First, M d and Uw‰in the absorbent solution and the same temperature was calculated using multiple linear regression which evaluate the effect of one or some variables to other variables, as presented in equation (56) and (57). Then, the predicted kapp (kapp’) can be
formulated as equation (58) and compared with measured kapp to find out the calculation error.
∑ ˆ $M d' M d∑ $M d++ Uw‰∑ $M d$Uw‰ (56)
∑ ˆ $Uw‰' M d∑ $M d$Uw‰+ Uw‰∑ $Uw‰+ (57)
ˆ •' M d$M d+ Uw‰$Uw‰ (58)
To determine the value of reaction rate constant of Arg and
Glu as a single promoter (kArg’ or kGlu’) in the absorbent
solution, the general linear model was used with the variable data of 1 and 5 wt% from the ratio 1:0 for Arg and 0:1 for
Glu.
′ '∑ Ÿ ƒ’ƒ†• “ŸŸ
∑ Ÿ ƒ’ƒ†• (59)
ˆ •' ′ $ (60)
Finally, the k value of each promoter either as a mixed promoter or single promoter has been obtained.
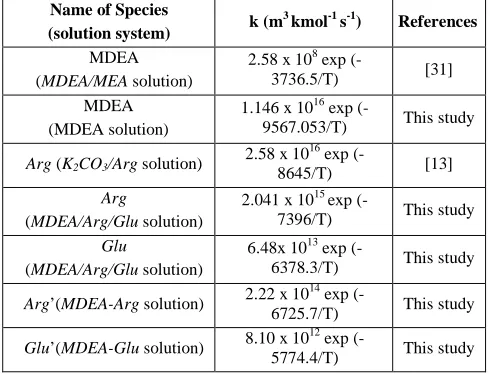
In this study, kpromoter as a function of temperature over the
investigated range were correlated using Arrhenius equation as shown in Fig. 4 with R2 value for kArg, kGlu, kArg’, and kGlu’
are 0.983, 0.997, 0.999, and 0.996, respectively. The results are listed in Table V and Fig. 5.
TABLEV
REACTION RATE CONSTANT OF THE SPECIES FROM THIS STUDY AND OTHER
REFERENCES
Name of Species
(solution system) k (m
3
kmol-1
s-1
) References
MDEA (MDEA/MEA solution)
2.58 x 10⁸ exp
(-3736.5/T) [31] MDEA
(MDEA solution)
1.146 x 10¹⁶ exp
(-9567.053/T) This study
Arg (K2CO3/Arg solution) 2.58 x 10
16
exp
(-8645/T) [13]
Arg
(MDEA/Arg/Glu solution)
2.041 x 10¹⁵ exp
(-7396/T) This study
Glu
(MDEA/Arg/Glu solution)
6.48x 10¹³ exp
(-6378.3/T) This study
Arg’(MDEA-Arg solution) 2.22 x 10
14
exp
(-6725.7/T) This study
Glu’(MDEA-Glu solution) 8.10 x 10
12
exp
(-5774.4/T) This study
Fig. 5 shows kArg in the aqueous MDEA/Arg/Glu solution
system has the highest reaction rate constant in CO2
absorption than the other solution systems. It also exhibits that Arg and Glu as a mixed promoter have a higher reaction
rate constant of CO2 absorption compared to theirs as a
single promoter.
Fig. 4 Arrhenius plot of kArg, kGlu, kArg’, and kGlu’ for 40% equivalent MDEA promoted by a mixture and single promoter.
Fig. 5 Plot reaction rate constant of CO2 absorption (k) as a function of temperature.
Fig. 6 Correlation between the temperature and k value of MDEA and other promoters resulted from this study and the literature
Correlation between temperature and k value in various absorbent and promoter resulted from the present study and the literature were shown in Fig. 6. It reveals that kMDEA
obtained in the present study has slightly the same value with the previous work of [31]. The value of kArg in
K2CO3/Arg solution system, investigated by [13], but still
lower compared to kPZ in MDEA/Piperazine (PZ) system,
investigated by [32]. In spite of that fact, Arg was environmentally friendly and less toxic than PZ [13]. Therefore, it can be considered as a good candidate promoter.
IV.CONCLUSION
The overall absorption rate constant, kov, significantly
increased with the increase of mixed promoter concentration (1 to 5 wt %) and temperatures from 303.15 to 323.15 K. The absorbent solution with 5 wt% mixed promoter with mixture ratio of 1:1 has given the highest CO2 absorption
rate and resulted in a higher reaction rate constant than Arg as a single promoter at the same concentration in 40% of aqueous MDEA solution. The results exhibited that mixed promoter could significantly increase the kinetics of CO2
absorption compared with using a single promoter that was probably caused by the presence of the interaction between
Arg and Glu in the aqueous MDEA solution. The reaction
rate constant of MDEA, Arg, and Glu during CO2 absorption
into aqueous 40% equivalent MDEA promoted by mixed amino acid salt of Arg and Glu was described as the following equation:
kMDEA = 1.146 x 10¹⁶ exp (-9567.053/T);
kArg = 2.041 x 10¹⁵ exp (-7396/T); and
kGlu = 6.48x 10¹³ exp (-6378.3/T).
ACKNOWLEDGMENT
The authors would like to thank LPPM ITS and all members of Biochemical Technology Laboratory and Heat and Mass Transport Laboratory, Department of Chemical Engineering for the help and support. This research was founded by PMDSU scholarship program from The Ministry of Research, Technology, and Higher Education of the Republic of Indonesia [grant number 482/PKS/ITS/2017, 2017].
NOMENCLATURE
DAL diffusivity of CO2 in water m2 s-1
DBL diffusivity of MDEAin water m2 s-1 DCO2 diffusivity of a CO2 in the solvent m2 s-1
d pipe diameter m
E enhancement factor dimensionless
g enhancement factor dimensionless Ha Hatta number dimensionless
He Henry constant Pa m3 kmol-1
He0 Henry constant for gas-liquid phase Pa m3 kmol-1
h ionic strength of total solvent m3 kmol-1
I ionic strength kmol m-3 h height of the column m
K reaction equilibrium constant kmol m-3
k reaction rate constant s-1
kapp apperience kinetic reaction s-1 kL liquid phase mass transfer coefficient m s-1 kOH- reaction rate constant with hydroxide ion L mol-1 s-1
Kw dissociation constant for water kmol2 m-6 MB molecular weight of solvent kg mol-1 q absorption rate of CO2 kmol s-1
R universal gas constant (8.314) J mol-1 K-1
r rate of reaction kmol m−3 s−1
Re Reynolds number Sc Schmidt number Sh Sherwood number
T temperature K
tc contact time s
V molal volume of solute at
normal boiling point cc g-1 mole-1
wt total weight %
Greek letters
ν velocity of absorbent solution m3 s-1
ρ density kg m-3
µ viscosity mPa s
φ solvent association parameter
δ film thickness in two film theory m
Subscripts A in water B in MDEA Arg l-Arginine
CO2 carbon dioxide
e equilibrium g gas
Glu l-Glutamic Acid
H+ ion hydrogen H2O water
i gas-liquid interface, infinite MDEA methyldiethanolamine OH- ion hydroxide
ov overall
REFERENCES
[1] W. M. Budzianowski, “A review of potential innovations for production, conditioning and utilization of biogas with multiple-criteria assessment,” Renew. Sustain. Energy Rev., vol. 54, pp. 1148– 1171, 2015.
[2] M. Safari, A. Ghanizadeh, and M. M. Montazer-Rahmati, “Optimization of membrane-based CO2-removal from natural gas using simple models considering both pressure and temperature effects,” Int. J. Greenh. Gas Control, vol. 3, no. 1, pp. 3–10, 2009. [3] F. R. H. Abdeen, M. Mel, M. S. Jami, S. I. Ihsan, and A. F. Ismail,
“A review of chemical absorption of carbon dioxide for biogas upgrading,” Chinese J. Chem. Eng., vol. 24, no. 6, pp. 693–702, 2016.
[4] J. Arroyo, F. Moreno, M. Muñoz, C. Monné, and N. Bernal, “Combustion behavior of a spark ignition engine fueled with synthetic gases derived from biogas,” Fuel, vol. 117, pp. 50–58, 2014.
[5] B. Sreenivasulu, D. V. Gayatri, I. Sreedhar, and K. V. Raghavan, “A journey into the process and engineering aspects of carbon capture technologies,” Renew. Sustain. Energy Rev., vol. 41, pp. 1324–1350, 2014.
[6] L. S. Tan, A. M. Shariff, K. K. Lau, and M. A. Bustam, “Factors affecting CO2 absorption efficiency in packed column: A review,” J.
Ind. Eng. Chem., vol. 18, no. 6, pp. 1874–1883, 2012.
[7] M. Scholz, M. Alders, J. Lölsberg, and M. Wessling, “Dynamic process simulation and process control of biogas permeation processes,” J. Memb. Sci., vol. 484, pp. 107–118, 2015.
[8] J. V. Holst, S. R. A. Kersten, and K. J. A. Hogendoorn, “Physiochemical properties of several aqueous potassium amino acid salts,” J. Chem. Eng. Data, vol. 53, no. 6, pp. 1286–1291, 2008. [9] S. Yan, Q. He, S. Zhao, H. Zhai, M. Cao, and P. Ai, “CO2 removal
from biogas by using green amino acid salts: Performance evaluation,” Fuel Process. Technol., vol. 129, pp. 203–212, 2015. [10] R. Ramazani, S. Mazinani, A. Jahanmiri, S. Darvishmanesh, and B.
V. D. Bruggen, “Investigation of different additives to monoethanolamine (MEA) as a solvent for CO2 capture,” J. Taiwan
[11] J. V. Holst, G. F. Versteeg, D. W. F. Brilman, and J. A. Hogendoorn, “Kinetic study of CO2 with various amino acid salts in aqueous solution,” Chem. Eng. Sci., vol. 64, pp. 59–68, 2009.
[12] H. Thee, K. H. Smith, G. da Silva, S. E. Kentish, and G. W. Stevens, “Carbon dioxide absorption into unpromoted and borate-catalyzed potassium carbonate solutions,” Chem. Eng. J., vol. 181–182, pp. 694–701, 2012.
[13] S. Shen, X. Feng, R. Zhao, U. K. Ghosh, and A. Chen, “Kinetic study of carbon dioxide absorption with aqueous potassium carbonate promoted by arginine,” Chem. Eng. J., vol. 222, pp. 478– 487, 2013.
[14] B. Prasad, “Experimental investigation of CO2 absorption capacity in amine blend of 2-Amino-2-methyl-1-propanol (AMP) and Tetraethylenepentamine (TEPA),” Master thesis, Thapar University, India, 2013.
[15] S. Paul and K. Thomsen, “Kinetics of absorption of carbon dioxide into aqueous potassium salt of proline,” Int. J. Greenh. Gas Control, vol. 8, pp. 169–179, 2012.
[16] M. Gupta, F. Eirik, and H. F. Svendsen, “Computational study of equilibrium constants for amines and amino acids for CO2 capture solvents,” Energy Procedia, vol. 37, pp. 1720–1727, 2013.
[17] C. A. Fitch, G. Platzer, M. Okon, B. G. E, and L. P. Mcintosh, “Arginine: Its pKa value revisited,” Proteine Sci., vol. 24, no. 5, pp. 752–761, 2015.
[18] K. A. Hoff, “Modeling and experimental study of carbon dioxide absorption in a membrane contactor,” Doctoral thesis, Norwegian University of Science and Technology, Norwegia, 2003.
[19] T. J. Edwards, G. Maurer, J. Newman, and J. M. Prausnitz, “Vapor-liquid equilibria in multicomponent aqueous solutions of volatile weak electrolytes,” AIChe J., vol. 24, no. 6, pp. 900–976, 1978. [20] G. Xu, C. Zhang, S. Qin, W. Gao, and H. Liu, “Gas-liquid
equilibrium in a CO2-MDEA-H2O system and the effect of piperazine on it,” Ind. Eng. Chem. Res., vol. 37, pp. 1473–1477, 1998.
[21] D. Barth, C. Tondre, and J. J. Delpuech, “Kinetics and mechanism of the reactions of carbon dioxide with alkanolamines: A discussion concerning the cases of MDEA and DEA,” Chem. Eng. Sci., vol. 39, no. 12, pp. 1753–1757, 1984.
[22] P. V. Danckwerts, Gas liquid reactions. New York: McGrew-Hill, 1970.
[23] C. J. Geankoplis, Transport processes and unit operations, 3rd editio. New Delhi: Prentice-Hall of India, 1997.
[24] J. T. Cullinane and G. T. Rochelle, “Carbon dioxide absorption with aqueous potassium carbonate promoted by piperazine,” Chem. Eng.
Sci., vol. 59, pp. 3619–3630, 2004.
[25] F. Yi, H.-K. Zou, G.-W. Chu, L. Shao, and J.-F. Chen, “Modeling and experimental studies on absorption of CO2 by Benfield solution in rotating packed bed,” Chem. Eng. J., vol. 145, no. 3, pp. 377–384, 2009.
[26] C. R. Sander, “Compilation of Henry’s law constants for inorganic and organic species of potential importance in environmental chemistry,” Max Planck Inst. Chem. J., vol. 3, p. 57, 1999.
[27] H. Kierzkowska-pawlak, M. Siemieniec, and A. Chacuk, “Reaction kinetics of CO2 in aqueous methyldiethanolamine solutions using the stopped-flow technique,” Chem. Process Eng., vol. 33, no. 1, pp. 7– 18, 2011.
[28] M. P. Gimeno, M. C. Mayoral, and J. M. Andrés, “Influence of temperature on CO2 absorption rate and capacity in ionic liquids,”
Energy & Fuels, vol. 27, no. 7, pp. 3928–3935, 2013.
[29] Z. Feng, F. Cheng-Gang, W. You-Ting, W. Yuan-Tao, L. Ai-Min, and Z. Zhi-Bang, “Absorption of CO2 in the aqueous solutions of functionalized ionic liquids and MDEA,” Chem. Eng. J., vol. 160, no. 2, pp. 691–697, 2010.
[30] J. A. Bullin, J. C. Polasek, and S. T. Donnelly, “The use of MDEA and mixtures of amines for bulk CO2 removal,” in Proceedings of the
Sixty-Ninth GPA Annual Convention, 1990, pp. 1–9.
[31] N. Ramachandran, A. Aboudheir, R. Idem, and P. Tontiwachwuthikul, “Kinetics of the absorption of CO2 into mixed aqueous loaded solutions of monoethanolamine and methyldiethanolamine,” Ind. Eng. Chem. Res., vol. 45, no. 8, pp. 2608–2616, 2006.