ISSN 0975-928X
Research Article
Genetic analysis of divergence among advanced free threshable emmer
wheat mutants derived through inter-specific hybridization followed by
mutation for quantitative traits
Nagaraju C.H*, Desai, S.A. Suma, S. Biradar, Rudra Naik, V. Chetana C.K. and Sathisha T.N. Sanjay Rajaram
Wheat Laboratory, AICRP on Wheat, Main Agricultural Research Station, University of Agricultural Sciences, Dharwad
* Email: [email protected]
(Received:4th March 2015; Accepted 10th October 2015:)
Abstract
Ninety two mutant lines derived from inter-specific hybridization cum mutation involving emmer and durum wheat as source were evaluated for various quantitative traits. The mean values indicated existence of sufficient variability among the genotypes for all the traits studied representing pooling of positive alleles from both species. All the genotypes including parents were grouped into 11 clusters based on D² statistics. The inter-cluster distance and intra cluster distance indicated still there is scope to improve quality and yield traits through hybridization involving genotypes from different clusters. Yield, plant height and number of grains per spike contributed towards genetic divergence and these traits are major determinants of genetic variability in mutant populations. The present study indicated contribution of positive alleles for almost all the productivity traits and quality into durum background whereas, free threshability and test weight into dicoccum background and confer definite advantage of inter-specific hybridization cum mutation over simple inter-varietal hybridization.
Keywords : Emmer Wheat, threshability, genetic diversity
Introduction
In wheat there are three different cultivar groups
viz., bread wheat, durum wheat and dicoccum wheat. In India about 90 per cent of the area is under bread wheat followed by durum wheat (9 %) and the remaining 1 per cent is under dicoccum wheat. Emmer wheat is tetraploid, self pollinated, non-free threshing, and is found in the few mountainous marginal areas of Italy (D’antuono et al. 1998) and in few states of India. Scientific studies on this wheat reveal that they are nutritionally superior as compared to commercially available wheat (Yenagi et al., 1999). Hence, on account of being a special food, emmer wheat always fetches premium price in the markets as compared to bread and durum wheats. Dehulling in emmer wheat is a laborious process and involves additional expenses. The hulled character is the result of two differences in the structure of the spike: the semi-brittle joints between the rachis internodes, and the toughened glumes. Mackey (1954) reported that a polygenic system is scattered through all three genomes that counteracts rachis brittleness and tough glumes. Kerber and Rowland (1974) reported that the recessive allele tg as well as Q factor must be present for the expression of free threshing character in hexaploid wheat. Consequently, there is an exigency to develop amber grained, free threshing, high yielding and multiple disease resistant semi-dwarf varieties without affecting the grain quality. If desired genetic variability or a specific character is not
available in a crop, then the mutation breeding is logic step. It is suggested that the application of
ISSN 0975-928X Materials and methods
The mutant population used for present study were derived from inter-specific hybridization cum mutation involving 2 parents representing each of emmer (DDK 1001 and DDK 1025) and durum wheat (DWR 1006 and HD 4502). All combinations of crosses were done by taking dicoccum as female and durum as male. Each hybrid and the parental lines were treated with chemical mutagen, EMS at 0.2, 0.3 and 0.4 per cent concentration and similarly, they were exposed to 150 Gy, 200 Gy and 250 Gy {Gy=Grey (1Gray= 0.1 krad)} gamma rays treatments from Cobolt60 source at BARC Trombay, Mumbai. Further the material was forwarded by selfing. A total of 92 free threshable mutants of M7F7 generation were selected based on yield, threshability, tough rachis and soft glumes and they were sown in two seasons of Kharif 2012 and 2013 by following Randomized Block Design (RBD) design with 2 replications of 1m row length with spacing of 20 cm X 10 cm. The recommended packages of practices were followed to raise a good crop stand. The observations from 5 randomly selected plants were recorded for days to 50% flowering, days to maturity, plant height (cm), number of tillers per plant, number of grains per spike, awn length (cm), grain yield per plant (g), 1000-grain weight (g), spike length (cm), number of spikelets/spike, protein (%), seed color, threshability and raches. Threshability data of individual spikes was recorded after harvest. Spikes were threshed with hand, based on percentage of husked seeds obtained, classified as free threshable (0-30), medium free threshable (31-60) and hard to thresh non free threshable (61-100) and spikes were observed for presence of rachis (100%) and absence of rachis (0%). The genetic divergence of those genotypes was studied by employing Mahalanobis' (1936) D2 technique. The varieties were grouped into a number of clusters with D2 being treated as the square of generalized distance, according to the method described by Tocher (Rao, 1952).
Results and Discussion
The increasing demand of high yielding varieties with nutritional superiority, poses a formidable challenge for genetic improvement of tetraploid wheat and dicoccum wheat in particular. The analysis of variance is not a reliable basis for measuring the extent of genetic diversity. In order to overcome this problem and to quantify genetic divergence between any two genotypes or group of genotypes, the numerical measure of diversity was obtained with the help of D2 statistics and constellations of genotypes into clusters was done.
Considerable amount of genetic diversity in the material representing different mutagenic treatments revealed no relation between mutagenic
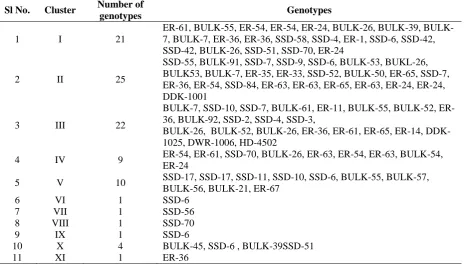
treatment and genetic diversity. On the basis of D2 values, all the mutant genotypes were grouped into 11 clusters (Table.1). The maximum number of genotypes were in cluster II (25 genotypes), followed by clusters III (22) and I (21). The genotypes falling in the same cluster are more closely related and hence the clusters having the maximum number of genotypes, reflected narrow genetic diversity. However clusters VI, VII, VIII, IX and XI were distinct from the rest with each of them having single genotypes (SSD-6, SSD-56, SSD-70, SSD-6 and ER-36 respectively), indicating their uniqueness from breeding point of view. Many free threshable mutants grouped in cluster III with two checks of durum DWR 1006 and HD-4502 along with one dicoccum check DDK-1006, it may be due to durrumization of free threshable mutants and also may be due to pleiotropic affects of Q locus on morphological characters such as rachis fragility, glume shape and tenacity, spike length and plant height, and spike emergence time which is in line with the findings of Mackey et al. (1954), Jantasuriyarat et al.
(2004), Muramatsu et al. (1963, 1986) and Kato et al. (1999, 2003).
It was noticed that, the fall of high yielding mutant line BULK-39 (455.5gm test weight with amber color grain, free threshable and fragile raches) with low protein mutant BULK-45 (8.2% protein content with amber colored grains) under same cluster (X), it may be conclussive evidence of high protein content were negatively correlated with yield. This negative correlation of high grain yield with high protein content was also recored previously by Subhashchandra et al. (2009) and Mevlut et al. (2009). Cluster I has got high protein content mutant line BULK-26 but it possess red grain color, low yield (169 gm) with free threshable and soft glumes. In general cluster II has got low yielding lines along with high protein content of amber color free threshable grain. In contraste, cluster X posses high yielding with low protein lines of red colored non free threshable, hardy glumes grains. Hence hybradization between these two cluster may helps to derive the segregents of high yielding, protein content along with soft glumes and free threshable spikes.
ISSN 0975-928X
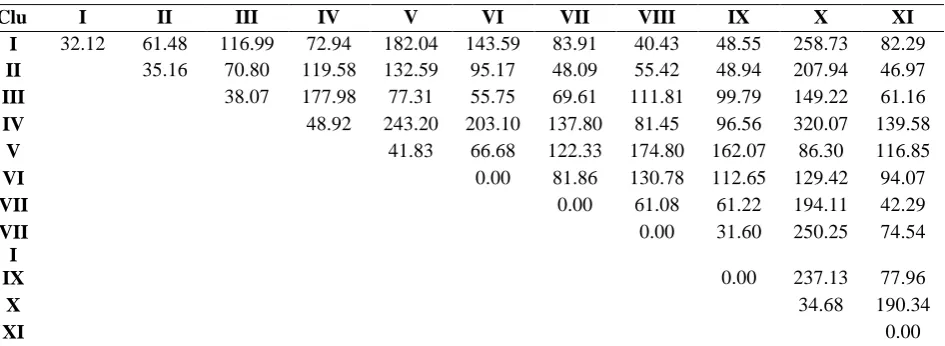
varying in magnitude (Table.3). It is always desirable to look for genotypes having more than one desirable trait but belonging to different clusters based on cluster mean values. It revealed that intracluster distance was maximum for cluster IV followed by clusters V and III. The clusters VI, VII, VIII, IX and XI were having only one genotype and thus had zero value. The widest inter cluster distance was noted between clusters IV and X followed by clusters I and X with giving scope for hybridization programme to improve genotypes in those clusters. In general, the X cluster showed relatively good inters clusters distances in combination with other clusters attributing the importance of genotypes in that cluster. The distance between cluster IX and VIII was minimum indicating closer relationship between those clusters. These results are in line with the research findings of Shamsuddin, et al. (1985), Faris, et al.
(2006), Arega, et al. (2007), Sharma, et al. (2008) and Ayed, et al. (2009).
The character contribution in cluster divergence (Table.4) revealed that the maximum contribution in cluster formation was attributed by grain yield (85.46) followed by number of number of tillers per plant (6.69), plant height (6.32) and grain weight (0.72), whereas, remaining traits played minor role in cluster divergence as attributed by present mutant wheat materials. Most of the lines selected were based on putative free threshability trait, hence the contribution of this traits for genetic divergence was nill, even though lines showed variation for this trait.
In summar, the 92 lines differ for traits like leaf angle, deposition of wax on leaf and on stem, plant stature shorter (50cm) to tall (106cm), less (12) to large (64) numbers of tiller, square head spike with green to black awns, spike compactness (normal to club shape), grain color (amber to red) protein content (8.22 to 15.65), test weight (33.30 to 57.65gm), raches fragility (non-fragile and brittleness of raches), glume shape and tenacity, hulled grain (non, medium and free threshable). Some of these lines exhibited threshability as that of durum types and quality of dicoccum types since contribution of positive alleles for almost all the productivity traits, quality and leaf rust resistance into durum background whereas, free threshability and test weight into dicoccum background. These results confer definite advantage of inter-specific hybridization cum mutation over simple inter-varietal hybridization. The study will also work as indicator for wheat breeders to evolve varieties with diverse genetic background to achieve sustainability in wheat production in the world.
References
Arega, G., Hussein M. and Harjit S., 2007. Genetic divergence in selected durum wheat genotypes
of Ethiopian germplasm.African Crop Sci. J., 15(2): 67-72.
Ayed S. and Slim-Amara H., 2009. Distribution and phenotypic variability aspects of some Quantitative Traits among durum wheat accessions. African Crop Sci. J., 16(4): 219-224.
D’antuono, L.F., Minelli, M. and Jaradt, A.A., 1998, Yield and yield components analysis of emmer wheat (Triticum dicoccum schulber) land races from Italy. Triticeae III: Proc. 3rd International Triticeae Symp., Aleppa, Syria, 4-8 May, 1998, pp.393-404.
Faris H., Arnulf M., Harjit S., Getachew B., and Johansson, E.,2006. Multivariate Analysis of Diversity of Tetraploid Wheat Germplasm from Ethiopia. Gen. Resour. and Crop Evol., 53(6): 1089-1098.
Gregory, W. C., 1956. The comparative effect of radiation and hybridization in plant breeding. Proc. 1st UN Conf. on Peaceful Uses of Atomic Energy, 12: 48-54.
Jantasuriyarat, C., Vales, M. I., Watson, C. J.W. and Riera-Lizarazu, O., 2004, Identification and mapping of genetic loci affecting the freethreshing habit and spike compactness in wheat (Triticum aestivum L.). Theor. Appl. Genet. 108: 261–273.
Kato, K., Miura, H. and Sawada, S., 1999. QTL mapping of genes controlling ear emergence time and plant height on chromosome 5A of wheat. Theor. Appl. Genet. 98: 472–477. Kato, K., Sonokawa, R., Miura H. and Sawada, S., 2003.
Dwarfing effect associated with the threshability gene Q on wheat chromosome 5A. Plant Breed. 122: 489–492.
Kerber E. R. and Rowland G. G. 1974. Origin of the free threshing character in hexaploid wheat. Canadian J. Genet. Cyt., 16: 145-154.. MacKey, J., 1954. Neutron and X-ray experiments in
wheat and a revision of the speltoid problem. Hereditas,40: 65–180.
Mahalanobis, P.C., 1936. On the generalized distance in the statistics. Proc. Natnl. Ins. of Sci., India, 2: 49-55.
Mevlut A., 2009. Genetic variability and interrelationship among grain yield and some quality traits in Turkish winter durum wheat landraces. Turk. J. Agric., 33: 547-556. Muramatsu, M., 1963. Dosage effect of the spelta gene q
of hexaploid wheat. Genetics, 48: 469–482. Muramatsu, M., 1986. The vulgare super gene, Q: its
universality in durum wheat and its phenotypic effects in tetraploid and hexaploid wheats. Can. J. Genet. Cytol. 28: 30–41.
Pratibha Kulkarni, 2005. Genetic studies on variability, free threshability and cluster association in the advanced breeding lines of dicoccum wheat (Triticum dicoccum Schrank, Suhulb). M. Sc. (Agri.) Thesis, University of Agricultural Sciences, Dharwad.
Ram, B., Sikka, V. K., Yunus, M. and Naidu, M. R., 1987. Polygenic variation in wheat following hybridization and mutagenesis. Ann. Biol., 3: 107-110.
ISSN 0975-928X
Shamsuddin, A. K. M., 1985. Genetic diversity in relation to heterosis and combining ability in spring wheat. Theor Appl Genet, 17(3): 306-308.
Sharma, R. K., 2008. Genetic divergence among some differentially heat tolerant genotypes of wheat. Agric. Sci. Digest, 28(1): 18-27.
Subhashchandra, Sudesh, R. K., Yadava, and Rana, O. P. S., 2002. Association and path analysis in homogenous generation for 'gigas' spike of
wheat (T. aestivum L. Em TheIl). Crop Res., 24(1): 67-71.
Yenagi, N. B., Hanchinal, R. R. and Suma, C., 1999. Nutritional quality of dicoccum wheat semolina and its use in planning therapeutic diets. Paper presented in 32nd Annual Meeting of Nutrition Society of India, Coimbatore, Tamil Nadu, India, 25-26 November, 1999.
Table 1. Distribution of 92 mutant genotypes along with 4 checks into 11 different clusters
Sl No. Cluster Number of
genotypes Genotypes
1 I 21
ER-61, 55, ER-54, ER-54, ER-24, 26, 39, BULK-7, BULK-BULK-7, ER-36, ER-36, SSD-58, SSD-4, ER-1, SSD-6, SSD-42, SSD-42, BULK-26, SSD-51, SSD-70, ER-24
2 II 25
SSD-55, BULK-91, SSD-7, SSD-9, SSD-6, BULK-53, BUKL-26, BULK53, BULK-7, ER-35, ER-33, SSD-52, BULK-50, ER-65, SSD-7, ER-36, ER-54, SSD-84, ER-63, ER-63, ER-65, ER-63, ER-24, ER-24, DDK-1001
3 III 22
BULK-7, SSD-10, SSD-7, BULK-61, 11, BULK-55, BULK-52, ER-36, BULK-92, SSD-2, SSD-4, SSD-3,
BULK-26, BULK-52, BULK-26, ER-36, ER-61, ER-65, ER-14, DDK-1025, DWR-1006, HD-4502
4 IV 9 ER-54, ER-61, SSD-70, BULK-26, ER-63, ER-54, ER-63, BULK-54, ER-24
5 V 10 SSD-17, SSD-17, SSD-11, SSD-10, SSD-6, BULK-55, BULK-57, BULK-56, BULK-21, ER-67
6 VI 1 SSD-6
7 VII 1 SSD-56
8 VIII 1 SSD-70
9 IX 1 SSD-6
10 X 4 BULK-45, SSD-6 , BULK-39SSD-51
ISSN 0975-928X
Table 2. Mean values of fourteen characters in eleven clusters of mutant lines
.
Sl. No. No. of clusters DFF DM PH NTP SL NSP NGP AL GYP TGW P COL FT RH
1 I 59.25 108.83 84.73 25.31 8.32 19.06 3.07 10.52 187.26 42.76 12.30 1.67 1.48 1.38
2 II 58.47 107.54 81.66 29.74 8.59 19.12 3.18 10.31 238.86 43.69 12.27 1.64 1.56 1.44
3 III 60.61 110.05 90.54 24.57 8.47 19.55 3.15 10.19 298.91 41.83 11.49 1.59 1.41 1.57
4 IV 59.28 109 78.23 30.72 8.66 18.25 2.83 10.08 126.50 43.04 12.02 1.56 1.39 1.56
5 V 66.2 114.65 89.63 29.05 9.03 18.78 3.23 11.09 365.40 40.58 11.36 1.70 1.45 1.50
6 VI 52.5 102.5 50.83 20 7.93 20 2.75 8.02 324.50 47.25 13.90 2.00 2.00 2.00
7 VII 54.5 104 63.08 62 5.83 17.25 2.25 7.17 255.50 46.00 11.85 2.00 1.50 1.00
8 VIII 53.5 103.5 62.33 46 9.58 15.75 3 11.42 197.00 49.15 13.70 1.00 1.50 2.00
9 IX 52.5 102.5 52.42 21 6.88 20 2 8.05 212.00 52.40 13.35 1.00 2.00 2.00
10 X 63.31 111.25 90.38 33.88 8.21 18.31 3.19 10.04 443.88 38.55 10.05 1.50 1.38 1.25
11 XI 61.5 110.5 103.58 56.5 5.6 15.75 3.25 7.77 257.00 50.00 13.90 2.00 1.00 1.50 DFF- Days to 50% flowring NSS - No. of spikelets/spike P - Protein content
DM- Days to maturity NGS - No. of grains/spike COL- Seed color PH - Plant height AL - Awn length FT - Free threshability NTP - No. of tillers/plant GYP - Grain yield/plant RH - Rachis
ISSN 0975-928X
Table 3. Average intra and inter cluster D² values of mutant genotypes. Diagonal value indicates intra cluster D2 values
Clu ster
I II III IV V VI VII VIII IX X XI
I 32.12 61.48 116.99 72.94 182.04 143.59 83.91 40.43 48.55 258.73 82.29 II 35.16 70.80 119.58 132.59 95.17 48.09 55.42 48.94 207.94 46.97 III 38.07 177.98 77.31 55.75 69.61 111.81 99.79 149.22 61.16
IV 48.92 243.20 203.10 137.80 81.45 96.56 320.07 139.58
V 41.83 66.68 122.33 174.80 162.07 86.30 116.85
VI 0.00 81.86 130.78 112.65 129.42 94.07
VII 0.00 61.08 61.22 194.11 42.29
VII I
0.00 31.60 250.25 74.54
IX 0.00 237.13 77.96
X 34.68 190.34
XI 0.00
Table 4. Per cent contribution of characters towards divergence in mutant population
Character Contribution
Days to 50% flowering 0.61
Days to maturity 0.2
Plant height (cm) 6.32
No. of tillers/plant 6.69
Grain yield/plant (g) 85.46
1000-grain weight (g) 0.72
Spike length (cm), No. of spikelets/spike, No. of grains/spike, Awn length (cm), Protein (%), Seed color, Threshability and