Vol.8 (2018) No. 2
ISSN: 2088-5334
Comparison of Low-Complexity Algorithms for Real-Time QRS
Detection using Standard ECG Database
Silvestri Francesca, Cardarilli Gian Carlo, Di Nunzio Luca, Fazzolari Rocco, Re Marco
Department of Electronic Engineering, University of Rome Tor Vergata, Via Del Politecnico 1, Rome, 00133, Italy
E-mail: [email protected], [email protected], [email protected], [email protected], [email protected]
Abstract— Today, thanks to the development of advanced wearable devices, it is possible to track patient conditions outside hospital setting for several days. One of the most important bio-signals used for health analysis is the electrocardiographic (ECG) signal. It provides information about the heart rate, rhythm, and morphology of heart. Many algorithms are proposed over years for automated ECG analysis. Due to their computational complexity, not all these techniques can be implemented on wearable devices for real-time ECG detection. In this frame, a particular interest is toward the algorithms for automatic QRS detection. Different algorithms have been presented in the literature. Among all, more suitable class for the implementation on embedded systems is based on the use of signal derivatives and thresholds. These algorithms are composed by pre-processing stage, for the noise removal, and decision stage for the QRS detection. In literature, the different algorithms were discriminated only with respect to their pre-processing stages. Furthermore, not all algorithms were tested with standard database: this makes the results difficult to compare and evaluate. Moreover, the algorithms performance in case of pathological behaviours was not compared. This paper is motivated by the need to perform a comparison of the whole algorithms, both pre-processing and decision stages, under a standard database (MIT-BIH ECG database of Physionet), either for non-pathological and pathological signals. The results confirm that the Pan & Tompkins algorithm has the best performance in terms of QRS complex detection. However, in some cases, its performance is comparable with the other algorithms ones. For this reason, in the applications in which the reduced of computational complexity is an important constraint, it is possible to implemented algorithms with comparable performance but with lesser complexity with respect to P&T algorithm.
Keywords— QRS detection; ECG processing; wearable computing; real-time analysis; low power.
I. INTRODUCTION
The electrocardiographic signal (ECG) is one of the most commonly bio-signals used for the analysis and monitoring of health conditions. It represents a non-invasive method to evaluate pathophysiological condition of the heart. In Fig.1 a normal ECG signal is shown. It consists of P wave, QRS complex and T wave.
Fig. 1 ECG signal.
The QRS complex is the most important part of the waveform and represents the electrical activity of the heart during the ventricular contraction. The position of its peak
(R-peak) is the most evident feature and the distance between more consecutive R-peaks (RR period) is a relevant parameter in the analysis of heart pathologies [1]. Heart disease has become one of the leading causes of death worldwide [2]. The incidence of cardiac diseases could be reduced by predicting the acute phase of the disease with long-term trend analysis. For this reason, in the last 30 years, several techniques are developed to recognize and analyse the ECG waves, particularly for the detection of QRS complexes.
present in the ECG signal [5]. Typical examples of these disturbs are baseline noises, power line interference, electrode contact noise, and motion artifacts. The presence of these noises makes the automatic detection of QRS complexes very difficult and it is necessary an onerous pre-processing stage to treat the signal. Therefore, in order to provide real-time ECG analysis, most of these algorithms must be implemented on high-performance computing units, such as a personal computers, very powerful micro-controllers or DSP. Today, the need to monitor heart conditions outside the hospital for several days has increased the use of processing systems characterized by low costs and small size, such as wearable devices [6]. On these wearable systems, the implementation of low computational cost algorithms is the main solution to ensure real-time operation. The speed and the complexity of elaboration are important parameters to obtain the real-time detection. Reducing the computational complexity, it is possible to use less powerful systems with respect to personal computers (such as low-power micro-controllers). These devices can operate without connection to an external power supply, or using, for a very long time, a battery. In this context, not all the algorithms for the QRS detection can be implemented on wearable devices. The trade-off between the algorithm performance and the computational cost is an important issue that reduces the algorithm classes that can be used in this class of applications. In this case, the less complex class of algorithms (i.e., those with lower calculation time) is based on the use of signal derivatives and thresholds. In general, these algorithms are composed of two different parts, the pre-processing stage, for the noise removal, and the decision stage for the detection of the QRS complexes in ECG signal (Fig. 2).
Fig. 2 QRS detector.
In literature, there are different works which compare the performance of QRS detectors [3] [7]. In [3], the different algorithms are discriminated only with respect to their pre-processing stages. The decision stages are not compared because most of them are rather heuristic and the performance are mainly dependent on the pre-processing section [3]. In addition, the comparison is not homogeneous. Different ECG signals are used for the evaluation of the performance of the different algorithms. In other comparisons, as in [7], the algorithms are tested using a not standard database. This makes the results difficult to compare and evaluate. Finally, these comparisons do not consider the algorithm performance in case of pathological behaviours.
The main objective of this paper is to improve the comparison of the QRS detection methods under two aspects. The first one is the need to achieve a performance comparison of the algorithms using a homogeneous and standard ECG database. This makes the results comparable and reproducible [8]. The second is to consider the whole
algorithms, both the pre-processing and decision stages. In particular, the authors implemented the algorithms based on signal derivatives and digital filters and used the MIT-BIH ECG database [9]. Moreover, in order to stress the performance of the algorithms, seven typologies of signals, physiological and pathological, were used.
The paper is organized as follows: in Sect. II the material and methods are given. In particular, an overview of algorithms based on signal derivatives and digital filters and simulation setup are proposed. In Sect. III results and discussion are provided, and finally, in Sect. IV conclusions are discussed.
II. MATERIAL AND METHODS
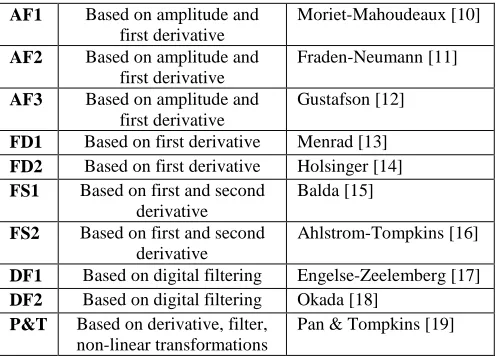
Tab.1 shows a classification of algorithms. There are four basic types of algorithms with at least two variants for each type. The first class (AF) is based on signal amplitude and first derivative. The second (FD) and third (FS) classes are based on first and second derivatives.
TABLEI
DERIVATIVES AND DIGITAL FILTERS-BASED ALGORITHMS
AF1 Based on amplitude and first derivative
Moriet-Mahoudeaux [10]
AF2 Based on amplitude and first derivative
Fraden-Neumann [11]
AF3 Based on amplitude and first derivative
Gustafson [12]
FD1 Based on first derivative Menrad [13] FD2 Based on first derivative Holsinger [14] FS1 Based on first and second
derivative
Balda [15]
FS2 Based on first and second derivative
Ahlstrom-Tompkins [16]
DF1 Based on digital filtering Engelse-Zeelemberg [17] DF2 Based on digital filtering Okada [18]
P&T Based on derivative, filter, non-linear transformations
Pan & Tompkins [19]
These algorithms, thanks to the derivative, are able to exploit the steep slope of the QRS complex for its detection. Since the derivative represents a high-pass filter, other signal components, such as the P- and T- waves, are attenuated, as well as the baseline derivatives. The high-pass filter is often realized as a differentiator. In the last two classes, DF and P&T algorithm, the algorithms work with a digital filtered version of the ECG signal. In all these algorithms, the processed signal is then used for the generation of features. The occurrence of a QRS complex is detected by comparing the feature with a fixed (in AF1 ÷ DF2) or adaptive (in P&T) threshold.
A. Algorithm Based on Amplitude and First Derivative
1) Moriet - Mahoudeaux Algorithm [10]: in the first step, the amplitude threshold is calculated. It corresponds to 30% of the signal maximum value:
where, represents an array containing M-ECG samples. A typical value of M is 8192 corresponding to about 30 seconds of ECG signal.
Then, the first derivative is calculated:
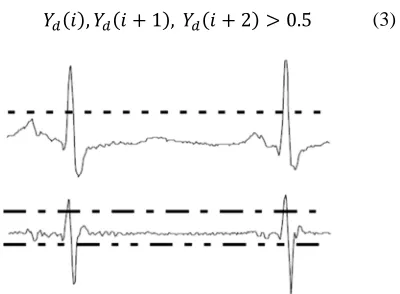
Typically, the rise slope of the QRS complex lasts no more than 30 ms and its amplitude is typically between 1 mV and 3 mV. Therefore, there are at least three consecutive points ( , 1 and 2 ) of the first derivative that exceed the 0.5 mV threshold (Fig.3b, dash dot line).
Fig. 3: Processed ECG signal. (a) ECG signal and detection threshold (dashed line). (b) First derivative, positive threshold (dash dot line), and negative threshold (dash double dot line).
Since a QRS complex, in general, lasts about 25 points, in the next 23 points after 2 the first derivative becomes positive. Therefore, the algorithm verifies that the samples and 1 , with 2 25 , exceed the -0.3 mV threshold. This value is less than 0.5 mV because the slope of the RS segment is less with respect to the slope of the QR segment.
, 1 0.3
2 25
(4)
Finally, it verifies that the ECG signal is greater than amplitude threshold (Eq.1) in all points found (Fig.3a):
2) Fraden - Neumann Algorithm [11]: this algorithm is an adaptation of the analog QRS detection scheme developed by Fraden and Neumann in 1980. In this case, the amplitude threshold is equal to 40% of the signal maximum value:
th 0.4 ∙ max ECG n $ 0 < n < M (6)
The raw signal is then rectified, according to Eq.7:
% & ' ' 0 ( 0 (7)
The rectified signal % is subjected to a process called "low level clipper":
) &*+,-.+/01 ' % ' % ( *+
% *+
(8)
Then, the first derivative is calculated:
) 1 ) 1 (9)
Finally, a QRS complex is identified if:
0.7 (10)
3) Gustafson Algorithm [12]: the first derivative Yd(n) of
the signal is calculated:
1 1 (11)
Then, a decision rule is applied. A QRS complex is identified if the first derivative is greater than 0.15 for four consecutive points and if the first derivative and the original ECG signal have the same sign in the two centre points:
, 1 0.15
and
2 , 3 0.15
(12)
1 ∙ 1 0
and
2 ∙ 2 0
(13)
B. Algorithms Based on First Derivative
1) Menrad Algorithm [13]
: i
n this algorithm, the firstderivative Y4 n is calculated in according to:
2 2
1 1 2
(14)
Then, the threshold is calculated as 70% of the maximum value of the first derivative:
*+,-.+/01 0.7 ∙ 567 $ (15)
Finally, QRS complex occurs if:
8 *+,-.+/01 (16)
*+ 0.3 ∙ 567 $ 0 < n < M (1)
1 1 (2)
, 1 , 2 0.5 (3)
2) Holsinger Algorithm [14]: Holsinger algorithm is very similar to Menard algorithm. In the first step, the first derivative is calculated:
Then, a decision rule is applied. QRS complex occurs if first derivative is greater than 0.45 for four consecutive points:
, 1 0.45
and
2 , 3 0.45
(18)
C. Algorithms Based on First and Second Derivatives
1) Balda Algorithm [15]: in this approach, the modules of the first Y4 n and second Y: n derivatives are calculated:
Y4 n ABS ECG n 1 ECG n 1 $ (19)
Y: n ABS ECG n 2 2ECG n
ECG n 2 $
(20)
The weighted sum of the two modules is calculated:
> 1.3 ∙ 1.1 ∙ (21)
A QRS complex occurs if the weighted sum is greater than 1.0 for at least six of eight consecutive points.
> 1 , > 2 , … , > 8 1 (22)
2) Ahlstrom-Tompkins Algorithm [16]
: t
he modules ofthe first Y4 n and second Y: n derivatives are calculated:
Then, the first derivative module is filtered, according to the differentiated equation:
> 1 2 1 (25)
The filtered first derivative module and the second derivative module are summed:
@AB > C (26)
The two thresholds for decision rule are calculated (Fig. 4):
*+D 0.8 ∙ 567 @AB $
*+E 0.1 ∙ 567 @AB $
(27)
Fig.4: The weighted sum, the first threshold th1 (dashed line), and the second threshold th2 (dash dot line).
Finally, decision rule is applied. A QRS complex occurs if one point of @AB is greater than th1, and if the
following six points are greater than th2:
@AB *+D
@AB 1 , … , @AB 6 *+E
(28)
D. Algorithms Based on Digital Filter
1) Engelse-Zeelenberg Algorithm [17]: the first
derivative Y4 n is calculated as follow:
5 (29)
The result is then filtered through the low-pass filter according to the differentiated equation:
> 4 1
+ 6 2 4 3 4
(30)
Finally, the rule of thumb is applied. A QRS complex occurs if exists a point where YG4 n > 21 and if at least one of the conditions in Tab.2 is true.
TABLEII
ENGELSE-ZEELENBERG ALGORITHM CONDITIONS
Condition 1 > 21 0 16
Condition 2 > 21 0 16
> H 21 H 16
Condition 3 > 21 0 16
> H 21 H 16
> 0 21 H 0 16
2) Okada Algorithm [18]
:
t
he first step of this algorithmis different with respect to the others. The ECG signal is filtered by moving-window-low-pass filter, in according to Eq.31:
1 2 1
4 (31)
Then, another low-pass filter is applied to reduce baseline artifacts:
1 1 (17)
Y4 n ABS ECG n 1 ECG n 1 $ (23)
Y: n ABS ECG n 2 2ECG n
ECG n 2 $
> 1
25 1 ∙ I H
JKB
LMNOB
(32)
where, N = Okada number. Then, the square of the difference between input and output is calculated:
Y4PQ n RY n YG n SE (33)
The resulting Y4PQ n is filtered:
>TU TU ∙ V I H
JKB
LMNOB
W
E (34)
The final signal is calculated in according to Eq.35:
X & >TU ' Y 0
0 /*+-,Z
.-(35)
The decision rule is fixed at 12.5% of maximum value of the signal. A QRS complex occurs if:
X 0.125 (36)
E. Pan & Tompkins Algorithm
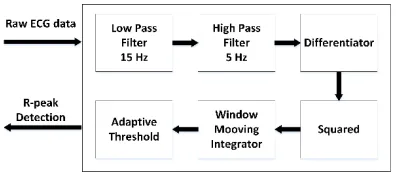
Pan & Tompkins algorithm identifies QRS complex based upon digital analyses of slope, amplitude and width [19]. An overview of the algorithm is shown in Fig.5.
Fig. 5: Pan & Tompkins Algorithm
Software QRS detectors includes linear digital filtering, non-linear transformation, and decision rule algorithms. The first two operations of the algorithm consist in the application of two IIR filters, 15 Hz low-pass filter (Eq.37) followed by a 5 Hz high-pass filter (Eq.38) [19].
y n 28 1 8 2 7
27 6 7 12
(37)
y n 8 1 \ED7 7 16
7 17 \ED7 32
(38)
The resulting band-pass filter removes noise due to power line interference, baseline wander, motion artefacts, muscle contraction, and electrode contact. Then the signal is differentiated as shown in Eq.39 to obtain slope information.
y n D] 27 7 1 7 3
27 4 $
(39)
The differentiated output is then squared to maximize the amplitude difference of QRS complex with other peaks, as shown in Eq.40:
y n 7 $E (40)
The squared output signal passes through a moving windows integrator to smooth the signal, for removing the fluctuations in signal peaks. For a sampling frequency of 200 Hz, the window width is typically chosen equal to 32, as shown in Eq.41.
y n \ED 8 8 1 ⋯
8 32 $
(41)
After the signal has been filtered, QRS peaks are detected. The detection rules algorithm use peak height, peak location, and maximum derivative to classify peaks. When a peak occurs, it is classified as either QRS complex or noise. At each peak higher than detection threshold and classified as QRS complex, the algorithm associates a spike. The detection threshold is automatically calculated using the estimate of the average QRS peak and the average noise peak.
F. Simulation Environment
The whole algorithms, both pre-processing stages and decision stage, presented in the previous session have been implemented in Matlab. The simulation environment is shown in Fig. 6.
Fig. 6: Simulation Environment
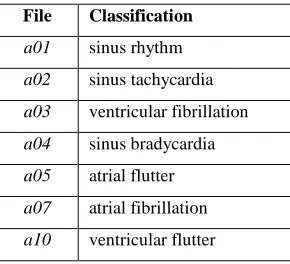
TABLEIII
APNEA-ECG SIGNALS CLASSIFICATION
The second block of Fig. 6 represents the Matlab environment in which both pre-processing and decision stages are implemented in order to detect QRS complexes. Finally, the last block represents the performance comparison between all algorithms. In particular, to evaluate the performance of the algorithms, two standard parameters [21], Episode Sensitivity (_`) and Episode
Predictivity ( P), are calculated according to Eq.42 and
Eq.43:
_` bc debc (42)
c bc dcbc (43)
where, TP denotes the number of true positives detections, FN the number of false negatives, and FP the number of false positives. In particular, _` expresses the sensitivity of the algorithm to identify QRS complexes. Whereas, P is a measure of the inclination to incur in a false detection.
III.RESULT AND DISCUSSION
The simulation results for _` are depicted in Fig.7 and Fig.9, whereas those for P in Fig.8 and Fig.10. In particular, Fig.7 and Fig.8 show, respectively, the average percentage values of Sensitivity and Predictivity with respect to the applied algorithms, whereas Fig.9 and Fig.10 show, respectively, the average percentage values of Sensitivity and Predictivity with respect to the type of ECG signal used (Table.3).
Fig.7 shows a substantial difference between the P&T algorithm with respect to the other ones. In fact, P&T reaches the average percentage greater than 80% for
Sensitivity _`, whereas the other algorithms range between
55% and 75%.
Considering, instead, the results shown in Fig.8, the average behaviour of all algorithms is similar (between 70% and 80%). Of course, in both cases the number of False
Negative for _` and False Positive for P is not negligible.
The only P&T algorithm has an average percentage more or less similar in both cases _` and P, whereas the behaviour of others algorithms is worse for the _`. The algorithms based on signal derivatives are very simple to implement. Moreover, these methods also have the advantage of
avoiding the manual segmentation of data, training of the algorithms, or patient-specific modifications that are often required for other detection methods [3]. Although the derivatives phase exalts the components at a higher frequency of QRS complex and attenuating the components at a lower frequency of P- and T-waves, the performance of these algorithms strongly depends on the time trend of ECG signal.
Fig. 7: Average percentage Sensitivity (Se) of algorithms (%)
In fact, the fixed threshold is set on the base of the processing of the first ECG samples and applied at whole signal. In this way, if there is a rapid variation of the signal, for example due to motion artifacts, the threshold will be set to a high value, with the risk that the amplitude of the physiological signal is chopped out. The Pan & Tompkins algorithm, instead, presents better performance in term of QRS detection. The adaptive threshold makes possible the update in real-time of the characteristics of the signal. Moreover, the digital filtering removes noise and emphasizes the QRS complex with respect to the P- and the T wave, limiting False Positive.
Fig. 8: Average percentage Episode Predictivity (+P) of algorithms (%)
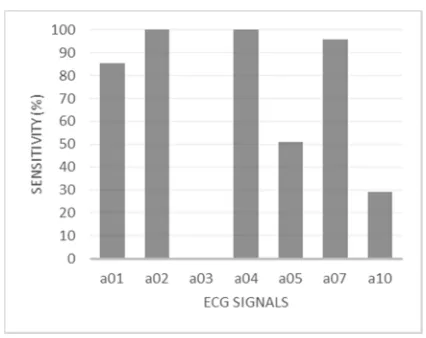
Fig.9 and Fig.10 give information about the average percentage values of _` and P of each single ECG signal used.
File Classification
a01 sinus rhythm
a02 sinus tachycardia
a03 ventricular fibrillation
a04 sinus bradycardia
a05 atrial flutter
a07 atrial fibrillation
Fig. 9: Average percentage Sensitivity (Se) for each ECG signal (%)
In both figures, is possible to observe that none algorithm was able to detect QRS complex in the ECG signal a03 (severe ventricular fibrillation). In this case, the algorithms attempt to detect the QRS complexes, but their identification is impossible due to the absence of the electrical activity able to generate the QRS wave. The second signal with the lowest average percentage Sensitivity for QRS detection was a10. In this case, the algorithms under test had a lot of False Negative and False Positive making both Sensitivity and Predictivity lower than 30%. The last noteworthy ECG signal is a05. It had a low identification rate for Sensitivity, whereas the performance for Predictivity is similar to the other algorithms.
Fig. 10: Average percentage Episode Predictivity (+P) for each ECG signal (%)
In a05, the loss of baseline due to the atrial flutter increases False Negatives, making difficult, and often impossible, the QRS complexes identifications. In these cases, an adaptive tuning of signal characteristics could make the QRS detection better with respect to a static algorithm. On the other hand, the adaptive algorithm could be more vulnerable to errors due to signal noise, with an increase of the False Positive cases.
IV.CONCLUSIONS
In this work, the authors analysed algorithms for real-time QRS detection in order to provide a comparison of both pre-processing and decision stages of algorithms. Moreover, to achieve comparable results, a homogeneous and standard ECG database was used. The algorithms under test have been chosen for their suitability to be implemented on low-performance devices, such as micro-controllers. Algorithm simulations were performed in Matlab. The results show that Pan & Tompkins algorithm, on average, has the best performance for both Sensitivity _` and
Predictivity P in all analysed ECG signals. These results
also show that all algorithms fail the QRS detection when they analyse an ECG signal with a severe ventricular fibrillation (signal a03), and they have a bad behaviour when atrial or ventricular flutters make the baseline lose (signals a05 and a10). In conclusion, despite Pan & Tompkins algorithm has always the best performance, in some cases, its performance is comparable with the performance of other algorithms. In the applications where computational complexity and time consuming are important constraints, it is possible to implement alternative algorithms with comparable performance but lesser complexity than Pan & Tompkins algorithm.
A further improvement for algorithm performance can be obtained using a different hardware approach, based, for example, on hardware accelerators as shown in [22], [23], [24], [25], [26], [27] and [28].
REFERENCES
[1] Braunwald E.(ed), Heart Disease: A Textbook of Cardiovascular
Medicine, Fifth Edition, Philadelphia, W.B. Saunders Co, 1997.
[2] World Health Organization, Cardiovascular Diseases (CVDs). 2014. [3] Bert-Uwe Kohler, Carsten Henning, Reinhold Orglmeister, The
principles of software QRS detection, IEEE Engineering in Medicine
and Biology, January, February 2002.
[4] Ferroni, Patrizia, Fabio Massimo Zanzotto, Noemi Scarpato, Silvia Riondino, Umberto Nanni, Mario Roselli, and Fiorella Guadagni,
Risk Assessment for Venous Thromboembolism in Chemotherapy-Treated Ambulatory Cancer Patients, in Medical Decision Making,
37 (2): 234-42, 2017. doi:10.1177/0272989X16662654.
[5] John G. Webster, Medical Instrumentation: Application and Design, 4th Edition.
[6] M. Chan, D. Est_eve, J.Y. Fourniols, C. Escriba and E. Campo,
Smart wearable systems: current status and future challenges, in
Artificial Intelligence in Medicine, 56, pp. 137-156, 2012.
[7] Gary M. Friesen et all., A Comparison of the Noise Sensitivity of
Nine QRS Detection Algorithms, IEEE Transaction on Biomedical
Engineering, vol. 37, No. I, January 1990.
[8] George B. Moody and Roger G. Mark, “The Impact of the MIT-BIH
Arrhythmia Database”, IEEE Engineering in Medicine and
Biology, Vol: 20, Issue: 3, May-June 2001.
[9] Massachusetts Institute of Technology, MIT-BIH ECG database. Available: http://ecg.mit.edu/.
[10] P.M. Mahoudeaux, Simple Microprocessor based system for on line
ECG Analysis, Med. Biol.Eng. Computing, vol. 19, pp497-500, 1981.
[11] J.F. M.R. Neumann, QRS wave detection, Med. Biol.Eng. Comput., vol 18, pp 125-132, 1980.
[12] D.E. Gustafson et all, ECG/VCG Rhythm Diagnosis Using Statistical
Signal Analysis Identification of Persistent Rhythms, Biomedical
Engineering IEEE Transactions on, vol.BME-25 pp.344-353, 1978. [13] A. Menrad, Dual Microprocessor System for Cardiovascular Data
Acquisition, Processing and Recording. IEEE pp. 64-69, 1981.
[14] W.P. Holsinger, K.M. Kemper, and M.H. Miller, A QRS
Preprocessor Based on Digital Differentiation, Biomedical
[15] R.A. Balda, J.H.Van Bemmel, J.L. Willems, Trends in
Computer-Processes Electrocardiograms. 1977.
[16] M.L. Ahlstrom, WJ. Tompkins, Automated High Speed Analysis of
Holter Types with Microcomputers, Biomedical Engineering, IEEE
Transaction on, vol. BME-30, pp 651-657, 1983.
[17] W.A.H. Engelse, C. Zeelemberg, A simple scan algorithm for QRS
detection and feature extraction, IEEE Computer Society, pp 37-42,
1979.
[18] M. Okada, A Digital Filter for the QRS Complex Detection, Biomedical Engineering, IEEE Transaction on, vol. BME-26, pp 700-703, 1984.
[19] J. Pan and W.J. Tompkins, A real-time QRS detection algorithm, IEEE Trans. Biomed. Eng., vol. BME-32, pp. 230-236, 1985. [20] Massachusetts Institute of Technology, The Apnea-ECG Database.
Available: https://www.physionet.org/physiobank/database/apnea-ecg/.
[21] ANSI/AAMI EC57: Testing and reporting performance results of cardiac rhythm and ST segment measurement algorithms (AAMI Recommended Practice/American National Standard, 1988. Available: http://www.aami.org.
[22] F. Silvestri, S. Acciarito, G.C. Cardarilli, G.M. Khanal, L. Di Nunzio, R. Fazzolari, M. Re, FPGA Implementation of a Low-power
QRS extractor, in Lecture Notes in Electrical Engineering, 2018
(Article In Press).
[23] Cardarilli, G.C., Di Nunzio, L., Re, M. Arithmetic/logic blocks for
fine-grained reconfigurable units (2009) Proceedings - IEEE
International Symposium on Circuits and Systems, art. no. 5118184, pp. 2001-2004
[24] Cardarilli, G.C., Di Nunzio, L., Fazzolari, R., Re, M., Lee, R.B.,
Butterfly and inverse butterfly nets integration on Altera NIOS-II embedded processor, Conference Record - Asilomar Conference on
Signals, Systems and Computers, art. no. 5757737, pp. 1279-1283. [25] Cardarilli, G.C., Di Nunzio, L., Fazzolari, R., Pontarelli, S., Re, M.,
Salsano, A., Implementation of the AES algorithm using a
Reconfigurable Functional Unit, ISSCS 2011 - International
Symposium on Signals, Circuits and Systems, Proceedings, art. no. 5978668, pp. 97-100.
[26] Cardarilli, G.C., Di Nunzio, L., Fazzolari, R., Re, M., Fine-grain
reconfigurable functional unit forembedded processors, Conference
Record - Asilomar Conference on Signals, Systems and Computers, art. no. 6190048, pp. 488-492.
[27] Cardarilli, G.C., Di Nunzio, L., Fazzolari, R., Pontarelli, S., Re, M.,
A reconfigurable functional unit for modular operations, Lecture
Notes in Electrical Engineering, 289, pp. 141-152.
[28] Cardarilli, G.C., Di Nunzio, L., Fazzolari, R., Re, M., TDES
cryptography algorithm acceleration using a reconfigurable functional unit, 21st IEEE International Conference on Electronics,