ISSN 0975-928X
Research Article
Variability among Rice (
Oryza sativa
L.) Genotypes for Physicochemical,
Cooking and Antioxidative properties for exploitation in quality breeding
R. S. Pal , R. Arun Kumar, J. P. Aditya, P. K. Agrawal, K. K. Mishra and J. C. Bhatt
ICAR-Vivekananda Institute of Hill Agriculture, Almora, Uttarakhand, Email: [email protected]
(Received:27 Jan 2015; Accepted:27 Mar 2015)
Abstract
In the present investigation, 67 advance genotypes of rice were analyzed for their physicochemical, cooking, pasting and antioxidant properties. Wide variations were observed in most of the traits under study such as amylose (9.96–22.43%), amylopectin (77.57–90.04%), starch (20.65–52.11%), volume expansion ratio (1.71– 4.67 ml), length of blue gel (59.00–116.00 mm) and cooking time (19–26 minutes). Peak viscosity and final viscosity were found to be highest in genotype VL-7852 (292.5 RVA) and VL-30425 (496.08 RVA), respectively. Antioxidative activities were found correlated with total polyphenols. DPPH radical inhibition was recorded in the range of 9.23-17.34 μM Trolox equivalents/g DW, while ferric reducing antioxidant power (FRAP) was in the range of 6.76-30.19 μM Trolox equivalents/g DW. Principal component analysis (PCA) was done to find out relationships among groups of variables in a data set and between genotypes. Two major clusters were formed using agglomerative hierarchical clustering (AHC) that explained good variation in the traits. The existence of wide variability for various parameters in the present study suggests that the selected genotypes might be useful for rice breeders working on the development of new varieties with value-added traits.
Key words
Variability; Oryza sativa; Cooking quality; Antioxidative properties
Introduction
Rice (Oryza sativa, L.) is the major food grain crop and has been considered to be the best staple food among all other cereal grains owing to its superior nutritional quality. India is well known as a rice producing country with 95.32 million tonnes during the 2011-12 and area under paddy cultivation was increased by six per cent to about 44.50 million hectares (GOI annual report, 2011-2012). The characterization of rice in relation to consumers and export is attributed to physicochemical, cooking and eating qualities. The cooking and eating qualities of rice are basically determined by the properties of the starch (Wani et al., 2012). Rice starch is usually digested quite rapidly as compared to other starchy foods. The gelatinization temperature, volume expansion ratio, water uptake, gel consistency, amylose, amylopectin and starch content are the significant properties that influence the cooking and eating characteristics of rice grains (Wani et al., 2012). Gelatinization temperature determines the time required for cooking rice. It directly affects the physical properties of the starch granule, which in turn influences the quality ratings of cooked rice. Harder gel consistency is associated with harder cooked rice and this feature is particularly evident in high-amylose rice. If gel consistency is soft, the cooked rice has a higher degree of tenderness. An increase in gelatinization temperature has been observed with the decrease in alkali spreading
value of rice starch. Many of the cooking and eating characteristics of milled rice are influenced by the ratio of two kinds of starches, amylose and amylopectin. If amylose content is high, the rice grains will show high volume expansion ratio and high degree of flakiness. The rice grains cook dry, are less tender and become hard upon cooling. If amylose content is low, the rice grains will cook moist and sticky (Wani et al., 2012). In rice varieties, not only the physicochemical, cooking and eating qualities but also the pasting characteristics play important role in quality determination (Rachmat et al., 2006).
ISSN 0975-928X
antioxidative properties to be utilized for future rice breeding programmes .
Materials and methods
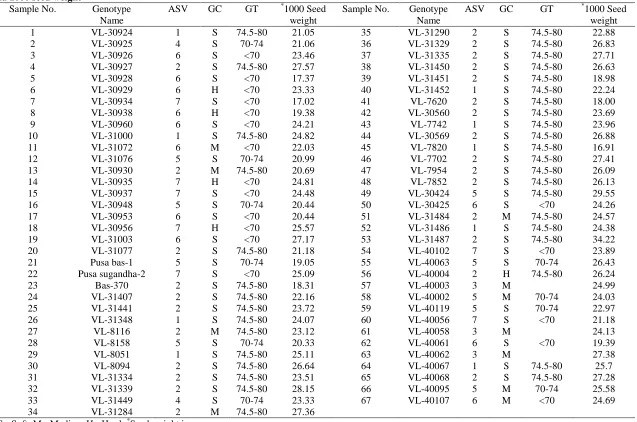
Plant Material: The experimental materials consisting of 67 advanced breeding genotypes of rice (Oryza sativa L.) that were grown at the experimental farm, Hawalbagh, Almora (29°56′ N, 79°40’ E and 1250 m above MSL) under North-western Indian Himalayan conditions during kharif season 2011-12, in randomized block design with three replications. Grains with translucent pericarp were harvested and sun-dried to bring the moisture content up to 12-14% for the analysis. Details of genotypes were presented in Table 1. Preparation of rice flour for analysis was done shortly before analysis by using Newport scientific super mill grinder with a 0.25 mm sieve. The whole grain and rice flour samples of each genotype were kept at 40C in screw-capped plastic containers for further use. All the experiments were done in triplicate and results were expressed on dry weight basis.
Determination of Physicochemical Properties: Volume expansion ratio (VER) was determined as volume of cooked rice to volume of raw rice by following the procedure of Juliano (Juliano, 1972). Alkaline spreading value (ASV) was estimated by following the standard method of Juliano and Villareal (1993) and the spreading of each grain was rated visually by 7-point numerical scale. A low ASV corresponds to a high gelatinization temperature (GT) and vice-versa. Gel consistency (GC) was determined based on the consistency of milled rice paste gelatinized by boiling in dilute alkali and cooled to room temperature (Little et al., 1958). The degree of disintegration and the transparency of paste dissolved out of the kernels were evaluated using a 7 point scale (Bhattacharya, 1979). Starch and amylose content were estimated by anthrone and iodine reagent respectively (Juan et al., 2006). Amylopectin was calculated by using formula:
%
%
100
(%)
amylose
n
amylopecti
(Janeet al., 1999). Protein content was estimated by dye- binding method (Bradford, 1976).
Determination of Cooking Quality:Water uptake (WU) is considered as an important economic attribute of rice as it gives an indirect measure of volume increase on cooking. For water uptake measurement, standard method (Anonymous, 2004) was followed. Cooking time and solids released by rice into cooking water have also been considered as a cooking quality attributes (Juliano, 1972). Cooking time (CT) and solids in cooking water (SCW) were determined by following the methods as reported by Oko et al. (2012).
Determination of Pasting Properties:
The pasting behaviour was studied with Rapid Visco-analyser (RVA) (Newport Scientific, Australia) using rice flour slurries (12% concentration on dry matter basis). The temperature–time conditions included a heating step from 50 to 950C at a rate of 7.50C /min, a holding period of 5 min at 950C followed by a cooling step to 500C at the same rate and a holding period of 1 min at 500C. The bowl speed was 160 rpm. Peak time, peak viscosity, trough viscosity, final viscosity, breakdown viscosity and setback viscosity were recorded and analyzed with the Thermocline Windows Data Collection (Newport Scientific, Australia) software.
Determination of Antioxidative properties: Rice water extract of all rice genotypes were prepared. Milled rice flour (10 g) and water (250 mL) were mixed, and heated at 1000C for 15 min. Water extract was filtered and followed by centrifuged at 1500×g for 10 min. Rice extracts were used to determine total polyphenols content and antioxidative properties as per standard methodologies. The total polyphenolic (TPP) compounds were determined by Folin Ciocalteu reagent (Singleton and Rossi, 1965) and calculated from a standard calibration curve based on tannic acid (0–0.1 mg/mL) and the results were expressed as tannic acid equivalents in mg per g dry weight (mg TAE/g DW). Scavenging effects on DPPHand 2,2-azobis-3-ethylbenzthiazoline-6-sulphonic acid (ABTS) free radicals by rice aqueous extract was measured following standard methods (Brand-Williams et al., 1995; Arnao et al., 2001) respectively. Trolox was employed as a reference and the DPPH radical scavenging activity was expressed in µM Trolox equivalents (TE)/ g dry weight while ABTS radical scavenging activity was expressed in percent inhibition. The ferric reducing antioxidant power (FRAP) assay was followed as suggested by Benzie and Strain (1996).
Statistical analysis:Data represent the mean of three samples of one replication for each rice genotype. The genotypic mean value of each parameter was used for statistical analysis using SPSS programme (SPSS Inc., Version 10, Chicago, Illinois, IL, USA). For multifactorial comparison, the classification and discrimination of rice genotypes using physicochemical, cooking and antioxidative properties were attained by PCA and AHC using JMP 9.2 and SAS 9.3 softwares. Varimax method was performed to produce orthogonal transformations to the reduced factors to identify the high and low correlations.
Results and Discussion
ISSN 0975-928X
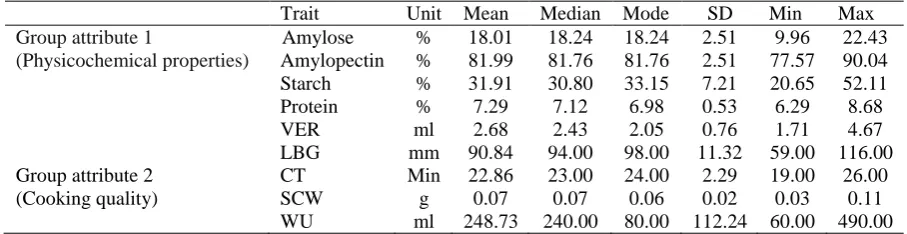
physicochemical and cooking attributes (Table 2). This is due to wide genetic basis of the tested rice genotypes. Most of the rice genotypes exhibited less than 20 percent amylose (low amylose rice) with a wide variation between 9.96 (VL-31441) and 22.43% (VL-7620) suggesting that there are considerable levels of genetic diversity. Most consumers prefer rice with intermediate or lower amylose content (Rachmat et al., 2006). Similarly, considerable variations were observed in amylopectin and starch content. Amylopectin and starch content ranged from 77.57 (VL-7620) to 90.04% (VL-31441) and from 20.65 (VL-31334) to 52.11% (VL-40063) respectively. Volume expansion ratio varied between 1.71 and 4.67 ml and wide variations were also found in length of blue gel [59.00 40004) − 116.00 mm (VL-31441)]. Rice with similar amylose content can be differentiated according to the tenderness. Cooked rice with softer gel consistency was moretender. Most of the rice genotypes exhibited soft gel consistency with intermediate GT (70-740C). Results of present study were in agreement with earlier finding (Juliano, 1979), where they found that the volume expansion ratio was positively correlated with amylose content and the gel type. The protein content was appreciably high (>6.2%) for all tested genotypes and varied between 6.29 (VL-31072) and 8.67% (VL-30425) (Table 1). The present study was in agreement with earlier findings (Villareal et al., 1990; Umadevi et al., 2010), which showed that the protein content in 9 genotypes of rice ranged between 6.0–9.0%. Solids in cooking water and water uptake content ranged between 0.03 – 0.11% and 60.00 – 490.00%, respectively. Cooking time ranged between 19 (VL-7742) and 26 min (VL-8116).
Variations in Pasting Properties :Wide variation was observed in pasting properties among the tested rice genotypes. The peak and final viscosity of all genotypes ranged between 33.58 (VL-31072) and 292.50 (VL-7852) and 49.58 (VL-31072) – 496.08RVU (VL-30425), respectively (Table 3). It might be due to the nutritional composition of the considered genotypes, affecting the cooking property of rice (Wani et al., 2012). Most of the rice genotypes exhibited less than 200 RVU setback viscosity with a considerable variation between 16.00 31072) and 232.83RVU (VL-31290) . The setback viscosity is related to the gel network formation and is correlated to the amount of the amylose present in the rice starch (Jane et al., 1999). This is consistent with present findings because most of the rice genotypes, which exhibited low amylose content, exhibited low setback viscosities. Most of the rice genotypes under study exhibited less than 250 Rapid Visco Units through viscosity with a considerable variation between 33.83 (VL-31072) – 250.50 RVU (VL-31290) . Peak time was found low for all low amylose genotypes and exceeded 7 min in
high amylose genotypes, while breakdown was found higher for all low amylose genotypes. In low amylose varieties, amylopectin is predominating which causes granules to be swollen more easily (Li et al., 2008).
Variations in Antioxidative Properties :
Total polyphenols content in rice genotypes ranged between 0.55 (VL-40067) and 2.56 mg TAE/gram DW (VL-30569) (Table 4). DPPH radical inhibition activity of water extract from rice genotypes recorded in the range of 9.23 (VL-40067) to17.34 μM TE/gram DW (VL-8094) while ABTS radical inhibition activity in water extract from rice genotypes found in the range of 23.00 (VL-40095) to 58.18% (VL-30927). FRAP value in rice genotypes aqueous extract found in the range of 6.76 (VL-40119) to 30.19 μM TE/g DW (VL-30953). The results of present study are in agreement with the report of Goffman and Bergman (2004), in which rice genotypes with different pericarp color were evaluated and antioxidant activity (FRAP value) ranged between 10.0 and 13.1 μM TE/g DW. Rice possesses different compounds with antioxidant activity including polyphenols, but variations are observed in the concentration of these compounds in the grains, mainly due to genotype, pericarp color and processing (Melissa and Enio, 2011).
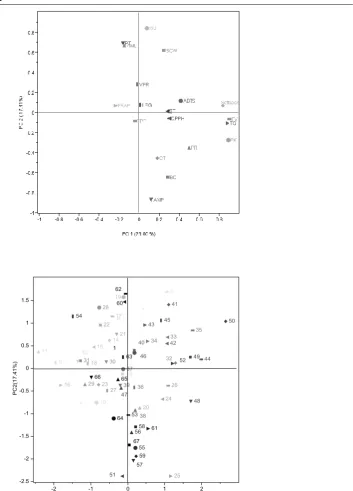
Principal Component Analysis (PCA):
ISSN 0975-928X
swelling of granules, thereby reducing the peak viscosity. Amylose content might be responsible for high water uptake ratio, as Frei et al. (2003) had reported that rice with high amylose content tends to absorb more water upon cooking. Solids in cooking water affect the stability of the cooked rice (Normita and Cruz, 2002). The variation in values may be as a result of the variation in rice consistency, seen in the bursting of the grains during and after cooking, as they are of different genotypes (Normita and Cruz, 2002). The protein content showed positive correlation with trough, breakdown, final viscosity, and setback. Starch content also showed positive correlation with cooking time. The results are in agreement of previous study by Noosuk et al., (2003). However, positive correlation between amylose content and viscosity was reported (Charoenthaikij et al., 2009). In present finding, setback, breakdown and trough viscosity were found negatively correlated with amylose content. Mishra and Rai (2006) also suggested that setback may largely be determined by degree of amylose polymerization. Similarly, breakdown of the different rice genotypes revealed that they were significantly different with the same pattern as viscosity and were negatively correlated with amylose content. Radical scavenging activities of rice genotypes were found well correlated with total polyphenols while in vitro assessment of FRAP showed negative correlation with other antioxidant properties. Previous studies reported (Goffman and Bergman, 2004) that antioxidant activity have positive correlation with the total phenol content and is especially associated with the content of tannic acid and catechins.
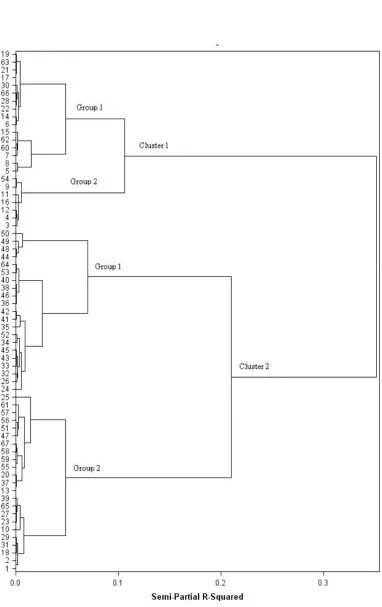
Agglomerative hierarchical clustering (AHC): In order to see patterns of clustering between the rice genotypes, AHC analysis was used. Using a similarity level, 67 rice accessions were classified into mainly two clusters (Fig. 2). From AHC, an important conclusion can be drawn that based on composition, the differences between the accessions studied are still great enough to classify them correctly, on the basis of the variables introduced in the present analysis. Cluster 1 consisted of 23 genotypes (19, 63, 21, 17, 30, 66, 28, 22, 14, 6, 15, 62, 60, 7, 8, 5, 54, 9, 11, 16, 12, 4, 3) grouped in to two groups viz., group 1 with 16 accessions and group 2 with 7 accessions. Accessions in cluster I showed higher amylose, starch, volume expansion ratio, water uptake, FRAP and lower peak viscosity, trough viscosity, breakdown, final viscosity and setback. The higher amylose, setback, volume expansion ratio, water uptake, and peak time in cluster I is mainly contributed by group 1 of cluster I. Cluster 2 comprised of a mixture of 44 accessions (50, 49, 48, 44, 64, 53, 40, 38, 46, 36, 42, 41, 35, 52, 34, 45, 43, 33, 32, 26, 24, 25, 61, 57, 56, 51, 47, 67, 58, 59, 55, 20, 37, 13, 39, 65, 27, 23, 29, 31, 58,
21) ) grouped in to two groups viz., group 1 with 21 accessions and group 2 with 23 accessions. Accessions in cluster II showed lower amylose, starch, volume expansion ratio, water uptake, FRAP, peak time and higher peak viscosity, trough, breakdown, final viscosity and setback viscosity. The lower amylose, starch, volume expansion ratio, water uptake, and peak time in cluster II is mainly contributed by group 2 of cluster II. The major characteristics shared by both cluster I and cluster II were solids in cooked water, cooking time, length of blue gel and total polyphenols.
Conclusion
In conclusion, this study has shown that sufficient variability was found for the physicochemical, cooking and antioxidative properties in rice genotypes studied. All the important traits analyzed may be used in the breeding programmes to increase variability for different physicochemical, cooking and antioxidative characteristics and to make suitable selections that are acceptable to consumers. From a breeding point of view, the high variability suggests that it could be possible to obtain appreciable responses to selection for these traits. The results of present study could help rice breeders to identify interrelationship between important physicochemical, cooking quality, pasting and antioxidative properties to find out the better rice genotypes and breed these characteristics into improved varieties.
References
Anonymous. 2004. Laboratory Manual on Rice Grain Quality Procedure (pp. 1-20). Directorate of Rice Research, Rajendranagar, Hyderabad, India.
Arnao, M.B., Cano, A., Acosta, M., 2001. The hydrophilic and lipophilic contribution to total antioxidant activity. Food Chem., 73, 239– 244.
Benzie, I., Strain, J., 1996. The ferric reducing ability of plasma (FRAP) as a measure of antioxidant power: The FRAP assay. Anal Biochem,239,
70-76.
Bhattacharya, K.R., 1979. Gelatinization temperature of rice starch and its determination. In Proceedings of the workshop on chemical aspects of rice grain quality. International Rice Research Institute (pp. 231-249). Manila, Philippines.
Bradford, M.M., 1976. A rapid and sensitive method for the quantitation of microgram quantities of protein utilizing the principle of protein-dye binding. Anal. Biochem., 72, 248-254. Brand-Williams, W., Cuvelier, M.E., Berset, C., 1995.
Use of free radical method to evaluate antioxidant activity. LWT - Food Sci Technol.,
28, 25–30.
ISSN 0975-928X
of germinated brown rice flour. J food Sci., 74:
658-665.
Frei, M. Siddhuraju, P., Becker, K., 2003. Studies on the in vitro starch digestibility and glycemic index of six different indigenous rice cultivars from the Philippines. Food Chem,83, 395-402. Goffman, F.D., Bergman, C.J., 2004. Rice kernel
phenolic content and its relationship with antiradical efficiency. J Sci Food Agr., 84,
1235-1240.
GOI (Government of India) Annual report (2011-2012), Directorate of Economics and Statistics, Department of Agriculture and Cooperation, Ministry of Agriculture.
Jane, J., Chen, Y.Y., Lee, L.F., McPherson, A.E., Wong, K.S., Radosavljevic, M., Kasemsuwan, T., 1999. Effects of amylopectin branch chain length and amylose content on the gelatinization and pasting properties of starch.
Cereal Chem.,76, 629–637.
Juan, G., Luis, A., David, B., 2006. Isolation and molecular characterization of Makal (Xanthosoma yucatanensis) starch. Starch, 58,
300-307.
Juliano, B.O., Villareal, C.P., 1993. Grain quality evaluation of world rices. International Rice Research Institute, Manila, Philippines. Juliano, B.O., 1972. Physicochemical properties of
starch and protein in relation to grain quality and nutritional value of rice. In: Rice breeding. Los Banos, Philippines: International Rice Research Institute, p 389–405.
Li, Y., Shoemaker, C.F., Ma, J.., Kim, J.M., Zhong, F., 2008. Structure–viscosity relationships for starches from different rice varieties during heating. Food Chem., 106, 1105–1112. Little, R.R., Hilder, G.B., Dawson, E.H., Elsie, H.,1958.
Differential effect of dilute alkali on 25 varieties of milled white rice. Cereal Chem.,
35, 111-126.
Lopez, A., Montano, A., Garcia, P., Garrido, A., 2006. Fatty acid profile of table olives and its multivariate characterization using unsupervised (PCA) and supervised (DA) chemometrics. J Agric Food Chem., 54, 6747– 6753.
Melissa, W., Enio, M., 2011. Phenolic Compounds and Antioxidant Activity of Rice Braz Arch Biol Technol.,54, 371-377.
Mishra, S., Rai, T., 2006. Morphology and functional properties of corn, potato and tapioca starches.
Food Hydrocoll.,20, 557-566.
Noosuk, P., Hill, S. E., Pradipasena, P., Mitchell, J.R., 2003. Structure viscosity relationships for Thai rice starches. Starch,55, 337-344.
Normita, M., Cruz, D., 2002. Rice Grain Quality Evaluation Procedures. Graham R. A Proposal for IRRI to establish a grain quality and nutrition research centre: IRRI discussion paper series No. 44 Los Banos, Philippines Oko, A.O., Ubi, B.E., Dambaba, N., 2012. Rice Cooking
Quality and Physico-Chemical Characteristics: a Comparative Analysis of Selected Local and Newly Introduced Rice Varieties in Ebonyi State, Nigeria. Food and Public Health,2, 43-49.
Parihar, A.K., Dixit, G.P., Singh, D., 2013. Multivariate analysis of various agronomic traits in
grasspea (Lathyrusspp) germplasm. Indian J Agr Sci.,83 (5), 570–75.
Rachmat, R., Thahir, R., Gummert, M., 2006. The empirical relationship between price and quality of rice at market level in West Java.
Indonesian Journal of Agricultural Science,7,
27-33.
Shen, Y., Jin, L., Xiao, P., Lu, Y., Bao, J.S., 2009. Total phenolics, flavonoids, antioxidant capacity in rice grain and their relations to grain color, size and weight. J Cereal Sci., 49, 106-111. Singleton, V.L., Rossi, J.A., 1965. Colorimetry of total
phenolics with phosphomolybdic-phosphotungstic acid reagents. Am J Enol Vitic., 16, 144-158.
Thimmaiah, S. K., 1999. In Standard method of Biochemical analysis, Kalyani Publisher New Delhi. 58-60 pp.
Umadevi, M., Veerabadhiran, P., Manonmani, S., Shanmugasundaram, P., 2010. Physico-chemical and cooking characteristics of rice genotypes. Electron J Plant Breed, 1, 114-123. Villareal, C.P., Juliano, B.O., Sauphanor, B., 1990. Grain quality of rices grown in irrigated and upland cultures. Plant Food Hum Nutr., 40,
37-47.
ISSN 0975-928X
Table 1. Details of rice (non-glutinous, translucent color) genotypes along with Alkali spreading value (ASV), Gel consistency (GC), gelatinization temperature (GT) and 1000 seed weight
Sample No. Genotype Name
ASV GC GT *1000 Seed
weight
Sample No. Genotype Name
ASV GC GT *1000 Seed
weight
1 VL-30924 1 S 74.5-80 21.05 35 VL-31290 2 S 74.5-80 22.88
2 VL-30925 4 S 70-74 21.06 36 VL-31329 2 S 74.5-80 26.83
3 VL-30926 6 S <70 23.46 37 VL-31335 2 S 74.5-80 27.71
4 VL-30927 2 S 74.5-80 27.57 38 VL-31450 2 S 74.5-80 26.63
5 VL-30928 6 S <70 17.37 39 VL-31451 2 S 74.5-80 18.98
6 VL-30929 6 H <70 23.33 40 VL-31452 1 S 74.5-80 22.24
7 VL-30934 7 S <70 17.02 41 VL-7620 2 S 74.5-80 18.00
8 VL-30938 6 H <70 19.38 42 VL-30560 2 S 74.5-80 23.69
9 VL-30960 6 S <70 24.21 43 VL-7742 1 S 74.5-80 23.96
10 VL-31000 1 S 74.5-80 24.82 44 VL-30569 2 S 74.5-80 26.88
11 VL-31072 6 M <70 22.03 45 VL-7820 1 S 74.5-80 16.91
12 VL-31076 5 S 70-74 20.99 46 VL-7702 2 S 74.5-80 27.41
13 VL-30930 2 M 74.5-80 20.69 47 VL-7954 2 S 74.5-80 26.09
14 VL-30935 7 H <70 24.81 48 VL-7852 2 S 74.5-80 26.13
15 VL-30937 7 S <70 24.48 49 VL-30424 5 S 74.5-80 29.55
16 VL-30948 5 S 70-74 20.44 50 VL-30425 6 S <70 24.26
17 VL-30953 6 S <70 20.44 51 VL-31484 2 M 74.5-80 24.57
18 VL-30956 7 H <70 25.57 52 VL-31486 1 S 74.5-80 24.38
19 VL-31003 6 S <70 27.17 53 VL-31487 2 S 74.5-80 34.22
20 VL-31077 2 S 74.5-80 21.18 54 VL-40102 7 S <70 23.89
21 Pusa bas-1 5 S 70-74 19.05 55 VL-40063 5 S 70-74 26.43
22 Pusa sugandha-2 7 S <70 25.09 56 VL-40004 2 H 74.5-80 26.24
23 Bas-370 2 S 74.5-80 18.31 57 VL-40003 3 M 24.99
24 VL-31407 2 S 74.5-80 22.16 58 VL-40002 5 M 70-74 24.03
25 VL-31441 2 S 74.5-80 23.72 59 VL-40119 5 S 70-74 22.97
26 VL-31348 1 S 74.5-80 24.07 60 VL-40056 7 S <70 21.18
27 VL-8116 2 M 74.5-80 23.12 61 VL-40058 3 M 24.13
28 VL-8158 5 S 70-74 20.33 62 VL-40061 6 S <70 19.39
29 VL-8051 1 S 74.5-80 25.11 63 VL-40062 3 M 27.38
30 VL-8094 2 S 74.5-80 26.64 64 VL-40067 1 S 74.5-80 25.7
31 VL-31334 2 S 74.5-80 23.51 65 VL-40068 2 S 74.5-80 27.28
32 VL-31339 2 S 74.5-80 28.15 66 VL-40095 5 M 70-74 25.58
33 VL-31449 4 S 70-74 23.33 67 VL-40107 6 M <70 24.69
34 VL-31284 2 M 74.5-80 27.36
ISSN 0975-928X
Table 2. Basic statistics for physicochemical properties of 67 tested rice genotypes
VER- Volume expansion ratio, LBG- Length of blue gel, CT -Cooking time, SCW- Solids in cooked water, WU - Water uptake
Table 3. Basic statistics for pasting properties of 67 tested rice genotypes
Trait Unit Mean Median Mode SD Min Max
Group attribute 3 Peak viscosity RVU 142.28 140.92 171.25 53.62 33.58 292.50
(Pasting properties) Trough viscosity RVU 134.54 134.75 N/A 47.70 33.83 250.50 Breakdown viscosity RVU 6.62 0.08 0.58 13.16 2.83 53.58 Final viscosity RVU 262.80 262.33 N/A 96.19 49.58 496.08 Setback viscosity RVU 121.85 112.50 72.92 49.74 16.00 232.83
Peak Time Min 6.64 6.93 7.00 0.44 5.78 7.03
Table 4. Basic statistics for antioxidative properties of 67 tested rice genotypes
Trait Unit Mean Median Mode SD Min Max
Group attribute 4 (Antioxidative properties)
TPP mg TAE/gram DW 1.034 0.887 1.227 0.429 0.55 2.56 ABTS % inhibition 44.623 44.818 44.364 6.248 23.00 58.18 FRAP μM TE/gram DW 17.768 17.968 10.493 5.846 6.76 30.19 DPPH μM TE/gram DW 13.308 13.159 16.459 2.213 9.23 17.34 TPP: Total polyphenols, ABTS: Scavenging effects on ABTS free radicals, DPPH: Scavenging effects on DPPH free radicals, FRAP: ferric reducing antioxidant power
Trait Unit Mean Median Mode SD Min Max
Group attribute 1 Amylose % 18.01 18.24 18.24 2.51 9.96 22.43
(Physicochemical properties) Amylopectin % 81.99 81.76 81.76 2.51 77.57 90.04
Starch % 31.91 30.80 33.15 7.21 20.65 52.11
Protein % 7.29 7.12 6.98 0.53 6.29 8.68
VER ml 2.68 2.43 2.05 0.76 1.71 4.67
LBG mm 90.84 94.00 98.00 11.32 59.00 116.00
Group attribute 2 CT Min 22.86 23.00 24.00 2.29 19.00 26.00
(Cooking quality) SCW g 0.07 0.07 0.06 0.02 0.03 0.11
ISSN 0975-928X
ISSN 0975-928X