International Journal of Computer Techniques -– Volume 5 Issue 5, Sep- Oct 2018
ISSN :2394-2231
http://www.ijctjournal.org
Page 8
Naive Bayes Optimization Based On Particle Swarm
Optimization to Predict the Decision of Insurance
Customer Candidate
Saruni Dwiasnati
1, Yudo Devianto
21
Mercubuana University, Faculty of Computer Science, Jl. Meruya Selatan 1 No. 1, Kembangan, 11650, Indonesia
2
Mercubuana University, Faculty of Computer Science, Jl. Meruya Selatan 1 No. 1, Kembangan, 11650, Indonesia
---
************************
---Abstract:
In order to deal with business competition and increase the company's revenue, both company leaders and management in a company are required to be able to make the right decisions in determining the sales strategy. To be able to do this, companies need a large amount of information to be analyzed further. The company executive expects technology that can produce information that is ready to be used to assist them in making corporate strategic decisions. They want to know what products should be improved, how much the results obtained by the company will be achieved. To meet the needs of entrepreneurs above, there are many ways that can be pursued. One of them is by utilizing corporate data. Based on the identification of the problems that have been described, the problem is formulated as follows: how the optimization results for the Naive Bayes algorithm based on Particle Swarm Optimization, how to build a prototype to predict customer data by using the appropriate data mining classification method. This study aims to recommend a prototype of the data mining classification method for potential customer predictive data in offering an existing product based on data mining classification method, namely the Naïve Bayes algorithm based on Particle Swarm Optimization. This study, if viewed from the form of data and information that is managed, this research is classified as a quantitative type of research. Quantitative research is a research whose hypothesis can be tested by statistical techniques. This method is used when conducting quality testing using the k-fold cross validation method (k = 10) which displays the value of accuracy, precision, recall, ROC for each method that is compared. The results of application development and model performance measurement will be explained in this section. Application development will be discussed in testing to show that the results of the application are made as expected. Whereas in the measurement of model performance will be explained the results of the model performance measurement for the analysis of potential customers and potential customers not to be offered insurance products at PT. XYZ by using Naive Bayes based on Particle Swarm Optimization, the results obtained in the algorithm that has been optimized are made an application developed.
Keywords —Insurance, Mining Data, Classification, Naive Bayes, Particle Swarm Optinmization.
---
************************
---
1.
INTRODUCTION
The many data linkages and information needs to make the completion of business fields and infrastructure support in the department of informatics engineering become the origin of the emergence of datamining technology. The application of data
mining techniques is expected to shorten the conclusions process, enabling companies to maintain information stored in consumer data and as a contemporary view. Through the views obtained, companies can increase their income and in the end in the future the company can compete with other companies.
International Journal of Computer Techniques -– Volume 5 Issue 5, Sep- Oct 2018
ISSN :2394-2231
http://www.ijctjournal.org
Page 9
Classification techniques in determining potentialcustomers or not potential to be offered by existing insurance products, are already using the Naive Bayes algorithm based on Particle Swarm Optimization [7] but the results obtained are not optimal so that there are still opportunities to produce better results. The Particle Swarm Optimization algorithm can maximize the results of Naive Bayes in predicting the decisions of prospective insurance customers
The data used for the optimization process is the product offering data owned by PT. XYZ. Application of the datamining process using the JAVA application. Data mining is the process of finding interesting and hidden patterns from a large collection of data stored in a database, data warehouse, or other data storage[9]. Data mining also has meaning as part of the process of mining knowledge in a database known as Knowledge Discovery in Database (KDD)[9].
Nowadays, the major industries in the industry that are engaged in the insurance business have other ways to market their products in addition to the traditional methods that we know so far, namely using telemarketing services. Telemarketing is remote marketing that uses telecommunications technology as part of a regular and structured marketing program. Currently in the telemarketing division, data mining techniques are not yet used. Data mining is a process of data extraction or data filtering by utilizing a large enough data collection through a series of processes to obtain valuable information from the data. The results of the data mining process that will be the basis of whether the customer has the potential or not in taking insurance products. The purpose of this observation is to obtain a more optimal influence for the Naive Bayes algorithm based on Particle Swarm Optimization in predicting candidate decisionsPT. XYZ's insurance customers to determine these customers are potential or not potential to be offered several products in the insurance company PT XYZ.
2.
BASIC THEORY AND METHODS
2.1.
Insurance
Insurance is an action, mechanism, or business field in which financial protection (or financial compensation) for the soul, property, health and so forth get a replacement from unpredictable events that can occur such as death, loss, damage or sick, which involves paying premiums regularly within a certain period of time instead of a policy that guarantees that protection.
2.2.
Data Mining
Data Mining is a method that uses statistical techniques, mathematics, artificial intelligence, machine learning to extract further recognition of useful information and related knowledge from various large databases [10]. Data mining can be realized due to the need to explore knowledge or information from data stored in a lot of value. From some definitions of experts, it can be concluded that data mining is a field of science that studies a series of processes systematically and logically to explore a collection of data in order to obtain a hidden knowledge. The excavation can be in the form of finding patterns in the data.
2.3.
CRISP-DM
CRISP-DM is short for the word from Cross Industry Standard Process for Data Mining. CRISP-DM describes the standardization of data mining compiled by three initiators of the data mining market. Namely Daimler Chrysler (Daimler-Benz), SPSS (ISL), NCR[2] In this methodology, the cycle for data mining processes is divided into 6 stages[8]:
1. Business Understanding
At this stage it focuses on understanding the objectives of the project and the needs of the business perspective, then changing it into a data mining problem and the initial plan to achieve that goal. Activities carried out include: determining objectives and requirements clearly as a whole, translating these objectives and determining restrictions in formulating data mining problems, and then preparing an initial strategy to achieve these goals.
2. Understanding Data
At this stage the data is collected, then study the data with the aim of getting to know the data, identifying and knowing the quality of the data, and detecting interesting subset of data that can be used as hypotheses for hidden information.
3. Data preparation
At this stage preparations are made regarding the data to be used in the next stage. The activities carried out include: selecting the cases and parameters to be analyzed (Select Data), transforming certain parameters (Transformation), and cleaning the data so that the data is ready for the stage of Cleaning.
4. Modelling
International Journal of Computer Techniques -– Volume 5 Issue 5, Sep- Oct 2018
ISSN :2394-2231
http://www.ijctjournal.org
Page 10
with the help of tools. If data adjustments are neededfor certain data mining techniques, you can return to the data preparation stage.
5. Evaluation
Interpret the results of data mining generated in the modeling process. Interpret the results of the data mining generated in the modeling process in the previous stage. Evaluation is carried out on the model applied in the previous stage with the aim that the model determined can be in accordance with the objectives to be achieved in the first stage. in the previous stage. Evaluation is carried out on the model applied in the previous stage with the aim that the model determined can be in accordance with the objectives to be achieved in the first stage.
6. Deployment
Conducting a report on the results obtained from the evaluation in the previous stage or from the data mining process carried out as a whole.
2.4.
Naive Bayes Algorithm
Bayes theorem discovered by Thomas Bayes in the 18th century is a very rapid and conventional Bayesian Learning pattern. This problem stems from the Bayes theorem and the freedom hypothesis, giving rise to statistical classifiers based on possibilities. This is a conventional technique and must be used before trying a more complex pattern. The Naive Bayes classification is interpreted so that there are or not certain characters from an interaction category with the characteristics of other categories[14].
The Naive Bayes algorithm formula is as follows:
Information :
X: Category of sample data (sought) H: The theory specifically sought
P (H | X): Probability theory based on sample data P (H): Probability of theory H (prior probability)
P (X | H): Probability of X based on the condition of the sample data
P (X): Probability
2.5.
Particle Swarm Optimization Algorithm
Particle Swarm Optimization (PSO)[13] is an outline optimization method introduced by Kennedy and Eberhart in 1995. Particle swarm optimization (PSO) is a type of intelligence algorithm derived from the behavior of foraging birds[11]. Based on research on the behavior of flocks of birds and fish, each particle in Particle Swarm Optimization has a moving particle speed in the tracking space and a dynamic rate adjusted to their historical character. Therefore, the component has a trend to move towards a better income area during the inspection process[7]. Optimization can be interpreted as a framework to maximize an existing problem, or design and build optimally. Although PSO is used in a variety of applications, PSO still has limitations in the training phase. Compared to Genetic Algorithm, PSO requires faster time in obtaining solutions, has a high ability in finding the best solution.
2.6.
XAMPP
XAMPP[12] is the most popular web server application because of its ease of use in building web-based applications. XAMPP is an application that functions as a server and stands alone (localhost) and in it there are several programs including Apache, http server, MySQL, databases and translators written in the PHP and PERL programming languages.
2.7.
Evaluation and Validation of the Data
Mining Classification Method
Evaluation and validation of classification results with data mining in this study used Confusion Matrix method and Receiver Operating Characteristic (ROC) curve.
1. Confusion Matrix
This method only uses matrix tables 2. ROC curve
International Journal of Computer
ISSN :2394-2231
2.8. Hypothesis
1. Allegedly the results obtained will reach a value of more than 83.89% by using the Naive Bayes algorithm based on Particle Swarm Optimization in predicting the decisions of potential or non-potential
customers.
2. It is suspected that the computerized system for predicting the prospective decision of potential or non potential insurance customers can be built using the Naive Bayes algorithm classification method based on Particle Swarm Optimization.
3.
SYSTEM
METHODOLOGY
AND
DESIGN
3.1.
Research Methods
According to[5] there are four research methods commonly used namely research, experiment, case studies and surveys. In the context of this study using experiments, namely a method carried out by referring to problem solving which includes collecting data, formulatinghyp
hypotheses, interpreting results, and conclusions[6].
3.2.
Data Collection Method
The author makes direct observations at PT. XYZ telemarketing division to collect data related to the prediction of sales of insurance products by observing and s
recording the problems investigated and researching directly on the object to be studied.
3.3.
Analysis techniques
Descriptive analysis technique is carried out to analyze the data to be carried out on the results of data collection with literature studies, interviews and observations to obtain the system requirements specification to be developed. The analysis technique that will be carried out using data mining algorithms include Naive Bayes and Particle Swarm Optimization.
3.4.
Design
of
Classification
Process
on
Prototype
The process that will be designed in the system prototype includes:
1. Import excel data
mport data is done to enter data that will be predicted into the prototype that will be designed. Data format in the form of .csv and / or .xls.
International Journal of Computer Techniques -– Volume 5 Issue 5, Sep- Oct
2231
http://www.ijctjournal.org
Allegedly the results obtained will reach a value of more than 83.89% by using the Naive Bayes algorithm based on Particle Swarm Optimization in predicting the potential prospective
It is suspected that the computerized system for predicting the prospective decision of potential or non-potential insurance customers can be built using the Naive Bayes algorithm classification method based on
SYSTEM
METHODOLOGY
AND
there are four research methods commonly used namely research, experiment, case studies and surveys. In the context of this study using experiments, namely a method carried out by referring to problem solving hypotheses, testing
The author makes direct observations at PT. XYZ telemarketing division to collect data related to the prediction of sales of insurance products by observing and systematically recording the problems investigated and researching directly
Descriptive analysis technique is carried out to analyze the data to be carried out on the results of data collection with literature studies, interviews and observations to obtain the system requirements specification to be developed. The analysis technique that will be carried out using data mining algorithms include Naive Bayes and Particle Swarm
ssification
Process
on
The process that will be designed in the system
mport data is done to enter data that will be predicted into the prototype that will be designed. Data format in
2. Preprocessing
Imported data will be checked by all prototypes to determine the feasibility of processing. The checking process can take the form of checking missing values, different data formats, and others.
3. Prediction process
After the data is clean, it will predict the test data using the method with the best optimization value that has gone through the stages of the analysis process in the study. The results of the prediction in the form of relevance between the field of work to be taken and the scientific field that has been taken by students, in the prototype stated in Potential and Non
Notation.
4.
RESULT AND DISCUSSION
4.1.
Naive
Bayes
Configuration
Matrix
algorithm
Figure 1 is a calculation of the accuracy of training data using the Naive Bayes algorithm which produces 83.10% accuracy. The training data is known to consist of 290 data records, 190 data classified as Potential and 100 data predicted Not Potential as customers offered insurance products.
Figure 1 Naive Bayes Configuration M
Figure 2 Naive Bayes Confusion Matrix algorithm view text
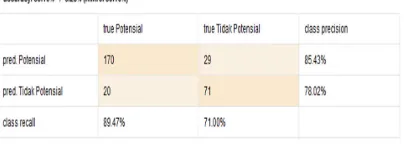
4.2. Confusion Matrix algorithm Particle Swarm Optimization
Figure 3 is a calculation of training data optimization using the Naive Bayes algorithm that has been optimized using PSO which results in an accuracy of 84.48%. The
Oct 2018
Page 11
Imported data will be checked by all prototypes to determine the feasibility of processing. The checking process can take the form of checking missing values, different data formats, and others.ean, it will predict the test data using the method with the best optimization value that has gone through the stages of the analysis process in the study. The results of the prediction in the form of relevance between the field of work to be taken and the scientific field that has been taken by students, in the prototype stated in Potential and Non-Potential
RESULT AND DISCUSSION
Naive
Bayes
Configuration
Matrix
Figure 1 is a calculation of the accuracy of training data Bayes algorithm which produces 83.10% accuracy. The training data is known to consist of 290 data records, 190 data classified as Potential and 100 data predicted Not Potential as customers offered insurance products.
Figure 1 Naive Bayes Configuration Matrix Algorithm
Figure 2 Naive Bayes Confusion Matrix algorithm view text
Confusion Matrix algorithm Particle Swarm
International Journal of Computer
ISSN :2394-2231
training data is known to consist of 290 data records, 190 data classified as Potential and 100 data predicted Not Potential as customers offered insurance products.
Figure3Particle Swarm Optimization Configuration Matrix Algorithm
Figure 4Particle Swarm Optimization Confusion Matrix algorithm view text
From the results of the confusion matrix
calculation of accuracy, precision and recall is then performed. Comparison of the accuracy, precision, and recall values that have been calculated for the Naive Bayes algorithm and Particle Swarm Optimization algorithm can be seen in Table 1.
Table 1 Comparison of Accuracy, Precision, and Recall Value
Naive Bayes
Naive
Bayes
PSO
Training
Training
Accuracy 83.10%
84.48%
Precision
78.02%
81.61%
Recall
75.32%
91.58%
4.3.
ROC Curve Naive Bayes
The results obtained from ROC processing using training data for the Naive Bayes algorithm of 0.895 can be seen in Figure 5 with the diagnosis level of good
classification.
International Journal of Computer Techniques -– Volume 5 Issue 5, Sep- Oct
2231
http://www.ijctjournal.org
training data is known to consist of 290 data records, 190 data ta predicted Not Potential as
Figure3Particle Swarm Optimization Configuration Matrix Algorithm
Confusion Matrix algorithm view text
From the results of the confusion matrix above, the calculation of accuracy, precision and recall is then performed. Comparison of the accuracy, precision, and recall values that have been calculated for the Naive Bayes algorithm and Particle Swarm Optimization algorithm can be seen in Table
Table 1 Comparison of Accuracy, Precision, and Recall Value
Naive
Bayes
Training
84.48%
81.61%
91.58%
The results obtained from ROC processing using training data for the Naive Bayes algorithm of 0.895 can be seen in Figure 5 with the diagnosis level of good
Figure 5 ROC Naive Bayes Curve
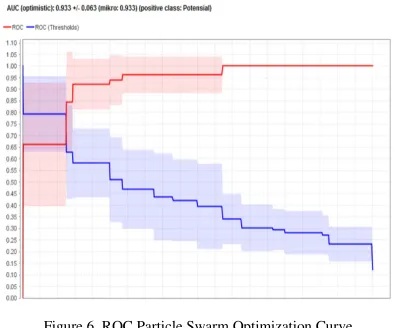
4.4.
ROC Curve Particle Swarm Optimization
The results obtained from ROC processing using training data for the NOve Bayes algorithm based on PSO of 0.933 can be seen in Figure 6 with the excelent classification classification level.
Figure 6 ROC Particle Swarm Optimization
Comparison of the results of the calculation of AUC values for the Naive Bayes and Naive Bayes PSO algorithms can be seen in Table 2.
Table2 Comparison of the AUC
Naive Bayes
AUC
0.895
Oct 2018
Page 12
Figure 5 ROC Naive Bayes CurveROC Curve Particle Swarm Optimization
The results obtained from ROC processing using data for the NOve Bayes algorithm based on PSO of 0.933 can be seen in Figure 6 with the excelent classification
Particle Swarm Optimization Curve
Comparison of the results of the calculation of AUC e Bayes and Naive Bayes PSO algorithms
Comparison of the AUC
Naive Bayes PSO
International Journal of Computer Techniques -– Volume 5 Issue 5, Sep- Oct 2018
ISSN :2394-2231
http://www.ijctjournal.org
Page 13
4.5.
Prediction Results
The results of the application of the Naive Bayes PSO rule algorithm to new data are 20 data records where 12 data are predicted to be potential according to the 8 potential data predictions
Figure 6 Dashboard Form
4.6.
Potential Prediction Results
From the results of selected algorithm verification using a web-based application of 20 records obtained by the predicted customers Potential to be offered insurance products as many as 7 people with a percentage of 29.2%.
Figure 7 Form Potential Details
4.7.
Non Potential Prediction Results
From the results of selected algorithm verification using a web-based application of 20 records obtained by customers who are predicted to be Not Potential to be offered insurance products as many as 17 people, with a percentage of 70.8%.
Figure 8 Non Potential Details Form
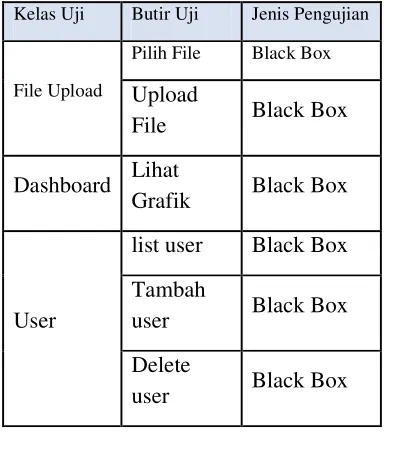
4.8.
Prototype
Functional
Testing
with
Blackbox
The test is carried out with the aim to find out whether the application is built in accordance with the functional expected.
Table 2 Testing the Black Box
Kelas Uji Butir Uji Jenis Pengujian
File Upload
Pilih File Black Box
Upload
File
Black Box
Dashboard
Lihat
Grafik
Black Box
User
list user
Black Box
Tambah
user
Black Box
Delete
International Journal of Computer Techniques -– Volume 5 Issue 5, Sep- Oct 2018
ISSN :2394-2231
http://www.ijctjournal.org
Page 14
Conclusions
From performance measurement by comparing the two algorithms that have been done, it can be concluded that:
1. The Particle Swarm Optimization algorithm has a high
accuracy rate of 84.48% while Naive Bayes is 83.10%, the difference between them is only 1%. Particle Swarm Optimization algorithm model has AUC of 0.933 and Naive Bayes of 0.895, of the AUC value, Particle Swarm Optimization algorithm is included in the category of excellent classification and Naive Bayes good classification, the Particle Swarm Optimization algorithm can be implemented in determining potential insurance customers.
2. The rule generated by the Particle Swarm Optimization
algorithm is applied in the prototype prediction of prospective insurance customers with the results of optimization of prototype verification testing of 73.12%. Based on the accuracy produced by the prototype shows that the methods and prototypes applied are good in predicting prospective insurance customers.
REFERENCE
[1] Kotler 2009, 245 Batubara, Muhamad Hendri. Strategi Marketing Public Relation (MPR) Berupa Promosi Dan Sponsorsip Untuk Mempengaruhi Konsumen Dalam Keputusan Pembelian (Studi Produk Perawatan Bayi Johnsons Baby). Tes., Universitas Indonesia, 2010. [2] Larose, T.D., 2005. Discovering Knowledge in Data an
Introduction to Data Mining, New Jersey: John Wiley & Sons, Inc.
[3] Han, J., & Kamber, M. (2006). Data Mining Concept and Tehniques. San Fransisco: Morgan Kauffman. ISBN 13: 978-1-55860-901-3
[4] Vercellis, C., 2009. Business Intelligence: Data Mining and Optimization for Decision Making, John Wiley & Sons, Inc.
[5] Dawson 2009 Dawson, C. W. Projects In Computing And Information System A Student's Guide. England: Addison-Wesley, 2009.
[6] Berndtssom 2008 Berndtssom, M., Hansson, J., Olsson, B., & Lundell, B. A Guide For Students In Computer Science And Information Systems. London: Springer, 2008.
[7] Rinawati,"Penentuan Penilaiian Kredit menggunakan Metode Naive Bayes berbasis Particle Swarm Optimization", Jurnal Sains Komputer & Informatika,
Vol 1, No 1 Maret 2017,p-ISSN: 2548-9771, e-ISSN:2549-7200
[8] Irwan Budiman, Toni Prahasto, Yuli Christyono," Data Clustering menggunakan metodologi Crisp-DM untuk pengenalan pola proporsi pelaksanaan tridharma",
(2012),ISSN: 1907-5022.
[9] Novrizal Eka Saputra, Ken Ditha Tania, Rahmat Izwan Heroza,"Penerapan Knowledge Management System (KMS) menggunakan Tekhnik Knowledge Data Discovery (KDD) pada PT PLN (Persero) WS2JB Rayon Kayu Agung", Jurnal Sistem Informasi(JSI), Vol 8 no 2, Oktober 2016,p-ISSN : 2085-1588, e-ISSN : 2355-4614 .
[10] Turban Turban dkk. 2005,”Data Mining”.
[11] L. Yun, Q.-y. Cao and H. Zhang, "Application of the PSO-SVM model for Credit Scoring," Seventh International Conference on Computation Intelligence and Security, pp. 47-51, 2011.
[12] Devianto Yudo, Saruni Dwiasnati " Application Of E-Business On The Application Of Corporate Social Responsibility (CSR) Data Processing " Vol. 5 - Issue 4 (37 - 44) - July - August 2018, International Journal of Computer Techniques (IJCT) , ISSN: 2394 - 2231 , www.ijctjournal.org
[13] Adriansyah Andi, Shamsudin H. M. Amin, Anwar Minarso, Eko Ihsanto,”Improvement Of Quadrotor Performance With Flight Control System Using Particle Swarm Proportional-Integral-Derivative (PS-PID)”,Volume 79:6(2017)121– 128,www.jurnalteknologi.utm.my, eISSN 2180–3722. [14] Nugroho Andi, Rizki Ali Fahmi,”On-Time Flight