Available Online at www.ijpret.com 133
INTERNATIONAL JOURNAL OF PURE AND
APPLIED RESEARCH IN ENGINEERING AND
TECHNOLOGY
A PATH FOR HORIZING YOUR INNOVATIVE WORK
DETECTION OF NITROGEN IN PLANTS USING DIGITAL IMAGE PROCESSING
PRIYA SINHA, SNEHA DESAI, PRATIBHA JALAPUR, SNEHA NAIK, ASHWINI SHAHAPURKAR
Electronic and Telecommunication Department, Shree Rayeshwar Institute of Engineering and Information Technology, Shiroda- Goa.
Accepted Date: 05/03/2015; Published Date: 01/05/2015
\
Abstract: Nitrogen is a critical nutrient for the growth of healthy vegetation. Proper management of nitrogen application helps to optimize crop uptake and reduces nitrogen losses to the wider environment. The nitrogen utilized by crops depends largely on the availability of the inorganic form of nitrogen, which may constitute approximately 0.1% of total nitrogen in the soil. Part of the absorbed nitrogen is stored in plant leaves in the form of vegetation vigor. Hence, determination of plant nitrogen is crucial to optimize crop yield. Leaf color is usually used as a guide for assessments of nutrient status and plant health. We propose a technique for the detection of chlorophyll content and foliar nitrogen content in plants based on leaf color using Digital Image Processing. This method provides a rapid analysis and data storage at minimal cost.
Keywords: AC-DC Converter, DC-DC Boost Converter, Single Power Conversion
Corresponding Author: MS. PRIYA SINHA
Access Online On:
www.ijpret.com
How to Cite This Article:
Priya Sinha, IJPRET, 2015; Volume 3 (9): 133-139
Available Online at www.ijpret.com 134
INTRODUCTION
Nitrogen is the most important and essential element for crop growth and development, its accurate assessment in plants is a key to nutrient management. Plants normally contain between 1%-5% nitrogen by weight. The idea of applying ‘as much is exactly needed’ is termed as site specific nitrogen application (SSNA) [1].
After carbon, hydrogen and oxygen, nitrogen (N) is one of the essential elements in plants due to its key role in chlorophyll production, which is fundamental for the photosynthesis process. In addition, nitrogen is part of various enzymatic proteins that catalyze and regulate plant-growth processes. Furthermore, nitrogen contributes to the production of chemical components that protect against parasites and plant diseases. Finally, crop yield and biomass are highly affected by N fertilization [6].
1.2 Methods of nitrogen intake by plants
Plants absorb nitrogen as a mineral nutrient mainly from soil, and it may come in the form of ammonium (NH4+) and nitrate (NO3−). However, soil N supply is often limited, which forces farmers to increase the amount of N fertilizers in order to achieve better crop yield. However, farmers may provoke nitrogen over fertilization, which thwarts optimum plant productivity, as plants are not able to absorb the excess of N-fertilizer. This entails unnecessary expenditure on the part of farmers [6].
1.3Hazards of lack and excess of nitrogen content
Available Online at www.ijpret.com 135
environmentally friendly manner. It also aims to reduce errors and costs, to achieve ecologically and economically sustainable agriculture.
2. LITERATURE SURVEY
The effectiveness of detecting and estimating nitrogen contents in plants using digital image processing is discussed in [1]. According to the research performed a manually operated four wheel test trolley was designed and developed for acquiring outdoor color images of plant under controlled illumination to predict crop nitrogen content in field. The developed unit was evaluated rigorously for paddy crop for four observations at fifteen days interval after transplantation. The results were compared with the chlorophyll content of the crop measured by SPAD meter and the chemical analysis of plant leaf. The processing of the color plant image was done in MATLAB 7.0 program. Various features such as R, G, B, normalized ‘r’ and normalized ‘g’ were analyzed for both the processes. Regression models were developed and evaluated between various image feature and the plant nitrogen content and observed that, the minimum accuracy was found to be 65% with an average accuracy of 75% (Standard Deviation ±1.9), actual and predicted values of nitrogen percent were linearly correlated with R2 value (0.948), this showed that the plant nitrogen content can be successfully estimated by its color image feature.
A new leaf color based algorithm to estimate foliar chlorophyll contents was designed in [2]. The algorithm was compared with the SPAD-502 chlorophyll meter and other image processing based methods in terms of their relationships with the true chlorophyll status that was measured using organic extraction followed by spectrophotometric measurement.
Available Online at www.ijpret.com 136
maximum green pigment during early stages and the matured wheat crop have minimum green pigment. Therefore, age of the wheat crop is analyzedby measuring the content of green color present in the wheat crop. Here the Red, Green and Blue color from the wheat crop image is extracted and the age of wheat crop is predicted. Firstly, the percentage of green color in the image of wheat crop is calculated. After calculating the percentage of green color present in the image in RGB color system, the RGB color system is converted into HSI that is, Hue, and Saturation and Intensity for better prediction. RGB data is first converted into HSI data. With image representation in the HSI domain, the color analysis was based on primarily the Hue value. Hue is a color attribute that describes a pure color, whereas saturation gives a measure of the degree to which a pure color is diluted by white light and finally intensity gives the effectiveness of the color. Using Color processing of Digital image processing the age of wheat crop is found and necessary action can be taken according to age of crop.
The current methods and techniques used to determine plant N status is reviewed in [6]. Kjeldahl digestion and Dumas combustion have been used as reference methods for N determination in plants, but they are destructive and time consuming. By using spectro-radiometers, reflecto-meters, imagery from satellite sensors and digital cameras, optical properties have been measured to estimate N in plants, such as crop canopy reflectance, leaf transmittance, chlorophyll and polyphenol fluorescence. High correlation has been found between optical parameters and plant N status, and those techniques are not destructive. However, some drawbacks include chlorophyll saturation, atmospheric and soil interference, and the high cost of instruments. Electrical properties of plant tissue have been used to estimate quality in fruits, and water content in plants, as well as nutrient deficiency, which suggests that they have potential for use in plant N determination.
Images Histogram Green
193.8956
Available Online at www.ijpret.com 137
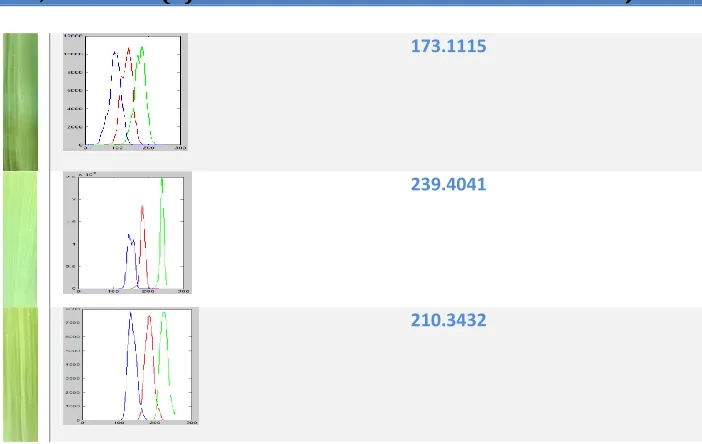
Table no.1:-Images obtained along with the histograms.
The images of paddy crop of variety “Surti” is being acquired at the booting stage of the plant growth which is a part of reproductive phase and their histogram is being obtained as shown in table no.1.
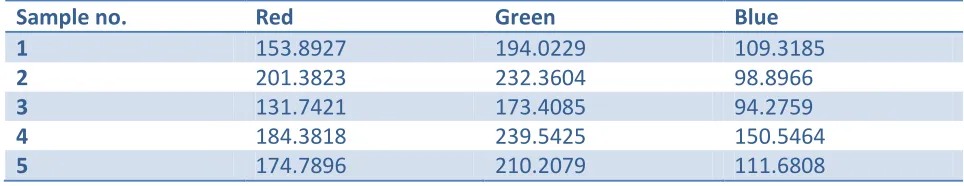
Using MATLAB software we try to obtain the green, red and blue value and determine the amount of nitrogen present by using a formulae and calculating for each image sample as shown by table no.2 and 3 below.
Table no.2:-RGB values
Sample No.
G*((R-B)/(R+B))
R*((G-B)/G+B))
(R+G)/B (R+2G)/B (R-B)/G R/(R+G+B) (R-B)/(R+G+B)
1 32.8573 42.9727 3.1826 4.9574 0.2297 0.3356 0.0975
2 79.3050 81.1317 4.3858 6.7353 0.4411 0.3781 0.1924
3 28.7453 38.9455 3.2368 5.0762 0.2161 0.3298 0.0938
4 24.1992 42.0654 2.8159 4.4071 0.1412 0.3210 0.0589
5 46.3084 53.5015 3.4473 5.3245 0.3002 0.3519 0.1271
173.1115
239.4041
Available Online at www.ijpret.com 138
Table no. 3 Nitrogen content determination using various formulae
Thus from this table we conclude that by using various formulae, nitrogen content is highest in sample 2 as compared to other samples .
CONCLUSION:
As Nitrogen is crucial nutrient for the growth of healthy vegetation, proper management of nitrogen helps to optimize crop uptake and reduces nitrogen losses to wider environment. Hence determination of plant nitrogen at a critical stage is crucial to optimize crop. Thus detection of nitrogen and chlorophyll in plants using Digital Image Processing technique will reduce the burden on farmers to determine the content of plant nitrogen and to supply supplement nitrogen depending on requirement. Thus we conclude that our approach gives better and much faster result as compared to chemical analysis and is cost effective.
REFERENCES
1. V. K. Tewari, Ashok Kumar Arudra, Satya Prakash Kumar, Vishal Pandey, Narendra Chandel, “Estimation of plant nitrogen content using digital image processing” Agriculture Engineering International: CIGR Journal Vol. 15, No.2, July2013.
2. R.K. Gautam and S. Panigrahi “Leaf nitrogen determination of corn plant using aerial images and artificial neural network” Agricultural and Bio systems Engineering Department, Vol.49, 2007.
3. R. Venkata Ramana Chary, Dr. D. Rajya Lakshmi and Dr. K.V.N Sunitha Padmasri “Feature extraction methods for color image similarity” An International Journal (ACIJ), Vol.3, No.2, March 2012.
4. Anil Kakran and Rita Mahajan “Monitoring Growth of Wheat Crop using Digital Image Processing” International Journal of Computer Applications, Volume 50 – No.10, July 2012.
Sample no. Red Green Blue
1 153.8927 194.0229 109.3185
2 201.3823 232.3604 98.8966
3 131.7421 173.4085 94.2759
4 184.3818 239.5425 150.5464
Available Online at www.ijpret.com 139
5. Mahdi M Ali, Ahmed Al-Ani, Derek Eamus, Daniel K. Y. Tan “New Image Processing Based Technique to Determine Chlorophyll in Plants” American-Eurasian J. Agriculture & Environmental Science, December 2012.