Annales
Geophysicae
Predicted and observed characteristics of small-scale field-aligned
irregularities generated in the F-region by low power HF heating
E. Kolesnikova, T. R. Robinson, and J. A. Davies
Department of Physics and Astronomy, University of Leicester, Leicester LE1 7RH, UK Received: 20 July 2001 – Revised: 21 December 2001 – Accepted: 8 January 2002
Abstract. Simultaneous HF scattering from the different re-gions of the heated volume is used to investigate character-istics of the small-scale field-aligned irregularities in the F-region. Time of growth, decay rate and saturation level for different pump powers are deduced from the observations and are compared with their behaviour predicted by the ther-mal parametric instability model. As a result, the estimates of the density and of the temperature modifications inside of the irregularities are obtained.
Key words. Ionosphere (ionospheric irregularities)
1 Introduction
Experimental studies of the ionosphere, made during the last decades, by means of both ground-based radio sound-ing techniques and rocket or satellite measurements have re-vealed that the ionosphere displays strongly irregular struc-ture with the spatial scales in the range from several cm to hundreds of km. Since 1980, the heating facility near Tromsø has performed systematic heating of the ionosphere with the purpose of investigating the properties of the density irreg-ularities which are excited artificially (see Stubbe, 1996 and references therein). HF waves, which are reflected or scat-tered from the artificially generated irregularities, provide a powerful diagnostic about scales, density and temporal de-velopment of the perturbations and reveal important informa-tion about the mechanisms which trigger their growth. Two spatial scales of the density perturbations can be explored us-ing existus-ing radio facilities: (i) large-scale perturbations with a field-perpendicular scale of the order of the heated patch size, and (ii) small-scale field-aligned perturbations with the characteristic transverse dimension of several meters. Large-scale perturbations are usually quasi-isotropic and their am-plitude and sign strongly depend on the ionospheric altitude (Gurevich, 1978). In the lower ionosphere (below 200 km), such density perturbations are significant and are mainly
de-Correspondence to: E. S´eran ([email protected])
termined by the dissociative recombination which leads to the electron density increase due to the heating. In the upper ionosphere (above 300 km), the main mechanism, that de-termines the density perturbations is particle transport across the temperature or density gradients. In such situations, heat-ing is associated with the electron density depletions in the regions of enhanced temperature. At the intermediate heights (between 200 and 300 km) the expected amplitudes of the large-scale irregularities are small and might be related to either of the described mechanisms. The dominant process which controls the geometry of small-scale perturbations is electron diffusion along the field line. The ratio between the transverse and field-aligned lengths is of the order of the ratio between the electron collision frequency and gyrofrequency, which is many orders of magnitude less than unity. There-fore, small-scale perturbations are strongly anisotropic and elongated along the magnetic field line. The fact that the small-scale density perturbations grow only during O-mode HF heating supports the idea that the mechanism which is responsible for their growth is the thermal parametric insta-bility (TPI) (Inhester, 1982; Dysthe et al., 1983; Robinson, 1989; Gurevich et al., 1995; Frolov et al., 1997), which is developed at the upper-hybrid frequency range.
SUPERDARN PARAMETER PLOT
Hankasalmi: pwr_l
7 Oct 1997 (280) unknown scan mode (-6312)
0 4 8 12 16 20 24 28 32 36 P o w er (dB)
1322 1324 1326
UT 0 15 30 45 60 75 Range gate
1322 1324 1326
UT 0 15 30 45 60 75 Range gate
Beam 5 1322 (280) to 1326 (280)
Fig. 1
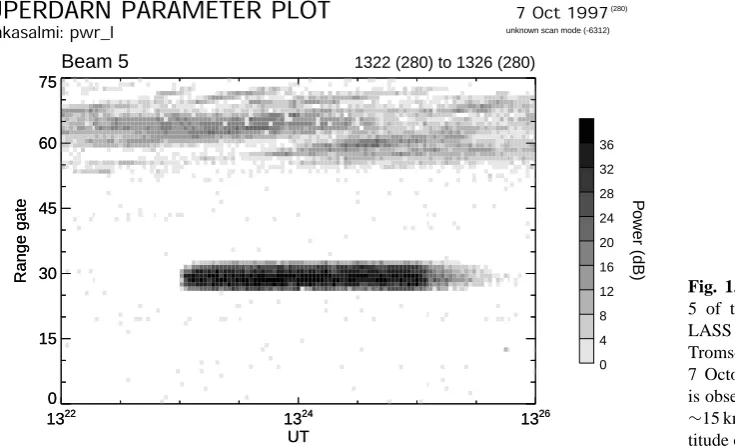
Fig. 1. Power measured in the beam
5 of the HF coherent radar at CUT-LASS during 2 min HF heating from Tromsø which began at∼13:23 UT on 7 October 1997. The power increase is observed in seven gates separated by ∼15 km in the horizontal plane at the al-titude of∼230 km.
the characteristics of the field-aligned irregularities (FAI); deduce the observed time of growth, decay rate and satura-tion level for the different pump powers and compare them with the predicted behaviour obtained from the TPI model.
2 Model of FAI growth and saturation
Let us assume that modification of plasma density in FAI is caused by the beating between an electromagnetic wave emitted by the heater in O-mode and the electrostatic upper-hybrid wave generated by a current perturbation in the heated volume, in which there is a primary small-scale density irreg-ularity1nowith transversal scale 2π k⊥−1. In this situation,
the density variations may be written in the form (see, for example, Robinson, 1989)
∂1n
∂t =D21n
(E/Et h)4e−σ 1n
2
−1, (1)
whereEis the amplitude of the pump electric field at the al-titude where the pump frequency matches the upper-hybrid frequency;Et his the threshold field,σ is a function of the pump frequency and the plasma density gradient, D2 = D⊥k⊥2, in which the transverse thermal diffusion coefficient
is defined as D⊥ = Teνe/(meω2ce), where Te, νe, me, ωce are the electron temperature, effective collision frequency, mass and gyrofrequency, respectively. Thee−σ 1n2 factor in Eq. (1) arises from the assumption that saturation is caused by the self-anomalous absorption of the pump wave. After integration over time, Eq. (1) reads
t−to= 1 2D2
Z 1n2
1n2
o
dx
x (E/Et h)4e−σ x−1
. (2)
If the pump source is switched off at the momentto, the density perturbation will follow the law
1n=1noe−D2(t−to), (3) and, therefore, will be damped with a rate which is higher if the transverse size is smaller and the electron temperature is larger.
When the pump source is switched on, an approximate an-alytical solution may be found in two limits. First, consider the situation when the density perturbation is small, i.e.
σ 1n21, (4)
for which the solution of Eq. (2) might be written analytically after development of the exponent, e−σ x ≈ 1−σ x. The density perturbation, in this case, becomes
1n2≈ ae
b(t−to)
c+eb(t−to), (5)
in which a = σ−1(1 − (E/Et h)−4), b = 2D2 (E/Et h)4−1,c=a1n−o2−1. It follows from the solution (5) that the density increases exponentially at the beginning, but after some time thermal diffusion damps its growth.
Second, consider the case when the quantityσ 1n2is not small, but ratherσ 1n2∼1, and the pump electric field does not greatly exceed the threshold level at the altitude where the pump frequency matches the upper-hybrid frequency. In this case, the term (E/Et h)4e−σ x−1mainly determines the behaviour of the right side of Eq. (2) and an approximate solution might be deduced by taking the term 1/x out of the integral. Then,
1n2≈σ−11n
(E/Et h)4
n
1− [1−(E/Et h)−4eσ 1n
2
∗]e−2D2σ 1n2∗(t−t∗) o
[image:2.595.62.430.66.289.2]Here, the symbol “∗” is used to mark the quantities that cor-respond to the moment whenσ 1n2 ∼ 1. After a certain time, which is a function of pump power, the initial perturba-tion amplitude, the density gradient and thermal diffusion co-efficient, the growth of the density perturbation becomes sat-urated. The dependence of the saturation level on the pump electric field is found to be
|1n| ≈2 q
σ−11n(E/E
t h). (7)
In the next sections, we will check the estimates deduced from this model of three-wave interaction against the obser-vations.
3 What we may learn from the HF coherent radar ob-servations
3.1 Simultaneous scatter from the regions that are heated by electromagnetic waves with different power Hereafter we assume that the horizontal distribution of the power (W) emitted by the heater into the heated cone (with a half-angle of∼7◦), which is centered along the direction of the local magnetic field (inclined at∼12◦with respect to the vertical), may be reasonably described by the Gaussian law, i.e.
W (r)∼W (0)e−r2/a2, (8) where r is the horizontal distance from the center of the heater beam anda is the radius of the heated spot (∼30 km at the height 230 km).
The CUTLASS HF coherent scatter radar located in Finland (62.3◦N, 26.6◦E geographic), ∼825 km from the Tromsø heater (69.2◦N, 19.2◦E geographic), transmits HF waves with a frequency in the range from 8 to 20 MHz. The transmitted wave is scattered from the FAI which are gener-ated artificially by heating in the F-region. The received sig-nal is gated into 75 range gates along each beam according to the time delay. Each range gate covers approximately 15 km in the horizontal plane at the altitude of the wave scattering. The amount of energy scattered from different parts of the heated patch is proportional to the squared density perturba-tion (Minkoff, 1974) and, therefore, is a funcperturba-tion of pump power and according to distribution (8), depends on the dis-tance from the center of the heated region.
[image:3.595.308.544.61.278.2]Let us consider a typical example of the CUTLASS Fin-land antenna observations during the O-mode 2 min heat-ing that commenced at ∼13:23 UT on 7 October 1997 in which the heater was pointed along the magnetic field line and emitted an effective radiated power of 9 MW at the fre-quency ∼4.5 MHz. According to the EISCAT incoherent scatter radar measurements, the altitude where the HF pump frequency matches the upper-hybrid frequency is estimated to be ∼230 km. At this height, the electron density gra-dient was∂n/∂h ≈ 2·106m−4 and the electron temper-ature ∼2000 K. The CUTLASS radar was operated at the
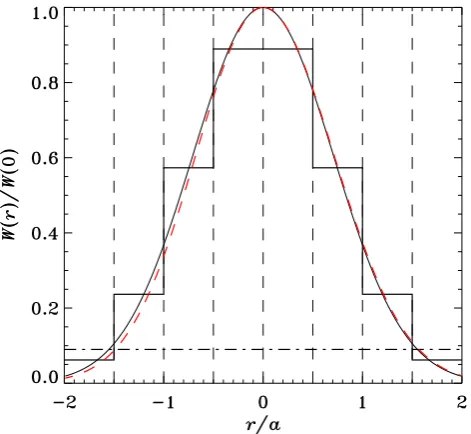
Fig. 2. Distribution of the normalized pump power inside of the
heated cone versus the normalized distance from the center for two cases: (i) projection of the heated cone on the horizontal plane at the altitude 230 km is considered as a perfect circle with the radius a=30 km (solid line), (ii) the radius of the heated spot varies from 28.8 to 30.3 km (dashed line). W (0)is the power in center. Verti-cal lines mark the limits of the gates, horizontal lines represent the average power inside of each gate and dashed-dotted line shows the estimated level of threshold field.
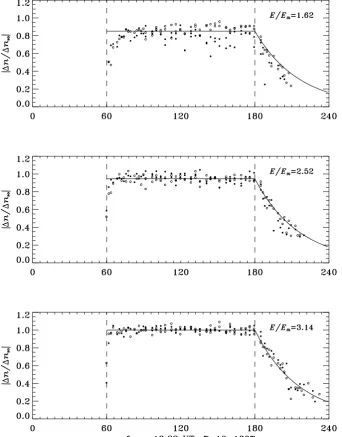
Fig. 3. Temporal variations of the
den-sity perturbation normalized to the satu-ration level observed in the central gates are presented for three ratios of pump electric field to the threshold field. Ver-tical lines at the times 13:23 UT and 13:25 UT show the moments of switch-ing on and switchswitch-ing off of the HF heating. The horizontal line marks the mean value of the density perturba-tions during the heating and represents the saturation level. The solid line af-ter 13:25 UT shows the density decay which is deduced from the fitting of the observational points and follows the ex-ponential law of Eq. (3).
the radius of the heated spot varies from 28.8 to 30.3 km. In the situation when the gates are located almost symmetri-cally with respect to the centre of the heated cone, the gates that are closer to the vertical receive more power than the opposite ones (see the dashed line in Fig. 2) and therefore the HF signal may be scattered from the gate which corre-sponds to ther/a between 1.5 and 2, but not from the gate between−2 and −1.5. As a result, the scattered signal is observed in seven gates and the value of the threshold power is estimated to be∼0.09 W(0) (dashed-dotted line in Fig. 2). Taking into account that the magnitude of the pump electric field is proportional to the square root of the radiated power, the ratio of the average electric field to the threshold value is estimated to be∼3.14±0.03,2.52±0.12,1.62±0.2 for the gates centered at∼7.5, 22.5, 37.5 km, respectively, from the center of the heated patch. Since these values are
cru-cial for the analysis given below in this section, we introduce the uncertainties in their determination that correspond to the uncertainty of 10% in the determination of the radius of the heated region.
3.2 Decay rate
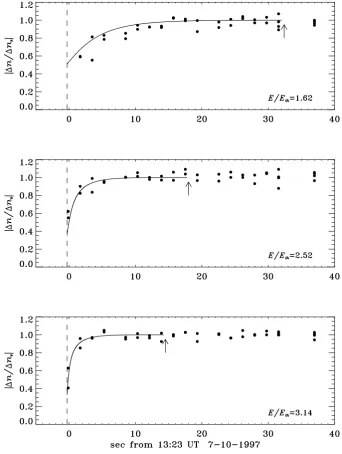
Fig. 4. Density perturbation normalized
to the saturation level versus time, as (i) measured by the HF coherent radar (circles) and (ii) estimated from Eq. (2) with the parametersσ1n2o ≈ 0.5 and D⊥≈5·10−2m2s−1(solid line), for three ratios of the pump electric field to the threshold level, E/Et h = 3.14,
2.52, 1.62. Arrows show the estimated time of the stabilisation for each value of pump field.
correspond to the moments of the switching on and switch-ing off of the HF heatswitch-ing, respectively. Phenomenologi-cally, the development of the FAI is consistent with the TPI mechanism. When the heater is switched on, the density perturbation begins to grow; it then reaches the saturation level and decays after the heater is switched off. The de-cay rate does not depend on the pump electric field and is found to follow the exponential law (3). The diffusion co-efficient that produces the best fit to these data is estimated to beD⊥ ≈ 5·10−2±0.8 ·10−2 m2s−1, which
corre-sponds to an e-folding time of∼36±5 s. The fact that the diffusion coefficient remains approximately constant during the decay phase demonstrates that electron temperature is not changed significantly during the HF heating whenever it is made with a small power. Uncertainty in the
deter-mination of the diffusion coefficient 1D⊥ might be used
to estimate the upper limit of the temperature modification 1Te, which cannot be resolved from the observations. If the electron-ion collisions are dominant at the upper-hybrid altitude, then the diffusion coefficient varies proportionally to∼ Te−1/2 (see, for example, Gurevich, 1978) and, there-fore,1Te ≈2(1D⊥/D⊥)Te≈680 K. In the case when the electron-neutral collisions determine the effective electron collision frequency, the diffusion coefficient changes propor-tionally to∼Te2∼Te3/2
3.3 Saturation level as a function of pump electric field According to the discussion given in Sect. 2, the density per-turbation in FAI grows exponentially at the first stage of the heating, but quickly reaches its saturation level, which is pro-portional topσ−11n(E/E
t h). Under the conditions when the time duration of the heating with constant power (some minutes) is essentially larger than the time of the FAI growth (some tens of seconds), the saturation level of the density perturbations may be reasonably estimated by the averaging of the density perturbations measured during the heating pe-riod. Let us first assume that the variableσ does not de-pend on the gate position with respect to the center of the heated patch. Then, the saturation levels calculated from Eq. (7) and normalized by the saturation level, which was observed in the central gates, are 1, 0.9±0.02, 0.65±0.08 for the neighboring gates withE/Et h=3.14±0.03, 2.52±0.12, 1.62±0.2, respectively. The observations presented in Fig. 3 show that these levels are related, such as 1, 0.95, 0.85, which is slightly different from the values predicted by the log-arithmic law. This means that the termσ is not constant, but varies with the position with respect to the center of the heated spot and is larger for the highest pump electric field. This variation is consistent with the density gradient at the altitude of the wave scattering, which is weaker in the center than at the edges of the heated spot (the termσ is inversely proportional to the density gradient). This result could be due to the large-scale density defocusing, which, according to the observations of the reflected signal, took place during the considered HF heating.
3.4 Time of growth as a function of pump electric field The time when the density perturbation reaches its stabi-lization can be estimated numerically by plotting the den-sity perturbation versus time, evaluated from Eq. (2), and assuming that the saturation time corresponds to the mo-ment when the density variation begins to be negligible, i.e. ∂1n/∂t < 10−5. In Fig. 4, we present the density per-turbation normalized to the saturation level that (i) is mea-sured in three pairs of symmetrical gates and shown by cir-cles, and (ii) is found from Eq. (2) and shown by solid line. The value of the diffusion coefficient is taken from the previ-ous considerations and the estimate of the initial perturbation σ 1n2o ≈ 0.5 is chosen to fit the observational points. The characteristic times of the stabilization (shown by the arrows in Fig. 4) are found to be 14.5±0.5, 18±1 and 32.4±7 s for the ratios withE/Et h=3.14±0.03, 2.52±0.12, 1.62±0.2, re-spectively, i.e. approximately following theE−1 law. The main advantage of the fitting is that it provides the estimates of the initial density perturbations with respect to the satu-ration level and we conclude that under the HF heating, the amplitude of the density depletion grows in the ratios∼3, 2.9, 2 under the conditionsE/Et h=3.14, 2.52, 1.62, respec-tively.
It should be mentioned here that although the estimates of the growth time are consistent with the results of the
previ-ous publications (see, for example, Frolov et.al, 1997), how-ever, the folding law is estimated to be different. Frolov et al. (1997) considered a large range of the effective pump power with the low limit around the threshold level and found the E−2 law. The difference may be due to the strong depen-dence of the folding law on the amplitude of the pump elec-tric field.
4 Conclusions
We have presented a case study of the HF coherent scatter radar observations during the HF heating with small power, which, nevertheless, represents a general behavior of the small-scale FAI developed in the dayside ionosphere at the altitudes around 200 km and have demonstrated that:
– the slowing of the density growth that is caused by the transverse thermal conductivity leads to the stabilization of the density perturbation in the time which is inversely proportional to the pump electric field;
– the saturation level varies slowly with the pump electric field and follows the logarithmic law;
– HF heating with small power leads to the insignificant modification of the electron temperature (few hundred K) and to the variation of electron density in only a few times.
Overall, our investigations reveal that the simple model of the TPI with three-wave interaction is consistent with the main physical characteristics of the mechanism of instability in the upper-hybrid range.
Acknowledgements. This work was supported by PPARC grant
PPA/G/O/1999/00181. We acknowledge the EISCAT staff for oper-ating the facilities.
The Editor in Chief thanks E. Mjolhus and another referee for their help in evaluating this paper.
References
Bond, G., Robinson, T. R., Eglitis, P., Wright, D. M., Stocker, A. J., Rietveld, M. T., and Jones, T. B.: Spatial observations by the CUTLASS coherent scatter radar of ionospheric modification by high power radio waves, Ann. Geophysicae, 15, 1412–1421, 1997.
Dysthe, K. B., Mjølhus, E., P´ecseli, H. L., and Rypdal, K.: A ther-mal oscillating two-stream instability, Phys. Fluids, 26, 146–157, 1983.
Frolov, V. L., Erukhimov, L. M., Metelev, S. A., and Sergeev, E. N.: Temporal behaviour of artificial small-scale ionospheric irreg-ularities: reveiw of experimental results, J. Atmos. Solar-Terr. Phys., 59, 2317–2333, 1997.
Gurevich, A. V.: Nonlinear phenomena in the ionosphere, (Eds) Roederer, J. G. and Wasson, J. T., Springe, 1978.
Inhester, B.: Thermal modulation of the plasma density in iono-spheric heating experiments, J. Atmos. Terr. Phys., 44, 1049– 1059, 1982.
Minkoff, J.: Radio frequency scattering from a heated ionospheric volume, 3, Cross section calculations, Radio Sci., 9, 997–1004, 1974.
Robinson, T. R.: The heating of the high latitude ionosphere by high power radio waves, Physics Reports, 179, 81–209, 1989. Robinson, T. R., Stocker, A. J., Bond, G., Eglitis, P., Wright, D., and
Jones, T. B.: O and X mode heating effects observed simultane-ously with the CUTLASS and EISCAT radars and low power HF diagnostics at Tromsø, Ann. Geophysicae, 15, 134–136, 1997. Robinson, T. R., Stocker, A. J., Bond, G., Eglitis, P., Wright, D.,
and Jones, T. B.: First CUTLASS-EISCAT heating results, Adv. Space Sci., 21, 663–666, 1998.