www.adv-radio-sci.net/14/91/2016/ doi:10.5194/ars-14-91-2016
© Author(s) 2016. CC Attribution 3.0 License.
Risk analysis with a fuzzy-logic approach of a complex installation
Tim Peikert1, Heyno Garbe1, and Stefan Potthast2
1Institute of Electrical Engineering and Measurement Technology, Leibniz Universität Hannover, Hannover, Germany 2Bundeswehr Research Institute for Protective Technologies, NBC-Protection, Münster, Germany
Correspondence to:Tim Peikert ([email protected])
Received: 15 January 2016 – Revised: 23 June 2016 – Accepted: 6 July 2016 – Published: 28 September 2016
Abstract.This paper introduces a procedural method based on fuzzy logic to analyze systematic the risk of an elec-tronic system in an intentional electromagnetic environment (IEME). The method analyzes the susceptibility of a com-plex electronic installation with respect to intentional elec-tromagnetic interference (IEMI). It combines the advantages of well-known techniques as fault tree analysis (FTA), elec-tromagnetic topology (EMT) and Bayesian networks (BN) and extends the techniques with an approach to handle un-certainty. This approach uses fuzzy sets, membership func-tions and fuzzy logic to handle the uncertainty with proba-bility functions and linguistic terms. The linguistic terms add to the risk analysis the knowledge from experts of the inves-tigated system or environment.
1 Introduction
Intentional electromagnetic interferences (IEMI) are able to disturb susceptible electronic systems (Hoad et al., 2004; Nitsch et ak., 2004). In our modern society, the dependency on electronic systems is still increasing and their continuous functioning is highly desirable. That requirement is opposed by an increasing vulnerability of electronic devices caused by the strong interconnection of such systems. Therefore, the breakdown of only one subsystem can lead to a failure of the whole system. Because of growing risk and the huge com-plexity of highly interconnected electronic devices, a statis-tical model representing the real system is required (Bedfort and Cooke, 2001).
There are different methods that are usually applied in the risk analysis, e.g. the electromagnetic topology (EMT) (Baum, 1980) approach, the fault tree analysis (FTA) (Genender et al., 2011b) and Bayesian networks (BN) (Mao and Zhou, 2010; Mao et al., 2011). To calculate the risk with
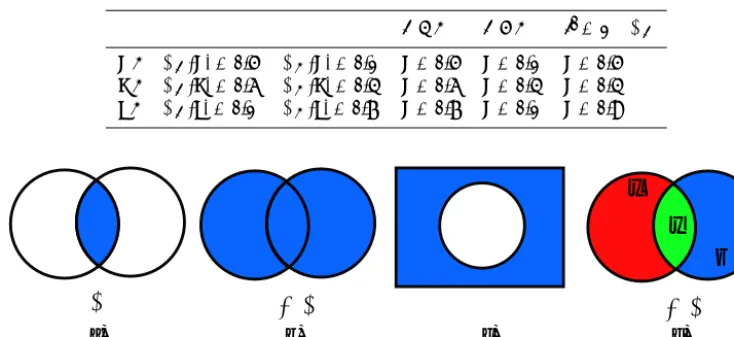
Table 1.An example for operation on Fuzzy Sets
A∪B A∩B Aˆ=1−µA
x: µA(x)=0.5 µB(x)=0.1 x=0.5 x=0.1 x=0.5
y: µA(y)=0.6 µB(y)=0.4 x=0.6 x=0.4 x=0.4
z: µA(z)=0.1 µB(z)=0.7 x=0.7 x=0.1 x=0.9
A Ç B
Α
È
Β
A
B
A
B
A
Â
Α
È
Β
A
B
a) b) c) d)
x
y
z
Figure 1.Fuzzy-Logic operator: disjunction, conjunction and complement.
of experts of the needed knowledge to develop a disturbance source.
2 Fuzzy approach to determine the risk
The fuzzy approach (Peikert et al., 2015) is divided into two main parts, the fuzzy set theory and the fuzzy logic. The set theory (Zadeh, 1965) allows an object belonging to multiple exclusive sets. Instead to the classical set theory in which an individual object is either a member or non-member of a set. Due to insufficient knowledge or imprecise data of a system, it is often impossible to definite assign an object is belonging to a set or not.
The fuzzy setAeofX is characterized by a membership functionµA(x)which is associated with a number in the in-terval [0,1], representing the degree ofxbelonging toXand is expressed with the follow equation:
e
A= {(x, µA(x))|x∈X}withµA:X→ [0,1]. (1) These membership functions are typically linear and have of-ten the shape of a triangle, trapezoid, sigmoidal or Gaussian bell. Exemplary, the Gaussian bell shape is describe with the following membership function:
µA(x)=
0 x≤a,
exp−1/p(x) a < x < b,
0 x≥b
(2)
More flexible classes of membership functions are also possi-ble, an example of the description of the breakdown behavior probability of a system is shown in Peikert et al. (2015).
As in the classical set theory, fuzzy sets have their own mathematical operators such as union, intersection and com-plement (Fig. 1). This three typically aggregation operators of two setsAasµA(x)andB asµB(x)are based on Takagi
and Sugeno (T–S) model Aliev (2013) and defined as follow:
union: A∪B⇔µA∪B(x)
=µA(x)∪µB(x)=max{µA(x), µB(x)}, intersection: A∩B⇔µA∩B(x)
=µA(x)∩µB(x)=min{µA(x), µB(x)}, complement: Aˆ⇔µAˆ(x)=1−µA(x).
Instead to the classical set theory, the mathematical oper-ation on fuzzy sets are based on the membership functions. The operation for classical sets are shown in Fig. 1a–c and leads forA∪Bto{x, y, z}, forA∩Bto{y}and the comple-ment leads forAˆto{z}. In contrast, the fuzzy set theory ob-tained results (Fig. 1d) for a max-min rule is show in Table 1. The degree of truth that an element belongs to the union of some fuzzy sets is the maximum of the degrees of truth that the element belongs to each of the fuzzy sets. For the inter-section it is the minimum and for complement of a fuzzy set is one deducted by the degree of truth that the element be-longs to the fuzzy set.
3 Prediction of the risk-level by analytical description
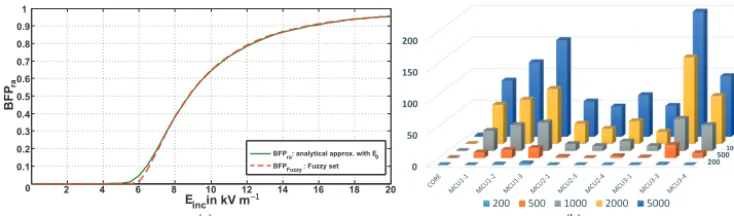
To predict the risk at system level of a complex electronic installation (example the complete IT-System of a critical in-frastructure) it is necessary to characterize the behavior of each subsystem. Furthermore, it is important to characterize the environment of the investigated infrastructure with their buildings and surrounding areas. In the paper of (Peikert et al., 2015) a fuzzy membership function for the breakdown failure probability (BFP) from (Genender et al., 2011a) is presented and are used to predict the BFPra, in which “ra”
0 2 4 6 8 10 12 14 16 18 20 0.1
0.2 0.3 0.4 0.5 0.6 0.7 0.8 0.9 1
BFP
ra
Eincin kV m
BFPra: analytical approx. with E0
BFPFuzzy : Fuzzy set 200500
10002000 5000
0 50 100 150 200
200 500 1000 2000 5000
(a) (b)
–1
Figure 2. (a)BFPramembership function (Peikert et al., 2015) and(b)breakdowns of each MCU subsystem.
Figure 3.Mapping of the availability on the probability of occurrence(a)and the cost on the probability of occurrence(b)by Sabath and
Garbe (2015).
is calculated as follows:
µBFPra(x;α, β)=
0 x ≤ 0,
x R
0
f (t;α, β)dt 0 < x ≤ 1
1 x > 1
(3)
where f (t;α, β) is the standard beta probability density function (PDF),
f (t;α, β)=
1
B(α, β)t
α−1(1−t )β−1 0≤t≤1,
0 otherwise
(4)
andB(α, β)is the beta function. The shape of the beta model is completely determined by the two shape parameter,αand
β and depending on the applied EM fieldEMCis shown in
Fig. 2a.
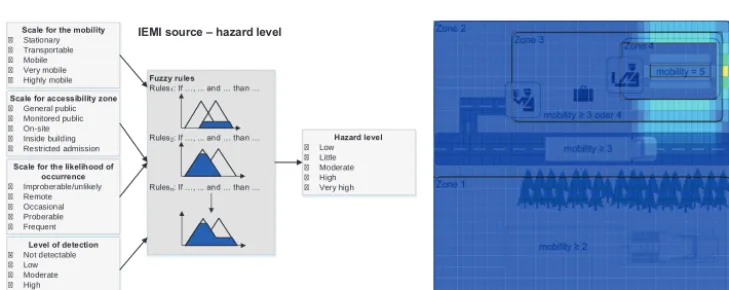
To predict the risk level for the system with the consid-eration of its environment, a map of accessibility zones and needed mobility (Genender et al., 2014) is used. In Fig. 6b the infrastructure with their buildings and surrounding are il-lustrated.
This information of the IEMI scenario are not enough to predict the risk. Non-physical data are added with linguistic terms. This data can be the accessibility to the infrastructure, the mobility of a source, the availability of a source and any other experts opinion to improve the prediction of the risk level (Peikert et al., 2015). In the work of Sabath and Garbe (2015) the opinion of different experts are published, for
ex-ample in Fig. 3 are the opinion of the experts for the avail-ability and the cost for an IEMI source illustrated. The bars in Fig. 3 depict the different rating from the experts. This leads to imprecise data and is typical for the risk classification. The fuzzy approach is perfect to handle these uncertainty and lin-guistic terms from Fig. 3.
4 Test environment and system setup
Figure 4. (a)Compound of different microcontroller and(b)block diagram of the MCU.
Figure 5. (a)The fuzzification and fuzzy rules of the expert opinions and(b)are the risk level membership function.
Scale for the mobility
Stationary Transportable Mobile Very mobile Highly mobile
Level of detection
Not detectable Low Moderate High Sure
Scale for the likelihood of occurrence
Improberable/unlikely Remote Occasional Proberable Frequent
Scale for accessibility zone
General public Monitored public On-site Inside building Restricted admission
Hazard level
Low Little Moderate High Very high IEMI source – hazard level
Fuzzy rules
Rules1: If …, ... and … than …
Rules2: If …, ... and … than …
Rulesn: If …, ... and … than …
(a) (b)
Figure 6. (a)Fuzzy sets and their fuzzification rules and(b)the area zones with risk level for IEMI-Sources.
The compound is exposed by a double exponential pulse of the PBG7 from the company Kentech.
For one minute the system is exposed by 200, 500, 1000, 2000 or 5000 pulses at different positions in the GTEM-cell. The different positions lead to a different electric field mag-nitude. The results of the malfunction of the 300 repetition and a field amplitude of 20 kV m−1are shown in Fig. 2b.
5 Risk prediction
The prediction of the risk level for the victim system includes the breakdown behavior of the microcontroller compound
(Fig. 2a), the knowledge of the area (Fig. 6b) and of pos-sible IEMI sources (Fig. 3). The expert opinions are uses as the fuzzy rules in the fuzzification and defuzzification block which is shown in Fig. 5a and are defined as If – Then fuzzy rules. The inputs are defined by the vectore1toenand lead to the outputu.
combina-tion by the fuzzy rule. A general rule for the fuzzy system in Fig. 6a is: If A and B and C and D then Hazard Level(x). The expert opinions are used to improve the rules for the risk estimation. The more precisely the knowledge of experts de-scribe the system, the better the risk can be estimated.
The results of the technology challenge, mobility-, threat-and hazard level of the fuzzy systems lead to a probability of occurrence and a possible field strength. Both results are mapped on the risk level membership function (Fig. 5b) and lead to risk estimation of the system.
The obtained results have to integrate onto the area plan (Fig. 6b) with the zones of accessibility and their mobility level. The zone number four with the mobility level of five stands for the victim system. The complete area are divided into rectangle with a fix size of the area. For every rectangle the distance to the victim system is calculated. The distance and the accessibility zone of the rectangle leads to possible IEMI sources and its maximum field amplitude. The far field conditions leads to an attenuation of the field strength by a factor of 1/r, in which r is the distance from a source to the victim system. The obtained field strength and the result of the risk level of the IEMI source are combined with the breakdown probability of the victim system leads to a risk level. This is calculated for every rectangle and the results are mapped into the area plan. The result of the risk level matrix for the area plan of the zone of accessibility is shown in Fig. 6b. This map shows locations in which a IEMI source can harm the victim system. In this example the victim sys-tem is located in the upper right corner of the area and a IEMI source in zone number two right of the victim system has a risk level of 0.6 (yellow filled rectangle) to harm the system. This location is a point of interest for a better protection of the system and has to consider in the EMC shielding of the system.
6 Conclusions
We show the usage of the theoretical approach published in Peikert et al. (2015) for a real complex electronic sys-tem and its environment. This method helps to analyze the risk of a system exposed to IEMI. It combines physical (e.g. BFP) as well as non-physical quantities (e.g. linguistic terms and experts opinions), non-precise and uncertainness data for the analysis. The fuzzy risk analysis approach combines the breakdown behavior of an electronic system with the infrastructure and the surrounding area, demonstrated for a compound of different microcontroller circuits. The fuzzy method delivers a estimation of a risk level matrix of the area, which provides points of interest. This points of interest show locations of IEMI sources which can harm the victim system and have to consider in the EMC protection plan.
Acknowledgements. The results shown in this paper were partly produced with the support of the Bundeswehr Research Institute for Protective Technologies, NBC-Protection in Münster, Germany (E/E590/CF149).
We acknowledge support by Deutsche Forschungsgemeinschaft and Open Access Publishing Fund of Leibniz Universität Hannover. Also, the results shown in this paper were partly produced with the support of the Bundeswehr Research Institute for Protective Tech-nologies, NBC-Protection in Münster, Germany (E/E590/CF149).
The publication of this article was funded by the open-access fund of Leibniz Universität Hannover.
Edited by: F. Gronwald
Reviewed by: two anonymous referees
References
Aliev, R. Az.: Fundamentals of the Fuzzy Logic-Based Generalized Theory of Decisions, Springer, Berlin, Germany, 2013.
Baum, C. E.: Electromagnetic topology: A formal approach to the analysis and design of complex electronic systems, Interaction Notes, Note 400, 1980.
Bedfort, T. and Cooke, R.: Probabilistic Risk Analysis: Founda-tions and Methods, Cambridge University Press, Cambridge, UK, 404 pp., 2001
Camp, M., Gerth, H., Garbe, H., and Haase, H.: Predicting the breakdown behavior of microcontrollers under EMP/UWB im-pact using a statistical analysis, IEEE T. Electromagn. C., 46, 368–379, doi:10.1109/TEMC.2004.831816, 2004.
Genender, E., Mleczko, M., Döring, O., Garbe, H., and Potthast, S.: Fault tree analysis for system modeling in case of intentional EMI, Adv. Radio Sci., 9, 297–302, doi:10.5194/ars-9-297-2011, 2011a.
Genender, E., Kreth, A., Zamow, D., Garbe, H., and Potthast S.: Combination of the failure probability with a random angle of incidence of the radiated interference, General Assembly and Scientific Symposium, 2011 XXXth URSI, Turkey, Istanbul, 13– 20 August 2011, 1–4, doi:10.1109/URSIGASS.2011.6050709, 2011b.
Genender, E., Garbe, H., and Sabath, F.: Probabilistic Risk Analysis Technique of Intentional Electromagnetic Interfer-ence at System Level, IEEE T. Electromagn. C., 56, 200–207, doi:10.1109/TEMC.2013.2272944, 2014.
Hoad, R., Carter, N. J., Herke, D., and Watkins, S. P.: Trends in EM susceptibility of IT equipment, IEEE T. Electromagn. C., 46, 390–395, doi:10.1109/TEMC.2004.831815,2004.
Nitsch, D., Camp, M., Sabath, F., Haseborg, J. L., and Garbe, H.: Susceptibility of Some Electronic Equipment to HPEM Threats, IEEE T. Electromagn. C., 46, 380–389, doi:10.1109/TEMC.2004.831842, 2004.
Mao, C. and Zhou, H.: Bayesian Networks Modeling in System-level Susceptibility Assessments of Intentional EMI, Proceed-ings of the Ninth International Symposium on EMC, Wroclaw, Poland, 13–17 September 2010, 502–505, 2010.
Pro-ceedings, Suzhou, China, 12–16 September 2011, 1315–1319, 2011.
Peikert, T., Garbe, H., and Potthast, S.: A fuzzy approach for IEMI risk analysis of IT-Systems with respect to transient disturbances, 2015 IEEE Int. Sym. Electromagnetic Compatibility (EMC), 1077–1082, doi:10.1109/ISEMC.2015.7256318,2015.
Sabath, F. and Garbe, H.: Assessing the Likelihood of Varous Intentional Electromagnetic Environments, 2015 IEEE Int. Sym. Electromagnetic Compatibility (EMC), 1083–1088, doi:10.1109/ISEMC.2015.7256319, 2015.
Viertl, R.: Statistical Method for Fuzzy Data, Wiley, 2011. Zadeh, L. A.: Fuzzy sets, Information and Control, 8, 338–353,