R E S E A R C H
Open Access
The relationship among the premonitory
factors of landslide dam failure caused by
seepage: an experimental study
Prakash Dhungana
*and Fawu Wang
Abstract
Background:A landslide dam always has the potential for catastrophic failure with high risk for life, cost and, property damage at the downstream site. The formation of a landslide dam is a natural process; thus, minimizing the risk due to its failure is important. Landslide dam failure can be categorized into three types: seepage failure, overtopping and slope failure. As described by other researchers, the established premonitory factors of landslide dam failure are hydraulic gradients, seepage and turbidity as well as vertical displacement and inflow into the reservoir.
Methodology:This study only considered seepage failure and used flume experiments to understand it. Three groups of samples which represented fine, medium and coarse particle sizes, respectively, were prepared by Silica sand S4, S5, S6 and S8 of different proportion. These samples were used to conduct the flume experiments of failure and not failure case.
Result:For failure cases, it was found that GI samples have a higher hydraulic gradient and that the seepage water takes time to exit the dam body—however, the seepage water has more TSS. GII samples also had a higher hydraulic gradient, while the flow of seepage water was faster than that of the fine sample with a low TSS. For GIII samples, the hydraulic gradient was very low in comparison with the GI and GII samples. The GIII samples had TSS values that were quite a bit higher than those of the GII samples and lower than those of the GI samples. Experiments on GI samples failed at each attempt; however, the GI samples with kaolinite did not fail and had a higher TSS value. For a GII sample of a non-failed case, the hydraulic gradient was lower than for GI samples and the seepage water flow was faster but the vertical displacement was constant and TSS was on a decreasing order. For a GIII sample, the hydraulic gradient became constant after reaching its initial peak value and TSS was on a decreasing order with an initially increasing vertical displacement that would become constant.
Conclusion:Seepage failure of a landslide dam can be predicted by understanding the nature of its premonitory factors. These factors behave differently in different particle size samples. The TSS trend line may be the initial factor for checking the stability of a dam crest. A landslide dam with an increasing TSS order will fail and a decreasing order may not fail. Based on all experiments, it can be concluded that the hydraulic gradient has three stages: 1) it starts to increase and reaches a peak value; 2) it starts to decrease from the peak value and reaches a minimum; and 3) it starts to increase again where the seepage water begins to come out and the vertical displacement starts to increase. Dam failures always occur when seepage water comes out with an increasing TSS and an increasing vertical displacement. Repeated experiments on samples having more fine particles show that if a landslide dam is formed by fine particles, then there would be a high chance of its failure. In case of a constant hydraulic gradient, the landslide dam would be stable whenever there is an increasing vertical displacement and presence of TSS. Similarly, in case of a constant vertical displacement and a decreasing TSS, a landslide dam would be stable.
Keywords:Landslide dam, Seepage, Hydraulic gradient, Total suspended solids (TSS)
© The Author(s). 2019Open AccessThis article is distributed under the terms of the Creative Commons Attribution 4.0 International License (http://creativecommons.org/licenses/by/4.0/), which permits unrestricted use, distribution, and reproduction in any medium, provided you give appropriate credit to the original author(s) and the source, provide a link to the Creative Commons license, and indicate if changes were made.
* Correspondence:[email protected]
Introduction
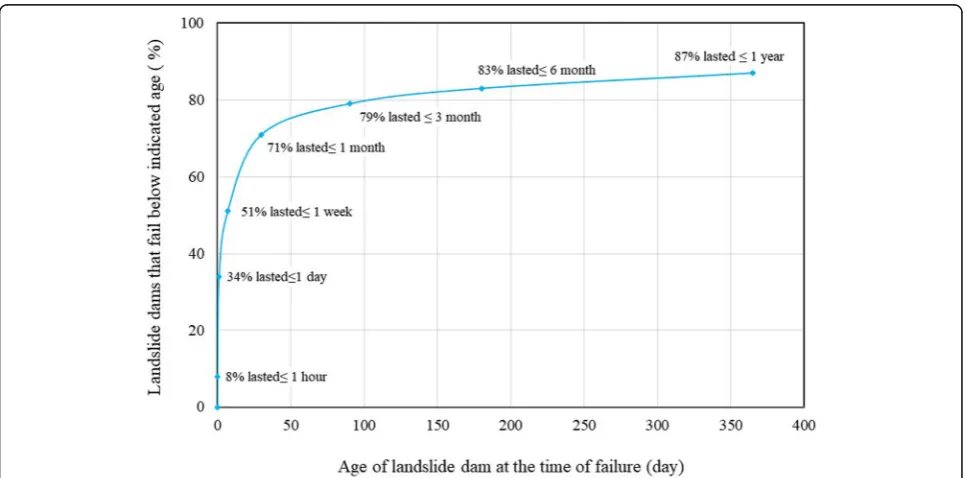
Landslides or rock avalanches can form landslide dams if their moving mass is sufficient to change the hydro-logical dynamics of a river channel and form a reservoir (Costa and Schuster1988; Canuti et al.1988; Ermini and Casagli 2003; Kourp et al. 2010; Tacconi et al. 2018). The life span of these natural dams depends upon differ-ent natural factors. The failure of these dams creates additional and catastrophic disasters. According to the history of landslide dam failure, about 34% of landslide dams have failed within a day of their formation. Simi-larly, 87% of all landslide dams fail within a year of their formation (Fig. 1). These statistics also indicate that about 40% of landslide dams have a medium life span. These dams should be investigated after within a short period of their formation for a risk reduction plan to be made for saving the life and property located down-stream of it. A better understanding of premonitory factors, which can easily be measured or observed in actual landslide dams that are at high risk of failure, is important for disaster reduction (Wang et al. 2018). A landslide dam that has not failed for more than one year could allow enough time for investigation, resulting in a high accuracy of prediction in comparison to those land-slides that have a life span between two days and several months. In this scenario, those landslide dams with a short life span are very important for the study of the premonitory factors, especially to discover in which conditions they would fail. These studies would directly support the engineers and decision-makers of disaster
management teams of the life and property safety at the downstream site.
It has been shown that the failure sequence of a dam can be divided into four periods: 1) the emerging of seepage water and front wetting, 2) the hyper-concentrated flow discharge, 3) the emergence and development of a dam crest and 4) the failure of a dam crest with a sharp increase in its subsidence (Wang et al. 2018). The additional question is: What will be the conditions for the failure or stability of a landslide dam?
The inflow rate into the reservoir as well as the magni-tude, dam size and dam material are relevant for the fail-ure of a landslide dam (Schuster and Costa 1986). An approach utilizing the Dimensionless Blockage Index (DBI) has previously been proposed for the stability ana-lysis of landslide dams, as shown below (Eq.1):
DBI¼Log Ab Hd Vd
ð1Þ
where Ab is the area of a basin or reservoir, Hd is the
dam height and Vd is the volume of the dam material.
DBI is directly related to the geometry of a dam struc-ture and reservoir size. Statistical analysis has indicated that a dam is stable when DBI is < 2.75, quasi-stable when it is 2.75 <DBI< 3.08 and unstable whenDBIis > 3.08 (Ermini and Casagli 2003). However, some records did not satisfy this equation. Some of them, having large
DBI values showing their instability, have existed for a very long time and vice-versa (Storm2013).
The hydraulic gradient is defined as a head loss, with respect to the distance travelled by a flow of water through a media, as seen in Eq.2:
i¼−Δh=L ð2Þ
where i= the hydraulic gradient,Δh= the head loss and
L= the distance travelled by water. Similarly, the flow of seepage volume can be calculated as seen in Eq.3:
Q¼kiA ð3Þ
where Q is the seepage discharge, k is the hydraulic conductivity,iis the hydraulic gradient andAis the area through which the discharge flows. In a laboratory, util-izing a pore water sensor, the total head in the defined positions can be measured. Using the formula of pore water pressure (u=γwh), the total head can be calculated considering the dam and flume tank geometry. Seepage water is a very important factor for a landslide dam, which is visible on its downstream side at the actual landslide dam field. The parameters related to seepage water can enlighten the failure process of a landslide dam. Darcy (1856, cited in Fredlund et al. 2012) and Okeke and Wang (2016a) have noted that the seepage flow velocity into a dam is directly dependent upon the hydraulic gradient, as shown in Eq.4:
vw¼kw dhw
dz ð4Þ
whereVw= the flow rate of water (m/s),kwis the
perme-ability coefficient with respect to the water phase (m/s) and dhw/dz= the hydraulic gradient in the z-direction.
Due to the pressure difference between the upward slope and the downward slope of a landslide dam, the seepage flow occurs in those dams that produce a seepage force. At the time of seepage flow, when the seepage force becomes greater than the erosion resistance force, soil particles begin to move with the seepage water.
Internal erosion is a major cause of embankment dam failure (Fell et al. 2003). Internal erosion that is caused by flow along pre-existing openings, such as cracks in cohesive material or voids along with a contact between the soil-structures (Richards and Reddy 2007), has a higher possibility of occurrence in landslide dams be-cause of their formation process. Erosion as the be-cause of landslide dam failure has previously been addressed by researchers (Wang et al.2018; Okeke and Wang2016b; Richards and Reddy 2007). Unfortunately, this potential failure mode cannot be completely analysed using nu-merical formulae or models. Seepage monitoring and
analysis for landslide dams may be one premonitory fac-tor in the field. According to Cedergren (1977), seepage failures have two types: (1) failure caused by erosion of soil particles and (2) failure caused by saturation and seepage forces. Jones (1981) has suggested that piping processes involve the dispersion of clay. The Dispersion Index method has been developed by Richie (1963) to determine the dispersity of soil. Richie (1963) has de-fined 33% of the soil fractions, with less than 0.004 mm dispersing after being shaken in water for 10 min, as indicative of potential failure by tunnelling for earth dams in Australia. Thus, fine particles are responsible for piping failure.
Rather than being initiated by a Darcian flow at an exit point, internal erosion is initiated by the erosive force of water along a pre-existing planar opening (Richards and Reddy2007). When pore water pressure increases on the downstream side of the dam, the competent cohesion of the soil would decrease. Reduction in cohesion reduces the resistance force and increases the seepage force that can erode the soil particles, as described by Eq.5:
Fs¼γwi ð5Þ
where Fs= the seepage force per unit volume, i= the hydraulic gradient and γw= the unit weight of water. Detailed research on seepage erosion for slope failures has been conducted by Rinaldi and Casagli (1999), Lobkovsky et al. (2004), Wilson et al. (2007), Fox et al. (2007) and many more.
In situ, the turbidity of downstream water provides the rate of erosion from the dam material, which plays a direct role in the subsidence and stability of a dam in the presence of a seepage water flow. According to Wang et al. (2018), the monitory factors remain un-changed at the initial stage as well as in the second stage; the turbidity and vertical displacement starts to slightly increase. Total suspended soils (TSS) also sup-port to understand the erosion into the dam material. Turbidity and TSS are identical premonitory factors that can be measured in both the field and laboratory settings. Fine particles, which are in between the coarser grains, are almost free from effective overbur-den and capable to migrate by a very low-velocity seep-age flow (Takaji and Yusuke 2008). Such eroded particles can be measured as TSS.
detail in a wide range of case studies. A common linear relationship may be defined as shown in Eq.6:
TSS¼mTurbidity NTUf g ð6Þ
Rügner et al. (2013) have found linear relationships between TSS and turbidity with m values of 1–2.8 mg l −1 NTU−1 (average 1.9 mg l−1 NTU−1) for natur-ally suspended sediments in rivers in southern Germany. Other studies report slightly lower or higher m values (e.g., 1.1 mg l−1 NTU−1 for particles from karstic springs or up to 3 mg l−1 NTU−1 for sus-pended sediments in the Lake Tahoe basin, respect-ively) (Schwarz et al.2011; Stubblefield et al. 2007). In the laboratory, the flume tank can be designed to col-lect seepage water for conducting TSS test. Sample collection time can be simulated to the time of com-puter using different methods and can relate to other monitoring factors.
Remote sensing is an important monitoring tool in the sphere of natural disaster research these days. Using geographic information system (GIS) and interferometric synthetic aperture (InSAR) technology, the displacement of dams can be monitored regularly. Commercial and non-commercial satellite images are available from different agencies. Images from both before and after an event can be analysed to monitor the landslide dam. Studies, based on GIS and remote sensing, provide useful results for management and engineers. The sub-sidence of landslide dam crest can be monitored in situ using simple technology for example laser levelling ma-chine can be used. Since subsidence can be monitored, the relation of vertical displacement to other monitoring factors would be very useful to predict the failure of landslide dam.
However, studies have been conducted on different type of landslide dam failure likely overtopping, pip-ing and seepage. Most of these studies have highlighted failure patterns and some studies have fo-cused on seepage failure and internal erosion like Fell et al. 2003; Okeke and Wang 2016a. Conducting an actual comparative study for understanding the stable and failure conditions of landslide dam is still neces-sary. The effect of erosion on TSS and its relation to other premonitory factors of landslide dam has not been well thought out yet.
Hence, this research aimed to establish the relation-ship between the premonitory factors of landslide dams during the failure process. Here, the hydraulic gradient was measured using pore water pressure sen-sors and the vertical displacement was measured using a laser sensor at the dam crest and from the seepage water collected from the dam site to measure
its TSS. The intention was to relate the TSS to the hydraulic gradient and the vertical displacement dur-ing the failure process usdur-ing a combination of differ-ent grade of artificial sand particles. The main aim of this study was to identify the real conditions for fail-ure that can be measfail-ured or understood in the field. Only seepage failure was considered.
Materials and methods Experimental setup
A flume tank, 0.45 m by 0.45 m (height * width) and 2.0 m long, was designed to collect the seepage water from the downstream side of a dam. The seepage water was collected using holes that were 0.75 m away from the dam centre, as shown in Fig.2. The dam height was 0.2 m and the upstream and downstream slopes were 45 degrees and 35 degrees, respectively. The width of the dam crest was 0.1 m. At the floor of the flume tank, double-sided tape was used and dry silica sand 6 was poured over it to main-tain the roughness between the dam material and flume tank floor. The flume tank was built using Plexiglas due to which visibility was possible. Based on practice, to obtain a seepage failure, the bed slope of the flume was designed as 1:40 slope. Three pore water pressure sensors, with a rated capacity of 50 kPa, were used—hereafter called Pwp1, Pwp2 and Pwp3—for the downstream and up-stream sides of the dam body and at the reservoir, respect-ively, as shown in Fig.2. These sensors were connected to the dam from the base of the flume tank facing upwards. Pwp1 and Pwp2 were covered by the filter material to control the flow of sand. The CMOS multi-function analogue laser sensors were used to measure the vertical displacement from the top of the flume tank using a wooden frame—hereafter called as Vdr and Vdl, for the right and left sides, respectively. Laser sensors monitored the dam crest at two fixed points continuously. A half-cut polyvinyl chloride (PVC) pipe was used to collect the seepage water from the downstream. A pipe was fixed below the holes with a gentle slope.
Materials
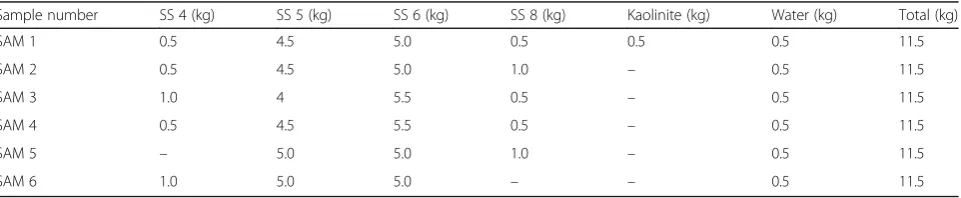
on these samples, experiments were conducted for failed and not failed dam conditions (Table2).
Before conducting the final experiment, a series of experiments were performed for selecting the sand mix ratio and initial water content for creating the desired dam shape. Silica sand is artificial sand but, in the field, the presence of different soil minerals plays a vital role in grain size percentage and turbidity. Kaolinite, which is one of the soil minerals present in most natural soils, was used here to understand the effects of minerals on seepage water, hydraulic gradient and vertical displace-ment. The grain size distribution of all samples is shown in Fig.3.
Methods
A mixing machine was used for mixing the dam ma-terials. Initially, the materials were weighed and poured into a mixing machine and mixed for five mi-nutes. Before creating the dam in the flume tank, a sample was collected to find its initial water content and index properties. Before creating the dam, sensors were also placed in their respective positions. The dam was prepared through a layer to layer compac-tion divided into four parts—each layer consisted of about 9 kg of sample, and about 1to 2 kg sample was used to make the final shape of the dam. Real-time data was collected using universal recorders (KYOWA
Table 1Silica sands and kaolinite mixed ratio of samples
Sample number SS 4 (kg) SS 5 (kg) SS 6 (kg) SS 8 (kg) Kaolinite (kg) Water (kg) Total (kg)
SAM 1 0.5 4.5 5.0 0.5 0.5 0.5 11.5
SAM 2 0.5 4.5 5.0 1.0 – 0.5 11.5
SAM 3 1.0 4 5.5 0.5 – 0.5 11.5
SAM 4 0.5 4.5 5.5 0.5 – 0.5 11.5
SAM 5 – 5.0 5.0 1.0 – 0.5 11.5
SAM 6 1.0 5.0 5.0 – – 0.5 11.5
PCD 300B and PCD 400). Sampling frequency was two numbers of data per second. Seepage water was collected to measure the TSS and the time of seepage water collection was recorded using a stopwatch. Seepage water was collected using a half-cut PVC pipe under the flume tank, facing upwards. Each sam-ple was collected for about 10 s (± 2 s). After collect-ing a sample for TSS, volume was measured and oven-dried using 105 °C temperatures. The weight of the dried sample was measured and TSS was calculated.
Results and discussion
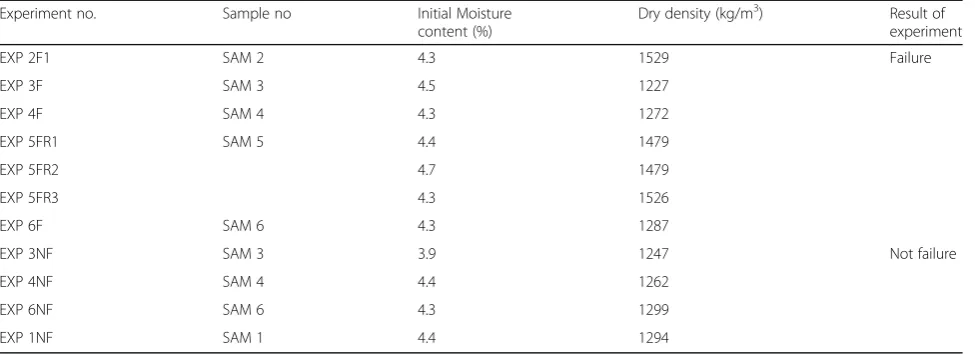
In this work, experiments are conducted to test the failure and stable conditions of a dam crest. Table 3 shows the experiment numbers and their statuses (either failed or stable). Experiments are conducted with GIII, GII, and GI samples to compare the failed and not failed conditions with respect to the hydraulic gradient, vertical displace-ment, and TSS. The inflow rate into the reservoir is the key to obtaining the failed and not failed conditions. The inflow rate in this study can be understood from the reser-voir level, i.e. pore water pressure at Pwp3. Stability and
time of failure of dam crest decreases with increase in in-flow rate into the reservoir (Okeke and Wang 2016a). Similarly decrease in inflow rate will increase the stability and failure time. However, experiments of GI samples EXP5FR1, EXP5FR2, EXP5FR3 are failed in all attempts, in spite of low inflow rates than in the GII sample of not failed condition. Thus, it can be concluded that fine sam-ples can fail easily. Additional figures in the annex cover additional experiments with GIII and GI samples of failure and not failure cases.
The reservoir was connected by a pipeline to the main water supply in the laboratory room. When the reservoir started to fill up, Pwp3 sensor started to respond. Seep-age began instantaneously and, as the water level in the reservoir increased, the water pressure also began to in-crease in the dam body and Pwp2 started to respond. Pwp1 sensors also responded after some time. Due to pressure head differences between Pwp1 and Pwp2, the hydraulic gradient began to increase and reached the peak value. Seepage of water continued to flow down-wards and the pore water pressure at Pwp1 started to in-crease and the hydraulic gradient started to dein-crease. Using the formula for pore water pressure (u=γwh), the water height has been calculated and, using Eq. 2, the hydraulic gradient is calculated by considering the slope angle of the flume tank. The rapidly increasing water content in the dam material supports the seepage water flow out of the dam. If the upward seepage forces on a body of soil exceed the gravitational forces at the point of exit, the vertical critical gradient will exceeded and soil particles may be removed from this area (Terzaghi
Fig. 3Grain size distribution curves of samples used in experiments Table 2Sample groups based on percentage of fine and coarser particle and, failure condition
Description Group I (GI) Group II (GII) Group III (GIII)
Failure SAM 5, SAM 2 SAM 4 SAM 3, SAM 6
et al. 1996). When the reservoir starts to fill up, the seepage force will increase and will exceed the gravita-tional forces and seepage water starts to come out with soil particles. The collected seepage water sample was oven-dried to measure the TSS. The dam and reservoir size, the slope of the flume tank, the position of sensors and the seepage water collection position was fixed for all experiments.
Characteristics of the premonitory factor for failure cases
Results of GI sample
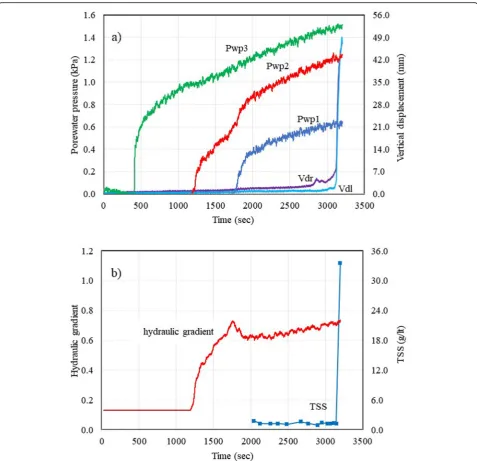
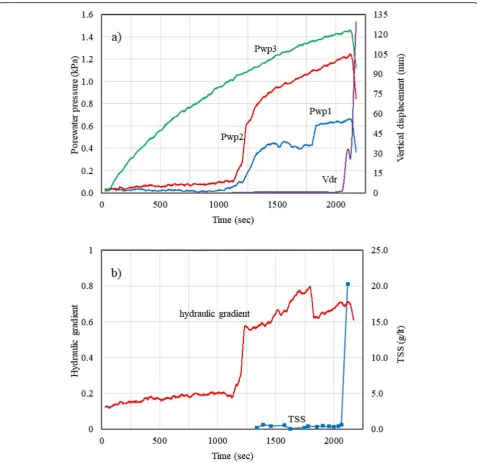
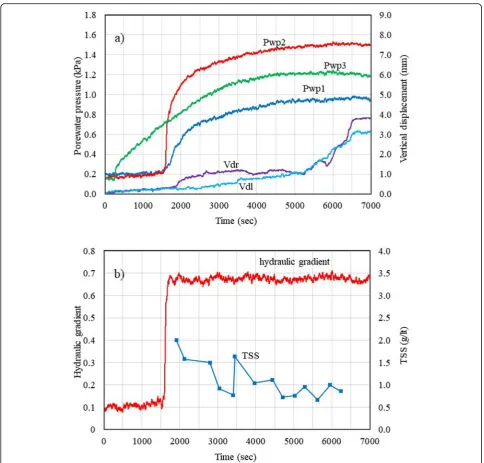
Experiment No. EXP 2F was conducted for the GI sam-ple. The reservoir began to fill up, with an increase in pore water pressure in Pwp3, resulting in the wetting of dam material front. The initial moisture content of the sample was 4.3% only. The saturation level has been in-creasing continuously, and the colours of the dam ma-terial also change from light to dark. The water level has increased at the Pwp2 sensor after about 600 s of Pwp3. The difference between the two-pore pressure inside the dam—i.e., Pwp2 and Pwp1—was high. The hydraulic conductivity of the soil would be affected by the particle size; the finer particles have low permeability. The ex-perimental results are presented in Fig.4. The hydraulic gradient was increased rapidly as pore water pressure in-creased in Pwp2 and reached the peak value, highest within this study. The hydraulic gradient began to de-crease from the peak value as Pwp1 started to inde-crease. The vertical displacement began to increase slowly at a nearly constant rate and then it rapidly increased prior to the dam crest failure. Wang et al. (2018), Okeke and Wang 2016a are also presented same pattern of hy-draulic gradient for the real sample of landslide dam fail-ure and for silica sand respectively. The downstream slope was continuously changing its topography due to the increase in water content and seepage failure. The
vertical displacement was about 2.5 mm just prior to the failure of the dam crest. The hydraulic gradient began to decrease from its peak value and the seepage water started to come out on the dam’s downstream side. An initial value of TSS was quite a bit higher in most exper-iments. TSS initially decreased and then began to in-crease slowly. Wang et al. (2018) also present that the turbidity of downstream seepage water has increased be-fore the failure. The vertical displacement rate was very low before the seepage water came out and, after the seep-age water flow, the rate of vertical displacement in-creased. The hydraulic gradient slowly started to increase as the downward slope failure increased and, at the same time, the reservoir level also increased— fi-nally, the dam crest failed.
Results of GII sample
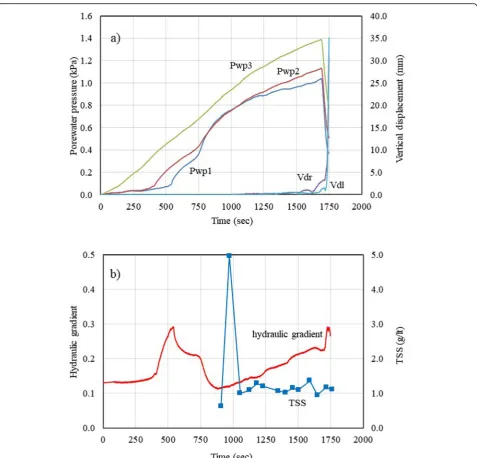
Experiment No. EXP 4F was conducted for the GII sam-ple. The wetting front was rapidly increased just after the beginning of the reservoir fill up. The pore water pressure was increased at Pwp3 as the reservoir started filling up and Pwp2 also began to increase after Pwp3 started. Pwp1 began at nearly the same time as Pwp2. The pore water pressure at Pwp2 is increased very quickly and, as a result, the hydraulic gradient also in-creased very quickly, from about 0.2 to 0.6. Due to a sudden failure of a small soil mass block from the upper part of the slope of the dam’s downstream side, the seep-age water flow is stopped and the water pressure at Pwp1 is increased, which also affected the hydraulic gradient. Figure5shows the details of the experiment re-sults. Initially, the hydraulic gradient reached the peak value but it does not decrease again to the minimum value, unlike in the other experiments in this study, and again started to increase instead. The hydraulic gradient was unsteady. Reasons for the fluctuation of the hydraulic Table 3Initial state of samples and result of experiments
Experiment no. Sample no Initial Moisture content (%)
Dry density (kg/m3) Result of experiment
EXP 2F1 SAM 2 4.3 1529 Failure
EXP 3F SAM 3 4.5 1227
EXP 4F SAM 4 4.3 1272
EXP 5FR1 SAM 5 4.4 1479
EXP 5FR2 4.7 1479
EXP 5FR3 4.3 1526
EXP 6F SAM 6 4.3 1287
EXP 3NF SAM 3 3.9 1247 Not failure
EXP 4NF SAM 4 4.4 1262
EXP 6NF SAM 6 4.3 1299
gradient are: 1) the release of water from the downstream into different pocket areas of the downstream slope and 2) the failure of the downward slope and the decreased position of the flow line. The vertical displacement was nearly constant at the initial stage and, as the hydraulic gradient is increased, the vertical displacement also increased. Due to the appearance and disappearance of minor cracks in the dam crest, the vertical displace-ment is increased and later decreased. The vertical displacement is about 0.85 mm prior to the failure of the dam crest. Figure 5c shows that seepage began when the hydraulic gradient reached the initial peak
value. Considering the time gap, due to the position of the seepage collection point, the vertical displacement began to increase when TSS is measured. With the changes in the hydraulic gradient and the increasing TSS, the dam became unstable and, finally, failed.
Results of GIII sample
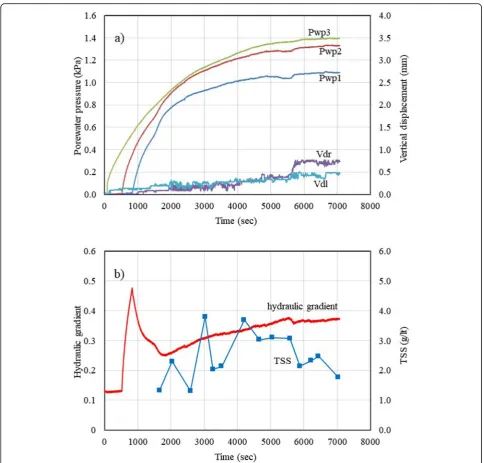
at Pwp2 and Pwp1 began to increase very quickly in comparison to the GI and GII samples. The pore water pressure at Pwp2 increased rather quickly and, after ap-proximately 250 s, the pore pressure at Pwp2 and Pwp1 become equal. The water level increased in the down-stream side of the dam, as a result of which the slope failed. As the slope failed, the position of the flow line changed and the pore pressure at Pwp1 increased with its decreasing rate. The results are presented in Fig. 6. The vertical displacement started to increase as the hy-draulic gradient increased. This could be the effect of changes in the water content of the dam body. The up
to come out at about 500 s of the peak hydraulic gradi-ent. The GIII sample has big voids, due to which the fine soil particles, which were in-between the coarse parti-cles, came out with the seepage water—resulting in higher turbidity. The TSS value is approximately 1.2 g/lt, which was higher in comparison to that of the GII and GI samples without kaolinite.
Characteristics of premonitory factors for the non-failure cases
Results of GI sample
Experiment No. EXP 1NF was conducted on the GI sample with kaolinite. Kaolinite is only used in this
at Pwp1, Pwp2 and Pwp3 became nearly constant. The vertical displacement and hydraulic gradient became constant as Pwp2 and Pwp1 become nearly constant. The maximum hydraulic gradient is about 0.47 and the vertical displacement is less than 1 mm during the experiment.
The seepage velocity inside the landslide dam would be very low and distant travel by the seepage water would not occur in a straight line. Thus, the eroded particles would travel in different directions and, finally, come out with the seepage water. If there are more fine particles, the seepage water
gradient and decreasing TSS are the causes of the dam crest not-failure.
Result of GII sample
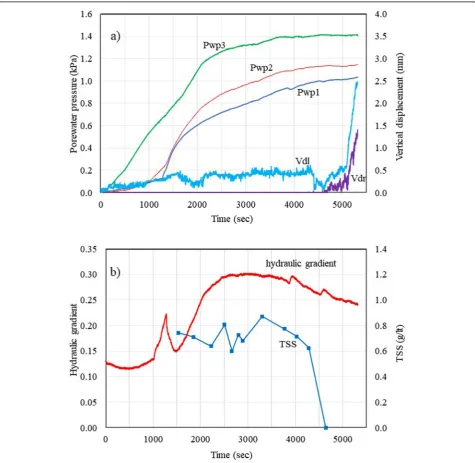
Experiment No. EXP 4NF was conducted for the non-failure case of the GII sample. As in the failure case (EXP 4F), initially, the pore water pressure in-creased at Pwp2 and Pwp1 together. The hydraulic gradient reached the peak value and started to decrease and the vertical displacement is constant at about 0.5 mm during the experiment; however, at last, it reached 2.5 mm due to a small crack
formation. The downstream slope topography was continuously changing due to the increase in the water level and seepage failure. After approximately 4000 s, the pore water pressure at Pwp3 became nearly constant. Figure 8 shows the results of the ex-periment. This condition can be considered as the inflow rate into the reservoir and the seepage water rate from the dam body is the same. At the same time, the pore water pressure at Pwp2 is also con-stant, which additionally proved that the dam is stable. Although the maximum value of the hydraulic gradient is about 1.2 at 3000 s, the dam crest is
stable, which shows the importance of the vertical displacement and the seepage water TSS for failure. The seepage water began to come out after the hy-draulic gradient decreased to the minimum value from its peak value. The hydraulic gradient reached the maximum value and started to decrease, while the TSS value also decreased. During the experi-ment, it is visualized that the turbidity of the water decreased. Finally, the TSS became zero. The vertical displacement is nearly constant throughout the ex-periment, at less than 0.5 mm. The changes in the water content in the dam material and at the dam crest surface could have an effect on the vertical dis-placement, which can be noticed in this experiment. Here, the constant vertical displacement and the de-creasing TSS are the main causes of the dam crest non-failure.
Result of GIII sample
Experiment no. EXP 3NF was conducted for the non-failure case of the GIII sample. The hydraulic gradient result obtained in this experiment is typical in this study, where the hydraulic gradient reached the peak value and become constant. The pore water pressure at Pwp2 and Pwp1 increased at the same time as in the failure case experiment. The rate of increase for Pwp2 and Pwp1 dif-fered from that in the failure case for the same sample. The vertical displacement increased from when the hy-draulic gradient began to increase—i.e. when the water level started to increase in the dam body. The vertical displacement increased very slowly, up to about 3.0 and 4.0 for Vdl and Vdr, respectively. Finally, the vertical dis-placement became constant and the pore water pressure in the reservoir started to decrease, which may be due to the higher rate of seepage water than of inflow into the reservoir. Figure 9 shows the experiment results. The maximum hydraulic gradient of this experiment is ap-proximately 0.67, which is higher than in the failure case for a coarse sample. The seepage water came out after 1850 s—i.e. just after the hydraulic gradient reached the peak value. The vertical displacement increased simul-taneously with seepage water. After reaching 1.5 mm, the vertical displacement increased rapidly until 3.7 mm and became constant. This experiment shows that the presence of TSS and the increment of the vertical dis-placement are not the only satisfactory conditions for failure but that the role of the hydraulic gradient also needs to be considered. The hydraulic gradient should reach the peak value, then decrease to the minimum value and once again start to increase as in the failure case presented in this report. In this experiment, the hy-draulic gradient is the main cause behind the dam crest not-failure.
Characteristics of TSS for the failure and non-failure cases Figures 10 and 11 show the TSS characteristics dur-ing both the failure and non-failure cases, respect-ively. These TSS graphs are conscripted after the removal of the initial and final data for the failure cases and the initial data for the non-failure cases. Except for sample no. 3, for the failure case, all ex-periments show that TSS increased before the failure of dam crest. The TSS trend lines for the different experiments are presented in Figs. 10 and 11 with equations. From the Fig. 10, it can be understood that the nature of TSS in failure cases increased before the failure but the rate of TSS increment is diverse in different samples. The TSS is high for sample GII, medium for sample GIII and lowers for sample GI. Fine particles, which are in between the coarser grains, are almost free from effective over-burden and capable to migrate by a very low-velocity of seepage flow (Takaji and Yusuke 2008). As sample GII has both the silica sand S4 and S8 in equal per-centage, the TSS is measured higher. An interesting characteristic is noticed for non-failure—that the slope angle of trend line of TSS is nearly same for the GI, GII and GIII samples. It can be concluded that, if the TSS trend line slope is larger and de-creasing, then it could be predicted that a landslide dam would not fail. The velocity of seepage water depends upon the hydraulic gradient. The seepage velocity plays a role in the erosion of soil particles. In this report, when comparing the results of the ex-periments performed, it is found that the higher the value of the hydraulic gradient, higher the TSS value also. The TSS value is higher for the GII and GIII samples than for the GI sample; however, the fine sample with kaolinite has the highest TSS value.
Conclusion
having higher percentage of fine particles, whereas a mass block failure would occur for samples having higher percentage of medium and coarse particle. A dam crest would be stable if its hydraulic gradient becomes constant, which is especially possible for samples having higher percentage of coarse particle. Based on all experiments, it can be concluded that the hydraulic gradient has three stages: 1) it begins to increase and reaches peak value, 2) it begins to decrease from the peak value and reaches the mini-mum value and 3) it begins to increase again when the seepage water starts to come out and the vertical
displacement starts to increase. Dam failures always occur when the seepage water comes out with an in-creasing TSS tendency and an inin-creasing vertical dis-placement while, at the same time, the hydraulic gradient is at its third stage. Experiments with GI, GII and, GIII samples of the non-failed condition show that there would be either no hydraulic gradi-ent increase, no incremgradi-ent in the vertical displace-ment or a decreasing TSS or any two of them. In the field, if we could monitor the seepage water and the vertical displacement, it would be easy to predict potential dam failure.
Appendix
Acknowledgments
The first author would like to express warm gratitude to the Rotary Yoneyama Memorial Foundation and the Izumo South Rotary Club for providing a scholarship for the first author. The authors would also like to thank the anonymous reviewers for reviewing the draft version of the manuscript.
Availability of data and material
The data sets used and analysed during the current study are available from the corresponding author on reasonable request. All data used in this study were produced in the department of Earth science laboratory of Shimane University.
Author’s contributions
DP conducted the laboratory work with close coordination of FW. FW provided guidance and support for data analysis and presentation. DP drafted the manuscript and all authors read and approved the manuscript.
Funding
This study was financially supported by the fund“Initiation and motion mechanisms of long runout landslides due to rainfall and earthquake in the falling pyroclastic deposit slope area”(JSPS-B-19H01980, Principal Investigator: Fawu Wang).
Competing interests
The authors declare that they have no competing interests.
Received: 8 August 2019 Accepted: 7 November 2019
References
Canuti P, Casagli N, Ermini L (1988) Inventory of landslide dam in the northern Apennine as a model for induced flood hazard forecasting. In: Andah K (ed) Managing hydro- geological disaster in a vulnerable environment. Grifo Pub, Perugia, pp 189–202
Cedergren HR (1977) Seepage, drainage, and flow nets. Wiley, New York Costa JE, Schuster RL (1988) The formation and failure of natural dams. Geol Soc
Am Bull 100(7):1054–1068
Ermini L, Casagli N (2003) Prediction of the behavior of landslide dam using a geomorphological dimensionless index. Earth Surf Process Landf 28:31–47 Fell R, Wan CF, Cyganiewicz J, Foster M (2003) Time for development of
internal erosion and piping in embankment dams. J Geotech Geoenviron 129(4):307–314
Fox GA, Wilson GV, Simon A, Langendoen EJ, Akay O, and Fuchs JW (2007) Measuring streambank erosion due to groundwater seepage: correlation to bank pore water pressure, precipitation and stream stage. Earth Surface Processes and Landforms 32(10):1558–73
Fredlund DG, Rahardjo H, Fredlund MD (2012) Unsaturated soil mechanics in engineering practice. Wiley, New York
Jones JAA (1981) The nature of soil piping: a review of research. In: Volume 3 of British Geomorphological Research Group, research monograph series. Geo Books: Norwich
Kourp O, Densmore AL, Schlunegger F (2010) The role of landslide in mountain ranve evolution. Geomorphology 120(1):77–90
Lobkovsky AE, Jensen B, Kudrolli A, Rothman DH (2004) Threshold phenomena in erosion driven by subsurface flow. J Geophys Res Earth Surf 109:F04010. https://doi.org/10.1029/2004JF000172
Nasrabadi T, Ruegner H, Sirdari ZZ, Schwientek M, Grathwohl P (2016) Using total suspended solids (TSS) and turbidity as proxies for evaluation of metal transport in river water. Appl Geochem 68:1–9
Okeke ACU, Wang F (2016a) Critical hydraulic gradients for seepage induced failure of landslide dams. Geoenviron Dis. https://doi.org/10.1186/s40677-016-0043-z
Okeke ACU, Wang F (2016b) Hydromechanical constraints on the piping failure of landslide dams: an experimental investigation. Geoenviron Dis.https://doi. org/10.1186/s40677-016-0038-9
Peng M, Zhan LM (2012) Breaching parameters of landslide dam. Landslides 9: 13–31.https://doi.org/10.1007/s10346-011-0271-y
Richards KS, Reddy KR (2007) Critical appraisal of piping phenomena in earth dams. B Eng Geol Environ 66(4):381–402
Richie JA (1963) Earthwork tunneling and the application of soil testing procedures. J Soil Water Conserv 19:111–129
Rinaldi M, Casagli N (1999) Stability of streambanks formed in partially saturated soils and effects of negative pore-water pressures: the Sieve River (Italy). Geomorphology 26(4):253–277
Rügner H, Schwientek M, Beckingham B, Kuch B, Grathwohl P (2013) Turbidity as a proxy for total suspended solids (TSS) and particle facilitated transport in catchments. Environ Earth Sci 69(2):373–380
Schuster RL, Costa JE (1986) A perspective on landslide dam. In: Shuster RL (ed) Landslide dams: Processes, risk, and mitigation. Proceedings of a session in conjunction with the ASCE convention. ASCE (Geotechnical Special Publ n 3), New York, pp 1–20
Schwarz K, Gocht T, Grathwohl P (2011) Transport of polycyclic aromatic hydrocarbons in highly vulnerable karst systems. Environ Pollut 159:133–139 Storm A (2013) Geological prerequisites for landslide dams’disaster assessment
and mitigation in central Asia. In: Wang F, Miyajima M, Li T, Shan W, Fathani T (eds) Progress of geo-disaster mitigation technology in Asia. Environmental Science and Engineering (Environmental Engineering). Springer, Berlin, pp 17–53
Stubblefield AP, Reuter JE, Dahlgren RA, Goldman CR (2007) Use of turbidometry to characterize suspended sediment and phosphorus fluxes in the Lake Tahoe basin, California, USA. Hydrol Process 21:281–291.https://doi.org/10. 1002/hyp.6234
Tacconi C, Vilímek V, Emmer A, Catani F (2018) Morphological analysis and features of the landslide dams in the cordillera Blanca. Landslides 15(3): 507–521
Takaji K, Yusuke F (2008) Effect of particle gradation on seepage failure in granular soils. In: Sekiguchi H (ed) Proceedings of the 4th international conference on scour and erosion (ICSE-4), November 5–7, 2008. The Japanese Geotechnical Society, Tokyo, pp 497–504
Terzaghi K, Peck RB, Mesri G (1996) Soil Mechanics in Engineering Practice (third ed.), John Wiley and Sons, INC.
Wang WF, Dai Z, Okeke CAU, Mitani Y, Yang H (2018) Experimental study to identify premonitory factors of landslide dam failures. Eng Geol 232:123–134 Wilson GV, Periketi RK, Fox GA, Dabney SM, Shields FD, Cullum RF (2007) Soil
properties controlling seepage erosion contributions to streambank failure. Earth Surf Process Landf 32(3):447–459
Publisher’s Note