O R I G I N A L R E S E A R C H
Open Access
CADA
—
computer-aided DaTSCAN analysis
Antonio Augimeri
1, Andrea Cherubini
1*, Giuseppe Lucio Cascini
2, Domenico Galea
2, Maria Eugenia Caligiuri
1,
Gaetano Barbagallo
3, Gennarina Arabia
3and Aldo Quattrone
1,3* Correspondence:
1Institute of Molecular Bioimaging
and Physiology of the National Research Council (IBFM-CNR), Catanzaro, Italy
Full list of author information is available at the end of the article
Abstract
Background:Dopamine transporter (DaT) imaging (DaTSCAN) is useful for the differential diagnosis of parkinsonian syndromes. Visual evaluation of DaTSCAN images represents the generally accepted diagnostic method, but it is strongly dependent on the observer’s experience and shows inter- and intra-observer variability. A reliable and automatic method for DaTSCAN evaluation can provide objective quantification; it is desirable for longitudinal studies, and it allows for a better follow-up control. Moreover, it is crucial for an automated method to produce coherent measures related to the severity of motor symptoms.
Methods:In this work, we propose a novel fully automated technique for DaTSCAN analysis that generates quantitative measures based on striatal intensity, shape, symmetry and extent. We tested these measures using a support vector machine (SVM) classifier.
Results:The proposed measures reached 100 % accuracy in distinguishing between patients with Parkinson’s disease (PD) and control subjects. We also demonstrate the existence of a linear relationship and an exponential trend between pooled structural and functional striatal characteristics and the Unified Parkinson’s disease Rating Scale (UPDRS) motor score.
Conclusions:We present a novel, highly reproducible, user-independent technique for DaTSCAN analysis producing quantitative measures directly connected to striatum uptake and shape. In our method, no a priori assumption is required on the spatial conformation and localization of striatum, and both uptake and symmetry contribute to the index quantification. These measures can reliably support a computer-assisted decision system.
Keywords:Parkinson’s disease, DaTSCAN, Computer-aided diagnosis
Background
Parkinsonian syndromes include neurological disorders characterized by common clin-ical features such as rigidity, bradykinesia, resting tremor and postural instability [1]. The most frequent cause of parkinsonian symptoms is Parkinson’s disease (PD), a de-generative pathology of the central nervous system due to progressive degeneration of dopaminergic neurons in the substantia nigra, which in turn results in a loss of dopa-mine transporters (DaT) in the striatum [2–4].
Imaging the integrity of the nigrostriatal dopaminergic pathway can improve the accuracy of diagnosis in movement disorders and optimize the therapeutic
approach [5, 6], especially when dealing with parkinsonian syndromes that respond differently to medications.
Single-photon emission computed tomography (SPECT) provides a valuable tool for dopamine neurotransmission visualization both at the pre-synaptic and post-synaptic levels by means of several tracers [7, 8]. In particular, SPECT imaging with 123 I-ioflu-pane (123I-FP-CIT, DaTSCAN, GE Healthcare) provides an accurate in vivo marker of the nigrostriatal dopamine terminals, and it is currently one of the most used DaT probes [9–11].123I-FP-CIT is a pre-synaptic radiopharmaceutical of the DaT presenting a significant uptake decrease in basal ganglia of PD subjects [9] and the most widely used tracer for pre-synaptic evaluations in both Europe and the USA [12]. The utility of this tracer for pre-synaptic evaluations has also been shown in the differential diag-nosis between essential tremor (ET) and idiopathic parkinsonism [13–15].
Visual interpretation of DaTSCAN images according to available qualitative assess-ment criteria [10] has traditionally been used for the diagnosis of parkinsonian symp-toms. However, this approach is rater-dependent and prone to errors, since it relies on gross changes in striatal DaT density. For this reason, several methods for quantitative or semi-quantitative DaTSCAN evaluation have been proposed as a valuable tool for obtaining reproducible diagnostic outcomes and for follow-up in longitudinal studies [10, 16].
Semi-quantitative measures for striatal tracer uptake quantification are defined as ra-tios between the striatal radiopharmaceutical-specific uptake and the non-specific up-take in an area of low DaT density, usually the occipital cortex. The calculation of such quantities requires manual positioning of regions of interest (ROIs) on the SPECT image by a highly experienced operator, which makes the procedure time-consuming and hampered by a considerable intra- and inter-operator variability [17, 18]. In order to reduce analysis time, pre-defined ROIs are also used; but this approach can also be highly arbitrary, especially in case of low striatal uptake [10, 19]. To face this issue, free and commercial software packages [20, 21] have been developed that provide automatic and semi-automatic placing of ROIs. The Brain Registration & Analysis Software Suite (BRASS, Hermes Medical, SE), can automatically quantify tracer uptake in the striatum of each hemisphere and in different subregions [22]. BRASS fits the patient data onto a template containing a set of pre-defined ROIs and calculates the specific binding ratio (SBR) in the whole striatum, the caudate nucleus and the putamen. A very similar ap-proach is used in two other commercial software packages: EXINI dat (EXINI Diagnos-tic, SE) and DaTQUANT (GE Healthcare). All these commercial products also return information about binding in striatal subregions deriving the caudate-to-putamen up-take ratio that can evaluate the amount of degeneration in the early stage of disease. These methods have shown similar accuracy when compared to manual delineation [23] but often consider only a few 2D slices for uptake quantification and do not pro-vide measurements directly based on the shape of the uptake regions.
thresholding approach, but further reduced the number of voxels to include in the ana-lysis by using a combination of statistical tests and data reduction techniques. Subse-quently, the reduced set of voxels was fed into a supervised classifier. None of these methods introduced shape features in the analysis pipeline.
Indeed, shape and asymmetry information about the basal ganglia can be useful not only in PD diagnosis, where striatal damage at the onset presents unilaterally and then spreads to the contralateral structure, but also in differential diagnosis between PD and other parkinsonian syndromes, in which damage could be present in specific spatial patterns.
Furthermore, only one study [20] has assessed the correlation between automatically extracted imaging measures and symptom severity. The lack of this kind of information represents a limitation when validating a diagnostic index, since the presence of a rela-tionship between striatal uptake and clinical symptoms has been demonstrated by sev-eral authors [28, 29] and is crucial for the development of an objective marker of disease severity to help understand and monitor disease onset, severity and progression.
For all these reasons, we propose a novel fully automated technique to analyse DaT-SPECT images in a 3D fashion. The aim is twofold: (1) to extract relevant quantitative measures and features based on striatal intensity, shape and symmetry and (2) to dem-onstrate that the use of multimodal information on structural and functional integrity of the striatum may lead to high correlation with clinical measures, thus representing a robust marker of disease progression. To test the discriminating power of selected mea-sures, we built a support vector machine (SVM) classifier and evaluated its accuracy in distinguishing patients with PD from healthy subjects. We also compared the perform-ance of our method with standard qualitative and semi-quantitative assessments.
Methods
Thirty-one patients with a diagnosis of probable PD (Group I, 18 M/13 F) and 12 age-and sex-matched healthy controls (Group II, 5 M/7 F) underwent DaTSCAN imaging. Demographic and clinical characteristics of the patients and controls are listed in Table 1. Patients with PD diagnosis fulfilled the UK Parkinson’s Disease Society Brain Bank criteria [30], and their clinical diagnoses were confirmed 2 years after the SPECT data acquisition. An expert with years of experience in movement disorders performed neurological examinations and clinical assessments on all patients using the Unified Parkinson’s Disease Rating Scale Motor Examination (UPDRS-ME) [31] and the Hoehn
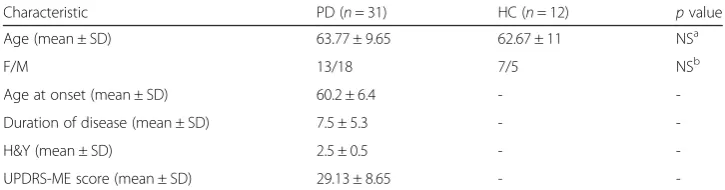
Table 1Demographic and clinical features in PD and HC participants
Characteristic PD (n= 31) HC (n= 12) pvalue
Age (mean ± SD) 63.77 ± 9.65 62.67 ± 11 NSa
F/M 13/18 7/5 NSb
Age at onset (mean ± SD) 60.2 ± 6.4 -
-Duration of disease (mean ± SD) 7.5 ± 5.3 -
-H&Y (mean ± SD) 2.5 ± 0.5 -
-UPDRS-ME score (mean ± SD) 29.13 ± 8.65 -
-SDstandard deviation,NSnon-significant,UPDRS-MEUnified Parkinson’s Disease Rating Scale Motor Examination
a
Thispvalue was determined using an unpairedttest
b
Thispvalue was determined usingχ2
and Yahr (H&Y) rating scale [32] in an off phase (off medications overnight). No pa-tient had any history of other neurological diseases other than PD. Structural magnetic resonance imaging (MRI) excluded the presence of vascular lesions, brain tumours or other abnormalities. The Institutional Ethics Committee of Magna Graecia University (Catanzaro, Italy) approved the study, and all subjects gave written informed consent.
Brain imaging was performed 3 h after the administration of 200 MBq of123I-FP-CIT (GE-Amersham, Eindhoven, The Netherlands) using a dual-headed gamma camera (Infinia Hawkeye, General Electric, Milwaukee, WI) equipped with a low-energy, high-resolution collimator (SPECT). Scans were acquired with a photopeak window centred around 159 KeV ± 10 % with a 128 × 128 image matrix (zoom factor, 1.5, 40 s per view and 2 × 64 views). The slice thickness was 2.95 mm. Images were reconstructed using a Butterworth filter (with a cut-off of 0.5 and an order of 6). Chang’s correction method was used to compensate for attenuation using a coefficient,μ, of 0.11 cm−1.
Three different experts with several years of experience diagnosing movement disor-ders according to the criteria described in [10] carried out the qualitative visual assess-ment of the DaTSCAN images. Semi-quantitative analysis was performed selecting three consecutive slices with the highest striatal uptakes. ROIs with fixed sizes were manually positioned over the left and right striatum, and a third ROI in the occipital cortex was used as reference region. Left and right striatal uptake was quantified separ-ately. For each striatum, specific binding ratio (SBR) was calculated as follows:
SBRStr ¼CStr−COcc
COcc ; ð1Þ
whereCStr andCOccare, respectively, the mean count of voxels in the striatal ROI and the mean count of voxels in the occipital ROI. Nuclear medicine experts blinded to the clinical data performed the procedure.
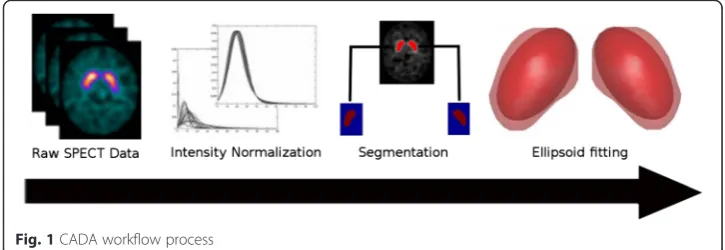
The automatic analysis of SPECT volumes consisted of five main steps. Figure 1 shows the entire process. First, we spatially registered and intensity normalized the raw images. In the second phase, we employed a segmentation routine to extract two binary masks corresponding to the left and right striata. Subsequently, we fitted an ellipsoid surface on each mask using a non-linear optimization algorithm. We then used the el-lipsoid space to extract a set of features characterizing the basal ganglia. Finally, we put the resulting parameters into a SVM classifier. All stages are discussed in detail in the following subsections.
Pre-processing
The pre-processing procedure involved two steps. First, we spatially normalized the SPECT images using the FSL-FLIRT tool (Functional Magnetic Resonance Imaging Software Library, Oxford University, UK [33, 34]) in order to ensure that the same voxel refers to the same anatomical position across different volumes. We registered each image to an average image of the control subjects’group. Since our method does not require a perfect voxel-by-voxel correspondence, but only an overall common pos-ition of each subject, we used a six-degrees-of-freedom linear affine transform that pre-vents deformation of the images. During this step, we obtained a template image (T) by averaging all the co-registered images from the control group. To get a symmetric tem-plate, we averaged T with its hemisphere mid-plane reflection. To allow for appropriate comparison of uptake values across subjects, we performed a second pre-processing step in which the images were intensity normalized. We employed linear intensity normalization according to the method described in [35]. The intensity histogram in a SPECT brain image can be fit using a positively skewed α-stable distribution. Such a distribution is a generalized case of Gaussian distribution and can be controlled by four parameters: α, β, γ and μ, which, respectively, describe impulsiveness, skewness, con-centration of samples along the bulk (dispersion) and distribution shift on the x-axis (position). By calculating theα-stable parameters for each image histogrami, it is pos-sible to adjust all dispersionsγiand locationμiso that they have similar values. This is done by calculating γ* and μ* as the mean values of the γi andμi parameters and by using the following normalization equation:
Y ¼aiX−bi; ð2Þ
wherea¼γγi, andb¼μ−γ γiμ:
Segmentation
We employed a segmentation method based upon a Gaussian mixture model (GMM) to identify regions of high uptake on each subject [36]. The application of GMM relies on the assumption that the intensity value at each voxel in an observed image is sam-pled from a Gaussian mixture distribution. We assume that all voxels in the image be-long to either a high uptake region (striatum) or a low uptake region. In the model, we describe each voxel as a d-dimensional (d= 4) data vector x containing its intensity value and spatial coordinates. The resulting GMM is a weighted sum of two Gaussian densities given by the equation
p xð jλÞ ¼XMi¼1ωiN xð jμi;ΣiÞ; ð3Þ
whereωi,i= 1,…,M are the mixture weights andN(x|μi,Σi),i= 1,…,Mare the
Gauss-ian component densities. Each component density is a four-variate GaussGauss-ian function of the form,
N xð jμi;ΣiÞ ¼
1 2π
ð Þd=2Σ
i
j j1=2 exp − 1 2ðx−μiÞ
0Σ−1 x−μ
i
ð Þ
; ð4Þ
with mean vector μi and covariance matrix Σi. The mixture weights satisfy the
all component densities parameterized the complete model. These parameters are col-lectively represented by the notation
λ¼fωi;μi;Σig;i¼1;…;M ð5Þ
The expectation-maximization method estimates the mixture parameters [37]. In our implementation, we assumed two Gaussian components. Once the expectation-maximization method has converged, a complete set of parameters are returned and used to compose two distribution functions. These functions are considered probabilis-tic approximations of how the voxels are partitioned in the image. Thus, the function corresponding to the highest uptake value will better describe the voxels in the stri-atum. Formally, we carried out the segmentation by assigning each voxel to the proper cluster according to principle of the maximum-likelihood estimation. The jth element is labelledLjaccording to the following equation
Lj¼ max i
exp −1 2 xj−μ
i
Σ
i
−1
xj−μi
0
Σ
i
1=2 ; ð6Þ
where x is the input data and μ* and Σ* are the two estimated mixture parameters. Since the segmentation method is completely unsupervised and not input-dependent, the two resulting distributions will be slightly different from subject to subject in terms of count rate, thus avoiding the need to specify a priori information or threshold values that could be subject-specific or scanner-specific.
Ellipsoid fitting
The segmentation step produces a 3D binary mask per side of the brain; each mask de-limits a region of high uptake and can extract quantitative measures in terms of peak and mean uptake but is not suitable to determine spatial features such as shape, orien-tation and position of each striatum. To evaluate striatal spatial features in a reprodu-cible manner, we approximated the set of data points in each mask to an ellipsoid and then derived the metrics of interest from the fit. The fitting procedure minimizes the sum of squares of the distances between the data points and the ellipsoid surface by solving a non-linear optimization problem.
Formally, given a set of points,
Xi
f gm
i¼1;m>3;ðX−UÞTRTD R Xð −UÞ ¼1;
whereU is the ellipsoid centre, R is an orthonormal matrix representing the ellipsoid orientation and Dis a diagonal matrix whose diagonal entries represent the reciprocal of the squares of the half-lengths of the ellipsoid axes; the fit is obtained by minimizing the following energy function:
EðU;R;DÞ ¼Xmi¼1ðLi−rÞ2; ð7Þ
whereLiis the distance from the pointXito the ellipsoid.
Features extraction
values in a ROI defined by the fitted ellipsoid, which can be interpreted in the same way as the SBR in the semi-quantitative approach; the larger the MEU, the higher the uptake. We instead obtained the DI by comparing the orientation of each striatum with the orientation of the corresponding striatum segmented from the average template image (See Additional file 1). To do this, instead of comparing the nuclei directly, we use the relative ellipsoids. The fitted ellipsoid is a good approximation of the striatum. When the shape of the striatum changes as result of the diseases, it has an impact on the ellipsoid and its orientation. The ellipsoid orientation is defined through the eigen-vectors; thus, the problem of comparing two ellipsoids can be solved by comparing the corresponding eigenvectors. By calculating the absolute value of the dot product be-tween each eigenvector from the template and the corresponding eigenvector from the subject’s striatum, we obtained a tern of values included in the interval (0, 1). Each value in the tern is a measure of the nucleus alignment in the corresponding direction. Finally, we calculated DI by multiplying all the values in the tern and subtracting the result from one as follows:
DI¼1−Y3i¼ 1 E
S i⋅ETi
ð8Þ
whereEiS andEiTare the ith ellipsoid subject eigenvector and theith ellipsoid template eigenvector, respectively.
When the striatum has the characteristic“comma-shape”, the ellipsoid fitted on it re-tains a very similar orientation to the template ellipsoid. All the quantities in the tern will be very close to one and then DI will be close to zero, indicating a non-significant change in the striatum shape. On the contrary, when the ellipsoid is fitted on a dam-aged nucleus, it is expected to be warped and with a different orientation with respect to the template. So one or more values in the tern will be close to zero and DI will be close to one, indicating a high degree of dysmorphism.
Classification
To investigate the discriminating power of the extracted measures, we built different SVM classifiers to distinguish PD patients from control subjects and trained each clas-sifier using a different dataset of measures. Overall, we tested four configurations:
Experiment I: the feature vector is composed by left and right MEU values
Experiment II: the feature vector contains left and right DI values
Experiment III: the feature vector contains all four measures exploited in Experiments I and II
Experiment IV: the feature vector consists of two items corresponding to MEU and DI of each side merged according to the following formula to obtain a shape-modulated uptake (SMU):
SMU¼MEUð1−DIÞ ð9Þ
To find out whether the method is useful in decision support, we asked an expert neurologist, blinded to the clinical data, to separate PD patients from control subjects only based on the DaTSCAN qualitative assessment; his classification accuracy was cal-culated and compared to the other two approaches.
We used the LIBSVM software library [38] to perform all SVM analyses.
Correlation with motor symptoms
Since it is very important, for any quantitative marker of damage, to reflect the progres-sion of disease symptoms, we explored the relationship between our composite measure SMU and the UPDRS-ME scores from the PD group. We performed a first-correlation analysis without considering the symptom lateralization; we correlated the UPDRS-ME score with the SMU value averaged over both hemispheres. In a second analysis, we split the UPDRS-ME score in the left and right subsections; for each patient, we selected the most affected side (UPDRS-ME-MAS) and correlated it with the contralateral SMU measure (SMU-MAS). Moreover, we investigated the relationship of the SMU measure with the diseases duration and the disease stage using the H&Y rating scale.
We performed all analyses by fitting linear and exponential regression models to the data and calculating the Spearman rank correlation coefficient.
Results
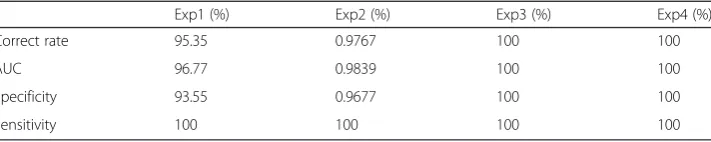
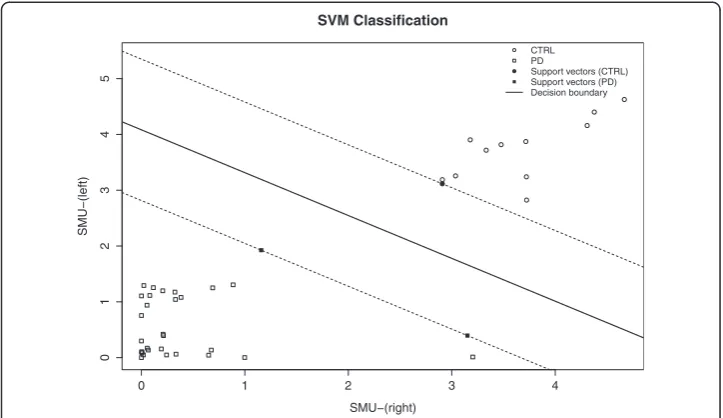
We tested the proposed methodology on 43 different SPECT images. We considered segmentation of the basal ganglia to be successful in all cases after visual inspection of the ROIs. We performed ellipsoid fitting on the masks without errors in all subjects. Table 2 shows the classification rates for each SVM model. Figure 2 shows the SVM outcome from Experiment IV. We used right SMU values on the x-axis and left SMU values on they-axis to plot the subjects.
Table 3 shows a comparison between our method and more traditional procedures. The proposed methodology outperformed both visual and semi-quantitative assess-ments that, respectively, achieved accuracies of 97 % (sensitivity 96 %, specificity 100 %) and 95 % (sensitivity 100 %, specificity 83 %). The quantification values obtained by our method showed a good correlation with the UPDRS-ME score (off medication). SMU, averaged over both sides, showed significant negative correlation with the clinical variable (rs=−0.55,p< 0.01). We observed a comparable relationship in the correlation analyses between the UPDRS-ME-MAS scores and our combined measures. SMU-MAS showed a significant negative correlation with the motor score (rs=−0.51,p< 0.005). Figure 3 shows both the linear and exponential fits on the scatter plot of our composite measure (SMU) versus the UPDRS motor score. The linear model (R2adj= 0.26, p< 0.01)
Table 2Classification accuracy of the different models
Exp1 (%) Exp2 (%) Exp3 (%) Exp4 (%)
Correct rate 95.35 0.9767 100 100
AUC 96.77 0.9839 100 100
Specificity 93.55 0.9677 100 100
Sensitivity 100 100 100 100
showed a slightly better fit than the exponential one (R2adj= 0.22,p< 0.01), but both results had the same statistical significance.
No significant correlation was neither found between SMU and the H&Y rating scale, nor between SMU and disease duration.
Discussion
In this work, we present a novel methodology to process DaTSCAN images. Our aim is not only to obtain a fully automated method able to replicate all essential steps of DaTS-CAN analysis, but also to extract a quantitative measure coherently associated with the severity of the symptoms. The proposed method enables the extraction of reproducible measures using the whole SPECT volume and directly connects to striatum uptake and shape. The automated process eliminates the issue of intra- or inter-observer variability. No other imaging data, such as MRI or computed tomography (CT), is needed to perform the analyses. The best results are obtained by providing the classifier both extracted mea-sures, MEU and DI, either merged in a single value or not. Both configurations are able to split subjects without classification errors. Experiments I and II also show high accuracy; this suggests that individual parameters are quite robust. However, best performance exploiting all parameters together suggests the need to provide the classifier with not only intensity/uptake data, but also shape and symmetry features.
Existing semi-quantitative measures of striatal uptake have shown good correlation with UPDRS-ME scores [28, 29]. Moreover, this result seems quite robust, even in the presence of confounding factors such as the assumption of PD medications. Despite
Fig. 2SVM Classiefier results (Experiment 4): scatter plot and hiperplane
Table 3Accuracy comparison between CADA, visual assessment and semi-quantitative assessment Assessment method Sensitivity (%) Specificity (%) Accuracy (%)
Visuala 96 100 97
Semi-quantitativeb 100 83 95
CADA 100 100 100
a
Performed by an expert neurologist with years of experience in the field of movement disorders
b
the importance of such a relationship in the context of finding a robust marker of dis-ease progression, most studies describing automated DaTSCAN analysis methods do not address the correlation between quantitative measures and clinical scales. Two studies, [20] and [21], are exceptions; the authors reported significant linear relation-ships between uptake measurements (obtained with BasGan software and Neurostat software, respectively) and the UPDRS-ME score. Our data confirm the association be-tween DaT uptake in striata and motor symptoms, which is consistent with the hypoth-esis that motor symptoms in PD are related to dopaminergic nigrostriatal pathology [39]. In addition, we also found that a more accurate description of such relationship could be described through an exponential trend, suggesting some sort of saturation ef-fect when the striatum reaches a minimum uptake/dysmorphism value while motor disability continues its progression. This effect could be explained in the advanced stages of PD where the disability progression is related to the severity and extent of extra-nigral degeneration. Moreover, while previous studies employed semi-quantitative measures of mean uptake alone, we were able to confirm the existence of a link be-tween motor symptom severity and a composite index, integrating structural (shape) and functional (uptake) information. Overall, this result suggests that multimodal infor-mation extracted from DaTSCAN images may provide further insight into the patho-physiology of parkinsonian syndromes.
Unlike what emerged for the UPDRS-ME, neither of our correlation analyses revealed that neither stage nor disease duration are significantly related to our striatum SPECT measures. A possible explanation of this finding could be the sensitivity of the proposed index to the striatum shape alteration. In fact, the index tends to show a low value, even at the first signs of injury in the putamen, and then quickly levels off. This is con-sistent with the usual DaT concentration reduction rate, which is faster in the early stages of the disease than in the later stages [28] but can prevent the index from cor-rectly following the disease progression as measured by other clinical features. More-over, the cross-sectional design and then the spread of data caused by inter-individual
differences may have reduced the effectiveness of the correlation. A longitudinal study would better clarify this aspect.
The diagnostic process of PD is not the only scenario that would benefit from the use of reliable, semi-quantitative measures of striatal function, shape and asymmetry, such as those we extracted from DaTSCAN. In fact, our tool could provide a benefit in the diag-nostic workup of parkinsonian syndromes and help ameliorate a differential diagnosis from PD in the early stages of the disease or monitor neuroprotective treatments.
It is worth noting that the selected features (MEU and DI) are optimized to the specific clinical setting, i.e. the diagnosis of parkinsonian syndromes. Generally, in patients with PD, the disease progression follows a common pattern; DaT concentration starts to de-crease in the putamen contralateral to the clinical symptoms and then progresses to the caudate. When this happens, the striatum loses its characteristic comma-shape on DaTS-CAN and tends to become dot-shaped or disappears altogether. In cases of low binding, “forcing” a pre-defined ROI into a comma-shape may bias a semi-quantitative measure, resulting in a SBR that still reaches high values, but that reflects caudate binding only, thus not taking into account putaminal dysfunction. Instead, in our method, striatum changes due to decreased DaT density are observed from different points of view; MEU takes into account uptake changes, while DI detects dysmorphism in the ROI upon which this value is calculated. For what concerns nuclei asymmetry, we did not directly provide any asymmetry measures to any SVM model; we intrinsically introduced asymmetry in-formation into the model since we calculated each parameter on both sides. Both MEU and DI features can be used to derive asymmetry measures.
Although our method has proven to be reliable, we should mention a limitation. To test the method on well-established data, we selected a PD group with a relatively ad-vanced stage of disease; this does not allow clear evaluation of the accuracy of the pro-posed method in the classification of earlier stages of the disease. As a future work, we intend to select a group of de novo patients that we will follow longitudinally to test this aspect on those with a confirmed PD diagnosis.
Conclusions
We describe a novel computer-aided diagnosis method for DaTSCAN images. Regions of high uptake are automatically identified from three-dimensional images. The high accuracy obtained by the SVM classifier suggests that the segmentation routine is ro-bust and that the selected parameters well describe the striatum in terms of uptake values, shape and symmetry. Moreover, our measures show high correlation with UPDRS motor score. The comparison with standard qualitative and semi-quantitative techniques suggests that a system based on this method can provide reliable support to the diagnostic process.
Ethics approval and consent to participate Ethical approval
Consent to participate
Informed consent to participate was obtained from all individual participants included in the study.
Consent for publication
Informed consent to publish was obtained from all individual participants included in the study.
Additional file
Additional file 1: Dysmorphic Index calculation by comparing ellipsoids orientation.(PNG 107 kb)
Abbreviations
BRASS:Brain Registration and Analysis Software Suite; CT: computed tomography; DaT: dopamine transporter; DI: dysmorphic index; ET: essential tremor; GMM: Gaussian mixture model; H&Y: Hoehn and Yahr (rating scale); MEU: mean ellipsoid uptake; MRI: magnetic resonance image; PD: Parkinson’s disease; ROI: region of interest; SBR: specific binding ratio; SMU: shape-modulated uptake; SPECT: single-photon emission computed tomography; SVM: support vector machine; UPDRS: Unified Parkinson’s Disease Rating Scale; UPDRS-ME: Unified Parkinson’s Disease Rating Scale Motor Examination.
Competing interests
The authors declare that they have no conflict of interest.
Authors’contributions
AA participated in the design of the study, carried out the implementation of the software, performed the statistical analysis and drafted the manuscript. AC conceived the study, supervised the analysis and critically reviewed the manuscript. GLC contributed to the project organization and supervised the data acquisition. DG gave technical support and helped collect data. MEC performed statistical analysis and helped write the paper. AG and GB performed the clinical evaluations and collected and helped interpret the data. AQ participated in the study design, supervised the research project organization and critically reviewed the manuscript. All authors read and approved the final manuscript.
Funding
This study was not supported by any financial sources.
Author details 1
Institute of Molecular Bioimaging and Physiology of the National Research Council (IBFM-CNR), Catanzaro, Italy.
2Institute of Radiology, Nuclear Medicine Unit, University Magna Graecia, Catanzaro, Italy.3Institute of Neurology,
University Magna Graecia, Catanzaro, Italy.
Received: 16 September 2015 Accepted: 4 February 2016
References
1. Jankovic J. Parkinson’s disease: clinical features and diagnosis. J Neurol Neurosurg Psychiatry. 2008;79(4):368–76. 2. Bernheimer H, Birkmayer W, Hornykiewicz O, Jellinger K, Seitelberger F. Brain dopamine and the syndromes of
Parkinson and Huntington clinical, morphological and neurochemical correlations. J Neurol Sci. 1973;20(4):415–55. 3. Kaufman MJ, Madras BK. Severe depletion of cocaine recognition sites associated with the dopamine transporter
in Parkinson’s-diseased striatum. Synapse. 1991;9(1):43–9.
4. Innis RB, Seibyl JP, Scanley BE, Laruelle M, Abi-Dargham A, Wallace E, et al. Single photon emission computed tomographic imaging demonstrates loss of striatal dopamine transporters in Parkinson disease. Proc Natl Acad Sci. 1993;90(24):11965–9.
5. Bhidayasiri R. How useful is (123I) beta-CIT SPECT in the diagnosis of Parkinson’s disease? Rev Neurol Dis. 2006;3(1):19–22.
6. Marshall V, Grosset D. Role of dopamine transporter imaging in routine clinical practice. Mov Disord. 2003;18(12):1415–23.
7. Kung H, Kim HJ, Kung MP, Meegalla S, Plössl K, Lee HK. Imaging of dopamine transporters in humans with technetium-99 m TRODAT 1. Eur J Nucl Med. 1996;23(11):1527–30.
8. Koch W, Hamann C, Radau P, Tatsch K. Does combined imaging of the pre- and postsynaptic dopaminergic system increase the diagnostic accuracy in the differential diagnosis of parkinsonism? Eur J Nucl Med Mol Imaging. 2007;34(8):1265–73.
9. Djang DSW, Janssen MJR, Bohnen N, Booij J, Henderson TA, Herholz K, et al. SNM practice guideline for dopamine transporter imaging with 123I-Ioflupane SPECT 1.0. J Nucl Med. 2012;53(1):154–63.
11. Wang L, Zhang Q, Li H, Zhang H. SPECT Molecular Imaging in Parkinson’s Disease. J Biomed Biotechnol. 2012; 2012:412486.
12. Skanjeti A, Castellano G, Elia BO, Zotta M, Dazzara F, Manfredi M, et al. Multicenter semiquantitative evaluation of (123) I-FP-CIT brain SPECT. J Neuroimaging. 2015;25:1023–9.
13. Asenbaum S, Pirker W, Angelberger P, Bencsits G, Pruckmayer M, Brücke T. [123I]β-CIT and SPECT in essential tremor and Parkinson’s disease. J Neural Transm. 1998;105(10–12):1213–28.
14. Benamer HTS, Patterson J, Grosset DG, Booij J, de Bruin K, van Royen E, et al. Accurate differentiation of parkinsonism and essential tremor using visual assessment of [123I]-FP-CIT SPECT imaging: The [123I]-FP-CIT study group. Mov Disord. 2000;15(3):503–10.
15. Gerasimou G, Tsolaki M, Bostanjopoulou S, Liaros G, Papanastasiou E, Balaris V, et al. Findings from molecular imaging with SPET camera and 123I-ioflupane in the differential diagnosis of Parkinsonism and essential tremor. Hell J Nucl Med. 2005;8(2):81–5.
16. Kupsch AR, Bajaj N, Weiland F, Tartaglione A, Klutmann S, Buitendyk M, et al. Impact of DaTscan SPECT imaging on clinical management, diagnosis, confidence of diagnosis, quality of life, health resource use and safety in patients with clinically uncertain parkinsonian syndromes: a prospective 1-year follow-up of an open-label controlled study. J Neurol Neurosurg Psychiatry. 2012;83(6):620–8.
17. Badiavas K, Molyvda E, Iakovou I, Tsolaki M, Psarrakos K, Karatzas N. SPECT imaging evaluation in movement disorders: far beyond visual assessment. Eur J Nucl Med Mol Imaging. 2011;38(4):764–73.
18. Gallego J, Ninerola-Baizán A, Cot A, Aguiar P, Crespo C, Falcón C, et al. Validation of semi-quantitative methods for DAT SPECT: influence of anatomical variability and partial volume effect. Phys Med Biol. 2015;60(15):5925. 19. Tossici-Bolt L, Hoffmann SA, Kemp P, Mehta R, Fleming J. Quantification of [123I]FP-CIT SPECT brain images: an
accurate technique for measurement of the specific binding ratio. Eur J Nucl Med Mol Imaging. 2006;33(12):1491–9. 20. Calvini P, Rodriguez G, Inguglia F, Mignone A, Guerra U, Nobili F. The basal ganglia matching tools package for
striatal uptake semi-quantification: description and validation. Eur J Nucl Med Mol Imaging. 2007;34(8):1240–53. 21. Takada S, Yoshimura M, Shindo H, Saito K, Koizumi K, Utsumi H, et al. New semiquantitative assessment
of123I-FP-CIT by an anatomical standardization method. Ann Nucl Med. 2006;20(7):477–84.
22. Koch W, Radau PE, Hamann C, Tatsch K. Clinical testing of an optimized software solution for an automated, observer-independent evaluation of dopamine transporter SPECT studies. J Nucl Med. 2005;46(7):1109–18. 23. Ziebell M, Pinborg LH, Thomsen G, de Nijs R, Svarer C, Wagner A, et al. MRI-guided region-of-interest delineation
is comparable to manual delineation in dopamine transporter SPECT quantification in patients: a reproducibility study. J Nucl Med Technol. 2010;38(2):61–8.
24. Mirzaei S, Zakavi R, Rodrigues M, Schwarzgruber T, Brücke T, Bakala J, et al. Fully automated 3D basal ganglia activity measurement in dopamine transporter scintigraphy (Spectalyzer). Ann Nucl Med. 2010;24(4):295–300. 25. Illán IA, Górriz JM, Ramírez J, Lang EW, Salas-Gonzalez D, Puntonet CG. Bilateral symmetry aspects in
computer-aided Alzheimer’s disease diagnosis by single-photon emission-computed tomography imaging. Artif Intell Med. 2012;56(3):191–8.
26. Segovia F, Gorriz JM, Ramirez J, Alvarez I, Jimenez-Hoyuela JM, Ortega SJ. Improved parkinsonism diagnosis using a partial least squares based approach. Med Phys. 2012;39(7):4395–403.
27. Martinez-Murcia FJ, Górriz JM, Ramírez J, Moreno-Caballero M, Gómez-Río M. Parametrization of textural patterns in 123I-ioflupane imaging for the automatic detection of parkinsonism. Med. Phys. 2014;41(1):012502. 28. Benamer HT, Patterson J, Wyper DJ, Hadley DM, Macphee GJ, Grosset DG. Correlation of Parkinson’s disease
severity and duration with 123I-FP-CIT SPECT striatal uptake. Mov Disord. 2000;15(4):692–8.
29. Pirker W. Correlation of dopamine transporter imaging with parkinsonian motor handicap: how close is it? Mov. Disord. 2003;18:S43–S51.
30. Hughes AJ, Daniel SE, Kilford L. Lees aJ. Accuracy of clinical diagnosis of idiopathic Parkinson’s disease: a clinico-pathological study of 100 cases. J Neurol Neurosurg Psychiatry. 1992;55(3):181–4.
31. Goetz CG, Fahn S, Martinez-Martin P, Poewe W, Sampaio C, Stebbins GT, et al. Movement Disorder Society-sponsored revision of the Unified Parkinson’s Disease Rating Scale (MDS-UPDRS): process, format, and clinimetric testing plan. Mov Disord. 2007;22(1):41–7.
32. Goetz CG, Poewe W, Rascol O, Sampaio C, Stebbins GT, Counsell C, et al. Movement Disorder Society Task Force report on the Hoehn and Yahr staging scale: status and recommendations. The Movement Disorder Society Task Force on rating scales for Parkinson’s disease. Mov Disord. 2004;19(9):1020–8.
33. Jenkinson M, Bannister P, Brady M, Smith S. Improved optimization for the robust and accurate linear registration and motion correction of brain images. Neuroimage. 2002;17(2):825–41.
34. Jenkinson M, Smith S. A global optimisation method for robust affine registration of brain images. Med Image Anal. 2001;5(2):143–56.
35. Salas-Gonzalez D, Górriz JM, Ramírez J. Illán Ia, Lang EW. Linear intensity normalization of FP-CIT SPECT brain images using theα-stable distribution. NeuroImage. 2013;65:449–55.
36. Balafar MA. Gaussian mixture model based segmentation methods for brain MRI images. Artif. Intell. Rev. 2014; 41(3):429–439.
37. Hartley HO. Maximum likelihood estimation from incomplete data. Biometrics. 1958;14(2):174–94.
38. Chang CC, Lin CJ. LIBSVM: A library for support vector machines. ACM Trans. Intell. Syst. Technol. 2011;2:27:1–27:27. 39. Piggott MA, Marshall EF, Thomas N, et al. Striatal dopaminergic markers in dementia with Lewy bodies,