Copyright © 2014 IJECCE, All right reserved
Analysis of Image Matching Algorithms
Dr. S. Arunamastani
Assistant Professor, ECE Department, JNTUACEA, Anantapuramu, Andhra Pradesh, India
Email: [email protected]
Srinivasulu Pattapu
M.Tech., ECE Department,
JNTUACEA, Anantapuramu, Andhra Pradesh, India Email: [email protected]
Abstract – Image matching is a fundamental issue in computer vision. It has been widely used in tracking, camera calibration, recognition and so on. The main aim of image matching is to find the correspondence between the two images of the same scene or object in different conditions or in different environment such as difference in their viewpoints, rotations, scale, illumination, amount of blur etc,. For the process of image matching extraction of stable common features (key points) is the major issue. Many of the key point detectors can provide the information about these stable features. Scale Invariant Feature Transform (SIFT) is one of the feature point detectors that can able to provide a set of features of an image that are not affected by many of the complications experienced in other methods. As the image-matching concept involves in finding the correspondence between the two images (reference image and test image) there exists a need to find the amount of transformation involved in between the two images. For estimating the transformation, Random Sample Consensus (RANSAC) is the mostly used algorithm, RANSAC considers the stable features provided by the initial feature detector (i.e., SIFT) as an input parameters and generate amount of transformation involved in between the images in the form of a matrix. For the estimation of the transformation matrix RANSAC uses different amount of inliers for different thresholds, This transformation matrix helps us to transform the test image like the reference image so that matching accuracy increases.
In this paper, we concentrate on the analysing the effect images with various environments like the view change, scale, rotation, illumination changes over the matching accuracy of the SIFT, and SIFT combined with RANSAC algorithms through experimentation.
Keywords – SIFT, Transformation Matrix, Histogram Transformation, RANSAC, Image Matching.
I. INTRODUCTION
In image matching, key region or point of interest is often used as the local feature due to its stable performance in detection and description. The local feature can be usually derived from a circle or ellipse with certain location and radius, these types of key points are effective and efficient when compared with other type of features such as edges. Therefore, these kinds of key points were extensively used in real time applications because of their stability in various environments (view change, scale, rotation, illumination variation).
For detecting the stable key points, many of the state of art detectors were present. Some of the mainly concentrate on edges (e.g. Harris detector [2], SUSAN [3], the Moravec corner detection algorithm) and provides the stable key points over the edges, some of the feature detectors extracts the stable key points from a particular
region (e.g. DoH [4], SIFT [5][6]). The main challenge in image matching exists when there is a view and illumination changes in a test image. As we apply the above-mentioned detectors for detecting stable key points, the amount of key points obtained from same region will tends to decrease as if there is any presence of view change or variation in illumination. For very large variations, the initial detectors will fail to detect the stable points. For obtaining the best matching accuracy, the test image must appear like reference image. For this, images under different environments must undergo different transformations.
The extraction of stable key points is the major issue for matching process. Using of region based detectors can provide more number of stable key points. SIFT (Scale Invariant Feature Transform) is one of the region based key point detector which provide more stable key points. The key points obtained are invariant to scale, rotation and illumination changes.
The major factor that which influence the matching accuracy is the amount of transformation involved by the test image as compared with reference image.
Fig.1. Illustration of implemented matching algorithm. Ir is the reference image.It is the test image,Ie transformed
image of Ir,.
As shown in Figure 1, by transforming the test image like the reference image, matching accuracy between the images is obtained in maximum. RANSAC (Random sample consensus) [7] algorithm provides the information about transformation in the form of a matrix. By using this matrix the test image can be transformed like the reference image.
II. ‘SIFT’ AND ‘RANSAC’ METHODS
2.1 Scale Invariant Feature Transform (SIFT)
obtained key point is invariant to scale, rotation. The invariant features extracted from images are used to perform reliable matching operation in between different views of an object or scene. For detecting the stable key points, the image undergoes in convolution with the Gaussian function. The Gaussian pyramid is constructed by varying the scale factor of the image. Then; the Difference of Gaussian (DoG) pyramid is constructed by subtracting the consecutive images in the Gaussian pyramid. The obtained DoG pyramids consist of pixels and are compared with the top and bottom neighbouring pixels in order to get stable key points. The low intensity valued pixels are eliminated so that we can able to get more stabilized key points. The key points obtained are invariant to scale, rotation.
2.2 Random Sample Consensus (RANSAC)
RANSAC is a re-sampling technique that generates the candidate solution with minimum number of data points. The basic procedure involved in RANSAC is selecting two stable key points at random. Obtain a line joining the two points and setting a threshold value for the line in order to obtain the inliers. The key points which lie in the threshold range are taken as inliers. The process is repeated for N iterations and the points that which yields highest number of inliers are considered for finding the homography transformation matrix.
2.3 Implementing method
SIFT generate stable key points. From these key points RANSAC algorithm generate Homography transformation matrix by comparing the key points of the reference image and the test image. So, by combining both SIFT [5] [6] and RANSAC [7] best matching can be obtained.
Consider two images one as reference and the other as test image, obtain stable key points for both the images using SIFT. The set of stable points are provided for RANSAC and it results in obtaining proper transformation in between the images. The test image is transformed as per the reference image based on the transformation matrix obtained, So that the transformed test image matches the reference image with more accuracy.
The above mentioned process is common for the images under different environments (view change, scale, and rotation) and for the images with different illuminations, the illumination factor of the reference and test images are normalized by transforming the histogram of test image according to the histogram of reference image and then follow the above mentioned process.
III. RESULTS AND DISCUSSIONS
Database:
To evaluate the performance of the image matching process of SIFT and RANSAC, experiments are made by applying them over a wide range of images with various environments (view change, scale, rotation, illumination) from the database provided by Mikolajczyk [8].This database contains eight group of images with challenging environments (view change, scale, rotation, illumination). The database images with different environments are shown in Figure 2.The column A of Figure 2 represents the images that are considered as reference and the rest of the columns represent the test images. Each rows of figure 1 portraits an image with different environment. The images under different environments are shown from row 1 to row 7. The images with view change (Graffiti, Wall) are shown in row1, row2. Row 3, row 4 represents the images with scale change and rotation (Boat, Bark). Row5 Images has variation in illumination (Leuven). Row6, row7 are the Blur images (Bikes, Trees) A proper analysis is carried out for each pair of images by performing individual SIFT matching between the image pair and the obtained result of matching accuracy is compared with the accuracy obtained from the discussed method (SIFT along with RANSAC).
As the images with different environments are considered the behaviour of the images under each and every environment are observed. SIFT is used as a basic detector for detecting the stable features (key points), RANSAC [4] is used of obtaining the homography between the reference and test images. SIFT is used for the cause it can be able to tolerate for scale changes, rotation of a key feature as compared with the other feature detectors. As if when there is a much variation in scale or in rotation for the key feature then the basic detector fails to detect the exact stable feature. For images with various illumination range SIFT [5] [6] alone can detects very less number of features. The compressed images are also considered for analysing the matching but RANSAC method fails to fit the reference and test images due to improper compressed pixel locations. Hence the results of these images are not considered in this paper.
The matching accuracy of the algorithm is compared by considering various parameters such as number of iterations, threshold of inlier, stable key points detected; number of matches and the number of inliers responsible for matching.
3.1 Analysis for Images with View changes
Copyright © 2014 IJECCE, All right reserved A
(Reference Image)
B (Test image 1)
C (Test image 2)
D (Test image 3)
E (Test image 4)
F (Test image 5)
1
2
3
4
5
6
7
Fig.1. Database images; column A represents the Reference images; column B to column F represents the test images. Row 1, row 2 images with view change (Graffiti image, wall image), row 3, row 4 images with scale change and rotation
(boat image, bark image), row 5 image with illumination change (Leuven image); row 6, row 7 represent blur images (trees image, bikes image).
3.2 Analysis of images with Scale change and
Rotation
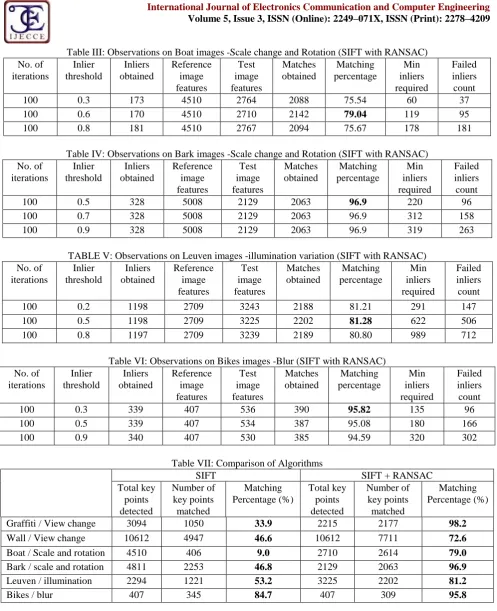
Matching the images with various scale changes is a bit complex thing to perform. Analysing the matching performance of these kinds of images is carried out by considering the image with more information as a reference image. With the help of chosen reference image the other test images can easily matched with high accuracy. The images with variation in scale are shown in row 3, 4 of Figure 1. For boat images in row3, the maximum matching obtained when test image 3 is matched with reference image, the test image is rotated over an angle of 34.12o for obtaining matching of 79.04% the least matching obtained when considering test image 5. For the bark images in row 4, maximum matching obtained for column B image, the test image is rotated over 179.06o
angle and least matching obtained for column D image. The number of inliers participated in obtaining the best match is shown in Table-III and Table IV. The best matching case obtained is tabulated in table-VII.
Fig.2. Illustration of histogram transformation. (a) Reference image. (b) Darker image. (c) Transformed image from (b) according to the histogram of (a). (d) Brighter image. (e) Transformed image from (d) according to the histogram of (a).
(f)-(j) the corresponding histograms of (a)-(e).
The matching percentage slightly decreases when there is a large variation in illumination with respect to the reference image. The number of inliers participated in obtaining the best match is shown in Table-V.
3.4 Analysis of blur images
The implemented method can able to match the blur images with high accuracy. As in SIFT the blur images are generated at its intermediate stages in order to get the most stable key points. As considering a blur image as an input it involves in no complexity for obtaining the stable key points. As the SIFT produces more stable points then the matching process becomes easier. The best matching case obtained for column E image of row 6 and the least is obtained for column F image of row 6 as shown in Fig.1 and shown in table-VII. The number of inliers participated in obtaining the best match is shown in Table-VII.
All the observation mentioned in Table I show the matching efficiency obtained with the discussed method and also compared with the basic SIFT method. The observations mentioned in Tables I to VI gives the information about the amount of inliers responsible for obtaining the best matched case over different environments (view, scale, illumination).The analysis is carried for all the possible conditions i.e. varying the Inlier
threshold, varying number of iterations for RANSAC algorithm, obtaining the best number of inliers, obtaining the failed conditions for various thresholds. By observing all the conditions, the best obtained results are tabulated. The images with change in view are matched with more accuracy up to tolerable level of view change. Beyond the level the initial detector fails and results in failure of the analysed method. For images with scale change, the image which consists of more information is considered as a reference image so that rest of the images with less information can be easily matched with reference image
From the observations made in the table I to table VI it can be observed that when the threshold of the Inlier is increased then the minimum number of inliers need for matching also increases i.e. for low threshold values the number of inliers needed for generating a transformation matrix are also less. The amount of inliers obtained is dependent on the amount of transformation involved in between the images. For a larger view change very few inliers are obtained and in some cases these few inliers are not sufficient for getting best matching accuracy of images. At extreme view change conditions SIFT fails to detect sufficient number of stable key points, at these situations the discussed method fails to produce the matching result.
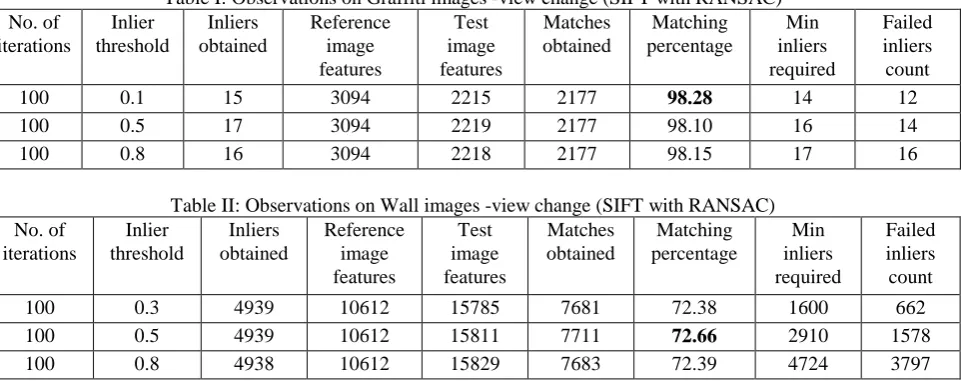
Table I: Observations on Graffiti images -view change (SIFT with RANSAC) No. of
iterations
Inlier threshold
Inliers obtained
Reference image features
Test image features
Matches obtained
Matching percentage
Min inliers required
Failed inliers count
100 0.1 15 3094 2215 2177 98.28 14 12
100 0.5 17 3094 2219 2177 98.10 16 14
100 0.8 16 3094 2218 2177 98.15 17 16
Table II: Observations on Wall images -view change (SIFT with RANSAC) No. of
iterations
Inlier threshold
Inliers obtained
Reference image features
Test image features
Matches obtained
Matching percentage
Min inliers required
Failed inliers count
100 0.3 4939 10612 15785 7681 72.38 1600 662
100 0.5 4939 10612 15811 7711 72.66 2910 1578
Copyright © 2014 IJECCE, All right reserved
Table III: Observations on Boat images -Scale change and Rotation (SIFT with RANSAC) No. of iterations Inlier threshold Inliers obtained Reference image features Test image features Matches obtained Matching percentage Min inliers required Failed inliers count
100 0.3 173 4510 2764 2088 75.54 60 37
100 0.6 170 4510 2710 2142 79.04 119 95
100 0.8 181 4510 2767 2094 75.67 178 181
Table IV: Observations on Bark images -Scale change and Rotation (SIFT with RANSAC) No. of iterations Inlier threshold Inliers obtained Reference image features Test image features Matches obtained Matching percentage Min inliers required Failed inliers count
100 0.5 328 5008 2129 2063 96.9 220 96
100 0.7 328 5008 2129 2063 96.9 312 158
100 0.9 328 5008 2129 2063 96.9 319 263
TABLE V: Observations on Leuven images -illumination variation (SIFT with RANSAC) No. of iterations Inlier threshold Inliers obtained Reference image features Test image features Matches obtained Matching percentage Min inliers required Failed inliers count
100 0.2 1198 2709 3243 2188 81.21 291 147
100 0.5 1198 2709 3225 2202 81.28 622 506
100 0.8 1197 2709 3239 2189 80.80 989 712
Table VI: Observations on Bikes images -Blur (SIFT with RANSAC) No. of iterations Inlier threshold Inliers obtained Reference image features Test image features Matches obtained Matching percentage Min inliers required Failed inliers count
100 0.3 339 407 536 390 95.82 135 96
100 0.5 339 407 534 387 95.08 180 166
100 0.9 340 407 530 385 94.59 320 302
Table VII: Comparison of Algorithms
SIFT SIFT + RANSAC
Total key points detected Number of key points matched Matching Percentage (%) Total key points detected Number of key points matched Matching Percentage (%)
Graffiti / View change 3094 1050 33.9 2215 2177 98.2
Wall / View change 10612 4947 46.6 10612 7711 72.6
Boat / Scale and rotation 4510 406 9.0 2710 2614 79.0
Bark / scale and rotation 4811 2253 46.8 2129 2063 96.9
Leuven / illumination 2294 1221 53.2 3225 2202 81.2
Bikes / blur 407 345 84.7 407 309 95.8
IV. CONCLUSION
In this paper the combination of SIFT and RANSAC methods is used for getting the high matching accuracy. As, SIFT is considered as an initial key point detector whenever the SIFT fails, RANSAC also Fails to produce transformation matrix. For images with considerable variation in view change the implemented method produces high accuracy of matching. For scale variation images the matching accuracy is least but best when
FUTURE WORK
As the method gives good matching accuracy when compared with the other existing approaches, still it needs to be enhanced.
As the SIFT is the basic detector that depends on the intensity value of the test and reference images, there is a possibility to obtain more accurate stable key points if any pre-processing techniques are applied to compensate for illumination variations.
Many parameters like number of iterations, inlier threshold ratio need to be tuned for RANSAC instead if these parameters are optimized or any methods are developed to adjust these parameters the execution time can be reduced and also the accuracy of RANSAC is enhanced.
REFERENCES
[1] Yinan Yu, Wei Chen, et al.―A Novel Algorithm for View and Illumination Invariant Image Matching‖ IEEE Trans, Image
Processing. Vol. 21 No.1 January 2012.
[2] C. Harris and M. Stephens, ―A combined corner and edge detection,‖ in Proc. 4th Alvey Vis. Conf., 1988, pp. 147–151. [3] S. M. Smith and J. M. Brady, ―Susan—A new approach to low
level image processing,‖ Int. J. Comput. Vis., vol. 23, no. 1, pp. 45–78, May 1997.
[4] T. Lindeberg, Scale-Space Theory in Computer Vision. Norwell, MA: Kluwer, 1994.
[5] Yu Meng, et al ―implementing the SIFT method‖ [email protected]
[6] D.G. Lowe, ―distinctive image features from scale invariant key points,‖ Int.J.comput.vis., vol.60, no.2,pp. 91-110. Nov. 2004. [7] M. A. Fischler and R. C. Bolles, ―Random sample consensus: A
paradigm for model fitting with applications to image analysis and automated cartography,‖ Commun. ACM, vol. 24, no. 6, pp.
381–395, Jun.1981.
[8] Database images http://www.robots.ox.ac.uk/~vgg/research/ affine/index.html
[9] M. Brown and D. Lowe, ―Unsupervised 3D object recognition and reconstruction in unordered datasets,‖ in Proc. Int. Conf.
3-D 3-Digit. Imag. Model., Jun. 2005, pp. 56–63.
[10] B. Telle, M. J. Aldon, and N. Ramdani, ―Camera calibration and 3d reconstruction using interval analysis,‖ in Proc. Int. Conf.