ISSN: 2333-6412 (Print), 2333-6420 (Online) Copyright © The Author(s). All Rights Reserved. Published by American Research Institute for Policy Development DOI: 10.15640/rcbr.v4n1a4 URL: http://dx.doi.org/10.15640/rcbr.v4n1a4
Managerial Overconfidence and Debt Maturity Structure of Malaysian Construction
and Material Companies
Noorfaiz Purhanudin
1& Zuriawati Zakaria
2Abstract
This study presents the relationship between managerial overconfidence and debt maturity structure of listed Malaysian Construction and Material companies. The study examines 57 companies for a period of six years from 2005 to 2010. The result shows that when the confidence level of managers increases, the preference for long-term debt decreases. This usually is the case for small-sized companies. Highly overconfident managers endeavor to match the assets structure and debt maturity structure for the purpose of interest payments. Hence, under their management, the maturity period of the debt structure would be reduced when the company is able to increase its profits. The tenure of the manager and the debt ratio does positively (negatively) and significantly influence the debt maturity structure. Overconfident managers with low educational levels, most likely choose long-term debt structure and managers with a finance or technical background show positive relationship towards debt maturity structure regardless of the level of the managerial overconfidence.
Keywords: managerial overconfidence, debt maturity, assets structure, firm size
1.0 Introduction
The capital structure plays an important role in financial management and managers have to decide on the optimal mixture of debt, hybrid securities and equity for firms to finance their assets (Saad, 2010; San & Heng, 2011). Psychology studies suggest that people are not completely rational. One of the factors attributing to this is overconfidence. They state that overconfident behavior might be influenced by people’s age, working experience, educational background and professional skills (Heath & Tversky, 1991; Forbes, 2005; Fraser & Greene, 2006). Compared to others, corporate managers are known to be more overconfident, due to illusion of control, lofty promise of good results and relatively vague benchmark of performance evaluation (Malmendier & Tate, 2005). Literature suggests that capital structure could be influenced by behavioral factors. For example, Bertrand and Schoar (2003) found that financially aggressive CEOs showed a tendency to use higher leverage than their more conservative peers. Other studies indicate that over confident managers tend to issue more debt and are less likely to follow a standard pecking order (Hackbarth, 2008). In Malaysia, there are studies such as by Gomez and Jomo (1998) that found a close relationship between business and politics. Johnson and Mitton (2003) reveal that Malaysian firms with political patronage tend to carry more debt. Fraser, Zhang & Derashid (2006) concluded that there was a positive link between political patronage and capital structure. The Malaysian construction industry plays an important role in generating wealth and developing socio-economic infrastructure and buildings in a country. The construction industry is highly dependent on banks for its survival. In 2005, the total amount of loans extended to the construction industry was RM 25.26 billion, compared with RM 23.29 billion and RM 21.71 billion in 2004 and 2003, respectively.
1
Department of Finance, Faculty of Business and Finance, Universiti Tunku Abdul Rahman, 31900, Kampar, Malaysia.
2
The total loans to the construction sector decreased over the three years from 2001 to 2003, but this trend reversed towards the end of 2005 (Lin, 2008). The aggregate corporate debt maturity has a clear cyclical pattern where it is longer during periods of economic expansion than during recession. For example, during the financial crisis of 2007-08, 26% of the non-financial public firms in the U.S. saw their share of long-term debt falling by 20% or more (Chen, Xu & Yang, 2012). As this industry requires large capital and long term investment, it is dependent on debt financing compared to equity financing for expansion and growth. Based on the limited literature, little work has been done to empirically study the relationship between managerial overconfidence and debt maturity in Malaysia. Therefore, the purpose of the present study is to ascertain whether managerial overconfidence does in fact determine debt maturity in the construction and material companies in Malaysia.
2.0 Literature Reviews
Overconfident managers use more short term debts when they believe that the company has good prospects, while realists prefer long term debts with lower risks (Landier & Thesmar, 2005, 2009). They usually overestimate the security of corporate investment projects, and under-estimate the possibility of default. For these managers, short-term debt financing would optimize the allocation of cash flow. On the contrary, Ataullah, Vivian, & Xu (2012) reported that firms with chairman who have high level of self-attribution (SAB) and executive directors especially the CEOs who are overconfident, tend to have longer debt maturity, and make long-term borrowings. A recent study by Graham, Harvey, & Puri (2013) and Huang, Tan & Faff (2013) supported the earlier findings of Malmendier et al. (2011) and (Landier & Thesmar, 2005, 2009), that is, overconfident managers tend to choose short term debt maturity. These managers believe that equity is more mispriced than debt, and conditional on accessing external financing. Hence, the overconfident CEOs prefer debt instead of equity. They prefer short-term debt to long-term debt, and long-long-term debt to perpetuity debt (equity). Huang et al. (2013) who examined 3,291 firm-year observations over the period 2006 to 2010 in the US market, concluded that firms with overconfident CEOs have a higher proportion of debt due within one, two and three years. The positive relationship between CEO overconfidence and debt maturity arises from the use of a high proportion of very short-term debt (debt with maturity of less than 12 months). Firms with overconfident CEOs tend to adopt a shorter debt maturity structure by using a higher proportion of short-term debt (due within 12 months), despite the high liquidity risks associated with such a financing strategy. Further analysis indicate that overconfident CEOs attract lower financing costs on syndicated loans, suggesting that their willingness to issue short-term debt is viewed as a favorable action by debt-holders to mitigate any potential debt agency problems.
Overconfident managers overrate their managerial capacity and their ability to generate profits from investments (Shou & Li-li, 2009, Hackbarth, 2008). Therefore, though long-term loans could relief them of repayment stress, their financing decisions still lean towards short term debts as the costs of short term debts are lower than long term debts. Moreover, overconfident managers overestimate the investment recovery period. They estimate a shorter investment recovery period than the actual investment recovery period. Hence, they are inclined to borrow more short term debts to match the shorter investment recovery periods. CEO’s age has a weak relationship with short term maturity and sometimes no effect at all on the amount of leverage. It so happens they favor a conservative capital structure (Harford. 2008). Sun et al. (2005) and Jiang and Li (2006b) found that the higher the debt ratio of Chinese listed companies, the longer the corporate debt maturity structure. Although there is a positive relationship between corporate debt maturity structure and debt ratio, it could be weakened by strong confident managers. Overconfident managers tend to overestimate the profitability of investment projects and underestimate the related risks. Thus, they might even underestimate the liquidity risks, and further weaken the positive relationship between debt maturity structure and debt ratios. Similarly, Yu et al. (2006) revealed that the overconfident managers in China prefer to choose higher debt-to-equity ratio, especially short-term debt-to-equity ratio.
H1 There is a negative relationship between managerial overconfidence and debt maturity.
After observing the 7,800 small businesses operating in the U.S., Dai and Ivanov (2009) proved that the more optimistic entrepreneurs tend to use more short-term debt. Controlling for various firm characteristics such as firm age, firm size, percentage of tangible assets, etc. the result shows that the more optimistic entrepreneurs use significantly more short-term debt than the less optimistic entrepreneurs. Specifically, a small firm with the most optimistic entrepreneur has a ratio of short-term debt to long-term debt of about 4% to 6%, higher than a similar firm with a least optimistic entrepreneur.
H2 Overconfident managers in large-sized companies are more likely to choose long-term debt compared to
small-sized companies.
3.0 Methodology
This research utilizes the data from Datastream and the Annual Report of companies listed on the Main Board (Bursa Malaysia) for the period 2005 to 2010. A total of 57 Construction and Material companies were used in this study after excluding 49 companies for incomplete information. The Principal Component Analysis (PCA) was employed to construct the proxy of managerial overconfidence. Datastream are used to collect information regarding total debt, total assets, sales and net income. The company annual reports are used to gather information for the proxy of managerial overconfidence such as age, tenure, ownership and educational background. This study employed panel data analysis to test the relationship between managerial overconfidence and debt maturity.
CEO Age: The age of a CEO could affect corporate financial choice, firm performance and agency cost
(Serfling, 2012). CEOs nearing retirement age are associated with positive performance, unlike the preretirement group who are associated with poor performance. They choose to retire when the company is performing well because it would increase their retirement benefits (Puffer & Weintrop, 1991). Compared to younger CEOs, the older CEOs prefer investments that reduce company-specific risks (Vroom & Pahl, 1971). Older CEOs are overconfident of the decisions they make (Huang et al., 2013). When the CEOs are 46 years old and above, the confidence level increases and they tend to increase the company’s leverage (Wei, Azizan & Kweh, 2014).
CEO Tenure: The longer the CEO’s tenure, the greater the probability that they would have gained control
over internal monitoring (Berger et al. (1997) and become overconfident of any decisions they made (Huang et al., 2013). When the CEO has a long tenure, the firm has low leverage, weak stock and compensation incentive, and he or she would be less scrutinized by the board of directors. The lower debt strategy is used to reduce performance pressure (Abor, 2007).
CEO Ownership: The good thing about CEO ownership is the potential to reduce agency conflict (Jensen &
Meckling, 1976) as it reduces excessive consumption by the CEO or top management and increases the firm’s value.
However, the negative aspect of CEO ownership is that, the higher holding stock insulates/protects them from internal and external company discipline, thus reducing the firm’s value (Jensen & Ruback, 1983). Managers become overconfident with high shareholdings. Due to overconfidence, they are willing to accept performance based bonuses (Hirshleifer, Low & Teoh, 2012).
CEO Education: Talented managers are more confident of their investment decisions, unlike the less capable
counterparty (Predergast & Stole, 1996). According to Bertrand and Schoar (2003), managers from the older age group prefer conservative management while managers with an MBA degree perform aggressively. Thus, the more educated managers are expected to be overconfident (Puri & Robinson, 2007; Schrand & Zechman, 2012)
CEO Educational Background: CEOs with finance education tend to be overconfident and could lead the
company to financial distress as they overestimate their abilities (Ho & Chang, 2009). Malmendier and Tate (2008) stated that a company has high investment cash flow sensitivity when it is managed by a CEO with an engineering (or science) background.
The empirical model used in this study could be described as follows: All Companies
DM = f (MO, AS, DE, DR, GROWTH, ROE, SIZE) (1)
High and Low Overconfident Managers
DM = f (AGE, TENURE, OWN, HIE, LWE, FB, TB, AS, DE, DR,
The data for high and low managerial overconfidence in this study is classified based on the median value of managerial overconfidence, computed using the PCA method. In tandem with the study conducted by Malmendier and Tate (2008), this study set a dummy variable for CEO’s educational background, either finance (FB) or technical (TB). Dummy equal to 1 if CEO has a degree in accounting, finance, business or economics and zero if otherwise. However, for CEO with a degree in areas related to engineering, physics, chemistry, mathematics, operations research, biology or applied science, the dummy is set at 1 and at 0 if otherwise.
Table 3.1: Description of Variables
Variables Descriptions
DEPENDENT VARIABLE
Debt Maturity (DM) Total Long Term Debt / Total Debt
INDEPENDENT VARIABLES
CEO Age (AGE) The logarithm of CEO age
CEO Tenure (TENURE) The logarithm of CEO tenure plus 1
CEO Ownership (OWN) % of shares held by CEO to total number of shares issued
High Educational level (HIE) Dummy 1 if CEO educational level is above undergraduate, otherwise 0 Low Educational level (LWE) Dummy 1 if CEO educational level is undergraduate or below, otherwise 0 Finance Background (FB) Dummy 1 if background in accounting, finance, business or economics,
otherwise 0
Technical Background (TB) Dummy 1 if engineering, physics, chemistry, mathematics, operations research, biology or applied science, otherwise 0
Assets Structure (AS) Total Fixed Assets / Total Assets Debt to Equity Ratio (DE) Total Debt / Total Shareholder Equity
Debt Ratio (DR) Total Debt / Total Assets
Growth option (GROWTH) Market-to-book equity ratio. Return on Equity (ROE) Net Income / Shareholder Equity Firm Size (SIZE) The logarithm of Total Assets
4.0 Findings
4.1 Descriptive Statistics
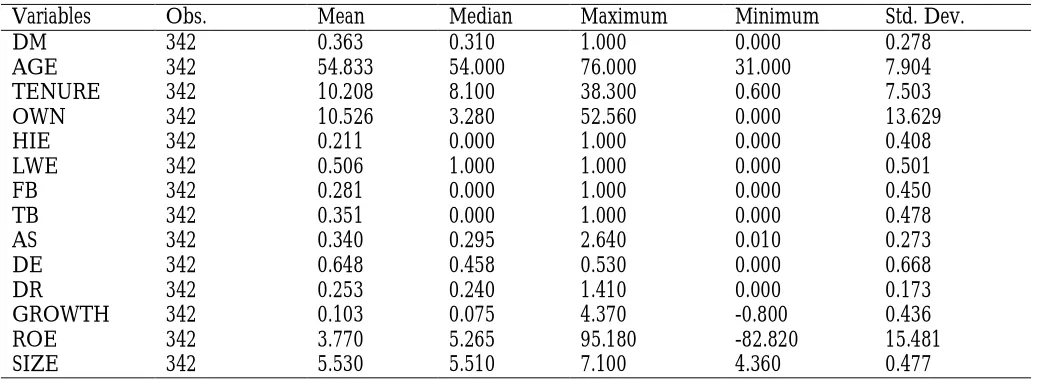
Table 4.1: Descriptive Statistics
Variables Obs. Mean Median Maximum Minimum Std. Dev.
DM 342 0.363 0.310 1.000 0.000 0.278
AGE 342 54.833 54.000 76.000 31.000 7.904
TENURE 342 10.208 8.100 38.300 0.600 7.503
OWN 342 10.526 3.280 52.560 0.000 13.629
HIE 342 0.211 0.000 1.000 0.000 0.408
LWE 342 0.506 1.000 1.000 0.000 0.501
FB 342 0.281 0.000 1.000 0.000 0.450
TB 342 0.351 0.000 1.000 0.000 0.478
AS 342 0.340 0.295 2.640 0.010 0.273
DE 342 0.648 0.458 0.530 0.000 0.668
DR 342 0.253 0.240 1.410 0.000 0.173
GROWTH 342 0.103 0.075 4.370 -0.800 0.436
ROE 342 3.770 5.265 95.180 -82.820 15.481
SIZE 342 5.530 5.510 7.100 4.360 0.477
Descriptive statistics of the variables used in the analysis are shown in Table 4.1. The statistics revealed that the mean (median) debt maturity (DM) of listed Malaysian construction and material companies for the period 2005 to 2010 is 36.3% (31%). This implies that, on average the firms used 36.3% long term debts to finance their operations. On average (median), 25.30% (24%) of a company’s assets were funded by debt, with 34% (29.5%) of the total assets being fixed assets. Since this industry requires large capital and long term investment, on average, 64.83% of companies’ financing constitute debt. In addition, the average age of the CEO is between 54 to 55 years old and generally they have been holding the position for 10 years. Furthermore, the study also indicated that on average, CEO ownership in the construction and materials sector is 10.53% with the highest being 52.56%. Moreover, on average, 3.77% of the income of the companies is used as returns paid to the shareholders.
4.2 The Relationship between Managerial Overconfidence and Debt Maturity
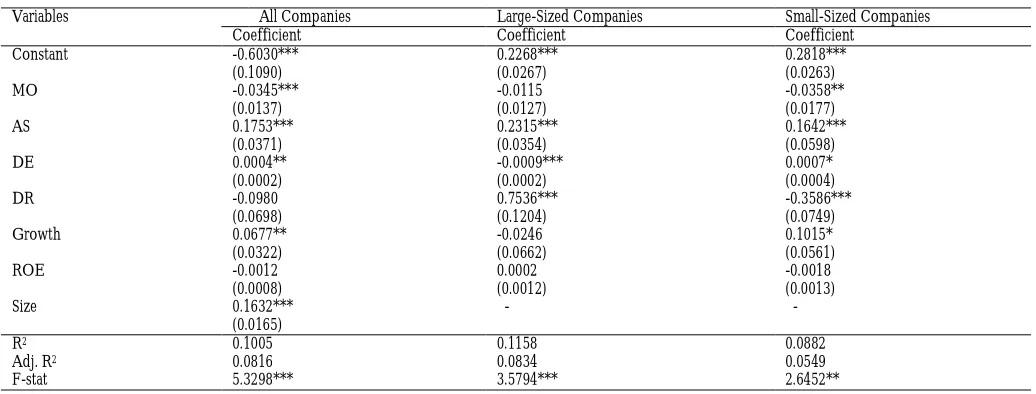
Table 4.2 shows that overconfident managers have negative and significant relationship with debt maturity at 1%. It is revealed that when the level of overconfident increases, the preference for long-term debt is reduced by 3.45%. Hence, hypothesis H1 is accepted, that there is a negative relationship between managerial overconfidence and
debt maturity. This suggests that overconfident managers in the construction and material sector favour short-term debt to finance their investments. As reported by Chen et al. (2012) during economic boom, managers desire long-term financing. However, long-long-term debt reduces by 20% when affected by the financial crisis. Since the period of study used in this research falls within the financial crisis years of 2007-2008, it shows that overconfident managers in construction and material companies take into consideration the risks when deciding on the maturity of the debt. Managerial overconfidence in a small-sized company results in preference for short-term debt maturity compared to a large-sized company, therefore H2 is accepted. The result supported the earlier findings of Barclay and Smith (1995)
and Scherr and Hulburt (2001). The larger the company, the greater its liabilities, since most debt holders have greater confidence investing in larger companies. Asset structure of construction and material companies is positively and significantly related to debt maturity at 1%. It suggests that the companies’ high fixed assets are financed by long-term debt maturity. The finding is consistent with that of Guedes and Opler (1996). Regardless of size, companies try to match debt maturity structure and assets structure to ensure they have enough cash flow (created from asset) to pay interests and principal repayments on debt. The company debt to equity ratio and growth of investment are positively associated with debt maturity at 5% significance level. This indicates that companies tend to increase the debt maturity once the total funds of the company provided by the creditors and owners (shareholders) increase with high investment opportunities. The company’s profitability is insignificantly influenced by the structure of Malaysian construction and material companies.
Table 4.2: The Regression Results of Managerial Overconfidence and Debt Maturity
Variables All Companies Large-Sized Companies Small-Sized Companies
Coefficient Coefficient Coefficient
Constant -0.6030*** 0.2268*** 0.2818***
(0.1090) (0.0267) (0.0263)
MO -0.0345*** -0.0115 -0.0358**
(0.0137) (0.0127) (0.0177)
AS 0.1753*** 0.2315*** 0.1642***
(0.0371) (0.0354) (0.0598)
DE 0.0004** -0.0009*** 0.0007*
(0.0002) (0.0002) (0.0004)
DR -0.0980 0.7536*** -0.3586***
(0.0698) (0.1204) (0.0749)
Growth 0.0677** -0.0246 0.1015*
(0.0322) (0.0662) (0.0561)
ROE -0.0012 0.0002 -0.0018
(0.0008) (0.0012) (0.0013)
Size 0.1632*** - -
(0.0165)
R2 0.1005 0.1158 0.0882
Adj. R2 0.0816 0.0834 0.0549
F-stat 5.3298*** 3.5794*** 2.6452**
4.3 The Relationship between High and Low Levels of Managerial Overconfidence and Debt Maturity
The results in Table 4.3 show that most Malaysian construction and material companies with highly overconfident managers choose short-term debt structure as they become older. Thus, the results suggest that older overconfident managers favour short-term debt due to lower risks of investment. It’s consistent with Vroom and Pahl (1971) and Puffer and Weintrop (1991) views that older overconfident managers are concerned with their retirement benefits. They improve the company’s performance by choosing investments that reduce the company-specific risks. However, age does not influence managers with low level of overconfidence to make decisions regarding the debt maturity structure. The tenure of a highly overconfident manager is strongly influenced by the choice of debt maturity structure. The longer tenure of managers with low confidence level influences them to decide on short-term debt financing. Consistent with the earlier study by Huang et al. (2013), the results from this study indicated that the longer they had served in a company, they more experienced and overconfident they become with the information available to them. Hence, this kind of manager prefers to take risks and choose to finance the company’s investment with long-term debt. In addition, the results also revealed that the higher the shareholding of managers with low confidence level inside the company, the more they choose to used short-term debt. It shows that they are concerned about the wealth of the company and make decisions that lower company risks.
Table 4.3: The Regression Results of High and Low Levels of Managerial Overconfidence
Variables High level of Managerial Overconfidence Low level of Managerial Overconfidence
Coefficient Coefficient
CONSTANT -0.5887*** -0.2505
(0.1573) (0.2698)
AGE -0.0041* -0.0032
(0.0022) (0.0025)
TENURE 0.0068*** -0.0135*
(0.0020) (0.0074)
OWN -0.0012 -0.0017**
(0.0016) (0.0009)
HIE -0.0692 0.0463
(0.0934) (0.0768)
LWE -0.1947*** 0.0747
(0.0443) (0.0561)
FB 0.2304*** 0.1479***
(0.0564) (0.0447)
TB 0.1986*** 0.0839*
(0.0391) (0.0481)
AS 0.3953*** 0.1693***
(0.1185) (0.0600)
DE -0.0003 0.0017***
(0.0002) (0.0004)
DR 0.1959** -0.3736**
(0.0992) (0.1629)
GROWTH 0.0536 0.0471
(0.0530) (0.0297)
ROE -0.0032*** 0.0007
(0.0010) (0.0014)
SIZE 0.1622*** 0.1282***
(0.0161) (0.0351)
R2 0.3387 0.1947
Adj. R2 0.2840 0.1280
F-stat 6.1868*** 2.9203***
On the other hand, in terms of education, overconfident managers with low educational levels, most likely choose long-term debt structure with coefficient of -19.47%. Regardless of the level of the managerial overconfidence, managers with a finance or technical background show positive relationship towards debt maturity structure. Consistent with the earlier findings in Table 4.2, assets structure shows a strong relationship with debt maturity structure. Surprisingly, the findings of this study show that when the company profits increase, overconfident manager prefer lower debt maturity structure.
5.0 Conclusion
This study employed PCA to measure managerial overconfidence. The result shows that overconfident managers in Malaysian construction and material companies prefer to finance company investments using short-term debt, especially the small-sized companies. When a company is managed by a overconfident manager, most of company’s fixed assets are financed by long-term debt in order to match the company cash flow and interest payment. When the company’s investment increases, the total funds provided by their creditors and shareholders’ increase especially under the management of managers with low confidence level. The younger the overconfident managers, the more likely they prefer long-term debt maturity while those with low level of confidence and a longer tenure would choose short-term debt financing. The signs that agency problems exist in Malaysian construction and material companies are that managers with low level of confidence but with high shareholdings, try to secure their wealth by choosing less risky short-term financing.
References
Abor, J. (2007). Corporate governance and financing decisions of Ghanaian listed companies. Corporate Governance, 7(1), 83-92.
Ataullah, A., Vivian, A., & Xu, B. (2012). Managerial Overconfidence, Self-attribution Bias and Corporate Debt Maturity Structure. Working Paper, Loughborough University.
Barclay, M. J., & Smith, C. W., Jr. (1995). The maturity structure of corporate debt. The Journal of Finance, 50(2), 609-631.
Berger, P. G., Ofek, E., & Yermack, D. L. (1997). Managerial entrenchment and capital structure decisions. The Journal of Finance, 52(4), 1411-1438.
Bertrand, M. and Schoar, A. (2003). Managing with style: the effect of managers on firm policies. Quarterly Journal of Economics, 118(4), 1169-1208.
Chen, H., Xu, Y., & Yang, J. (2012). Systematic risk, debt maturity, and the term structure of credit spreads (No. w18367). National Bureau of Economic Research.
Dai, N., & Ivanov, V. (2009). Entrepreneurial Optimism, Credit Availability, and Cost of Financing: Evidence from Us Small Businesses. Working paper SSRN.
Fraser, S., & Greene, F. J. (2006). The Effects of Experience on Entrepreneurial Optimism and Uncertainty. Economica, 73(290), 169-192.
Fraser, D. R., Zhang, H., and Derashid, C. (2006). Capital structure and political patronage: The case of Malaysia. Journal of Banking & Finance, 30(4), 1291-1308.
Gomez, E. T., and Jomo, K. S. (1998). Malaysia’s political economy: Political, patronage and profits. Cambridge University Press: UK.
Graham, J. R., Harvey, C. R., & Puri, M. (2013). Managerial Attitudes and Corporate Actions. Journal of Financial Economics, 109(1), 103-121.
Guedes, J., & Opler, T. (1996). The determinants of the maturity of corporate debt issues. The Journal of Finance, 51(5), 1809-1833.
Hackbarth, D. (2008). Managerial traits and capital structure decisions. Journal of Financial and Quantitative Analysis, 43(4), 843-882.
Harford, J., Li, K., & Zhao, X. (2008). Corporate Boards and the Leverage and Debt Maturity Choices. International Journal of Corporate Governance, 1(1), 3-27.
Heath, C., & Tversky, A. (1991). Preference and Belief: Ambiguity and Competence in Choice under Uncertainty. Journal of risk and uncertainty, 4(1), 5-28.
Ho, C.R., & Chang, Y. (2009). CEO Overconfidence and Corporate Financial Distress. SSRN working paper, No. 1659440.
Huang, R., Tan, K. J. K., & Faff, R. (2013). CEO Overconfidence and Corporate Debt Maturity. Available at SSRN 2311530.
Jensen, M., & Meckling, W. (1976). Theory of the company: Managerial behaviour, Agency cost and ownership structure. Journal of Financial Economics, 3(4), 305-360.
Jensen, M., & Ruback, R. (1983). The market for corporate control: The scientific evidence. Journal of Financial Economics, 11(1), 5–50.
Jiang, W., & Li, B. (2006b). Institutional Environment, State Ownership and Lending Discrimination. Journal of Financial Research, 11, 116-26.
Johnson, S., and Mitton, T. (2003). Cronyism and capital controls: evidence from Malaysia. Journal of Financial Economics, 67(2), 351-382.
Landier, A., & Thesmar, D. (2005). Financial Contracting With Optimistic Entrepreneurs: Theory and Evidence. In AFA 2004 San Diego Meetings.
Landier, A., & Thesmar, D. (2009). Financial Contracting With Optimistic Entrepreneurs. Review of Financial Studies, 22(1), 117-150.
Lin, L.S. (2008). Project financing for small and medium contracting firms. Master thesis. Universiti Sains Malaysia, Pulau Pinang.
Malmendier, U., & Tate, G. (2005). CEO Overconfidence and Corporate Investment. The Journal of Finance, 60(6), 2661-2700.
Malmendier, U., & Tate, G. (2008). Who makes acquisitions? CEO overconfidence and the market's reaction. Journal of Financial Economics,89(1), 20-43.
Malmendier, U., Tate, G., & Yan, J. (2011). Overconfidence and Early‐Life Experiences: The Effect of Managerial Traits on Corporate Financial Policies. The Journal of Finance, 66(5), 1687-1733.
Prendergast, C., & Stole, L. (1996). Impetuous youngsters and jaded old-timers: Acquiring a reputation for learning. Journal of Political Economy, 1105-1134.
Puffer, S. M., & Weintrop, J. B. (1991). Corporate performance and CEO turnover: The role of performance expectations. Administrative Science Quarterly, 1-19.
Puri, M., & Robinson, D. T. (2007). Optimism and economic choice. Journal of Financial Economics, 86(1), 71-99. Saad, N. M. (2010). Corporate governance compliance and the effects to capital structure. International Journal of
Economics and Financial, 2(1), 105-1 14.
San, T. O., & Heng, B. T. (201 1). Capital structure and corporate performance of Malaysia construction sector. International Journal of Humanities and Social Science, l(2).
Scherr, F. C., & Hulburt, H. M. (2001). The Debt Maturity Structure of Small Firms. Financial Management, 3(1), 85-111.
Schrand, C. M., & Zechman, S. L. (2012). Executive overconfidence and the slippery slope to financial misreporting. Journal of Accounting and Economics,53(1), 311-329.
Serfling, M. A. (2012). CEO age, underinvestment, and agency costs. Eller College of Management, University of Arizona.
Shou, C., & Li-li, C. (2009). The Effect of Managerial Overconfidence on Listed Companies' Capital Structure and Debt Maturity Structure. In Management Science and Engineering, 2009. ICMSE 2009. International Conference on (1348-1353).
Sun, Z., Liu, F., & Li, Z. (2005). Market Development, Government Influence and Corporate Debt Maturity Structure. Economic Research Journal, 5, 52-63.
Vroom, V. H., & Pahl, B. (1971). Relationship between age and risk taking among managers. Journal of Applied Psychology, 55(5), 399.
Wei, K. I. T., Azizan, N.A., & Qian, L. K. (2014).Managerial Overconfidence, CEO Personal Characteristics and Leverage Decision of Malaysian Public Listed Companies. 5th International Conference on Business and
Economic Research (5th ICBER 2014) Proceeding, 24-25 March 2014, Pullman Hotel, Kuching.