Open Access
R E S E A R C H A R T I C L E
© 2010 Groenwold et al; licensee BioMed Central Ltd. This is an Open Access article distributed under the terms of the Creative Com-mons Attribution License (http://creativecomCom-mons.org/licenses/by/2.0), which permits unrestricted use, distribution, and reproduc-tion in any medium, provided the original work is properly cited.
Research article
Subgroup effects despite homogeneous
heterogeneity test results
Rolf HH Groenwold*
1, Maroeska M Rovers
1, Jacobus Lubsen
2and Geert JMG van der Heijden
1Abstract
Background: Statistical tests of heterogeneity are very popular in meta-analyses, as heterogeneity might indicate subgroup effects. Lack of demonstrable statistical heterogeneity, however, might obscure clinical heterogeneity, meaning clinically relevant subgroup effects.
Methods: A qualitative, visual method to explore the potential for subgroup effects was provided by a modification of the forest plot, i.e., adding a vertical axis indicating the proportion of a subgroup variable in the individual trials. Such a plot was used to assess the potential for clinically relevant subgroup effects and was illustrated by a clinical example on the effects of antibiotics in children with acute otitis media.
Results: Statistical tests did not indicate heterogeneity in the meta-analysis on the effects of amoxicillin on acute otitis media (Q = 3.29, p = 0.51; I2 = 0%; T2 = 0). Nevertheless, in a modified forest plot, in which the individual trials were
ordered by the proportion of children with bilateral otitis, a clear relation between bilaterality and treatment effects was observed (which was also found in an individual patient data meta-analysis of the included trials: p-value for interaction 0.021).
Conclusions: A modification of the forest plot, by including an additional (vertical) axis indicating the proportion of a certain subgroup variable, is a qualitative, visual, and easy-to-interpret method to explore potential subgroup effects in studies included in meta-analyses.
Background
Practice guidelines increasingly rely on systematic reviews and meta-analyses. The ultimate purpose of a meta-analysis is to produce an overall estimate of the effect of an intervention by quantitatively combining study results. However, several issues arise in the process of integrating evidence. One of the main issues concerns heterogeneity, i.e. the extent to which different studies give similar or different results. Statistical tests are rou-tinely available to evaluate the presence of statistical het-erogeneity (between-study hethet-erogeneity) in meta-analysis [1-3]. Strictly speaking, however, one is not really interested in statistical heterogeneity. What one is inter-ested in is clinical heterogeneity, i.e., specific causes that underlie heterogeneity across studies, especially since the direction and magnitude of the effect in the meta-analysis is often used to guide decisions about clinical practice for
a wide range of patients. Yet, relevant subgroup effects may not be revealed by a test for (statistical) heterogene-ity. In meta-regression analysis the relation between a certain subgroup characteristic and the size of the treat-ment effect can in fact be quantified, but such analyses might be difficult to conduct or interpret, and rely on sev-eral assumptions. Furthermore, the observed treatment effect and subgroup variables are actually estimates, rather than true values. Ordinary meta-regression analy-sis (weighted least squares) does not take measurement errors in treatment and subgroup variables adequately into account and may consequently give a biased estimate of the slope of the regression line [4]. We will show that clinically relevant subgroup effects can be explored in a simple manner by modifying the forest plot.
Methods
Tests for heterogeneity
Several tests have been developed to assess heterogeneity. The so-called Cochrane's Q (or Cochrane's χ2 test)
* Correspondence: [email protected]
1 Julius Center for Health Sciences and Primary Care, University Medical Center Utrecht, Utrecht, The Netherlands
weights the observed variation in treatment effects by the inverse of the variation in each study [5]. A large value of Q indicates large differences between studies, and hence, the effects from the included studies can be considered heterogeneous [2]. A modification of Cochrane's Q is the measure I2, which is the ratio of variation that exceeds
chance variation and the total variation in the treatment effects. Possible values for I2 range from zero to one, with
a high value for I2 indicating much heterogeneity. Both Q
and I2 are standardized measures, meaning that they
don't depend on the metric of the effect size. A third mea-sure of heterogeneity, indicating the variance of the true effect sizes is T2, where (similar to Q and I2) large values
of T2 indicate heterogeneity. This method of estimating
the variance between studies (T2) is also known as the
method of moments, or the DerSimonian and Laird method [6]. A fourth measure is the prediction interval, which indicates the distribution of true effect sizes and is based on T2 [2]. Cochrane's Q is sensitive to the number
of studies and especially when the number of studies included in a meta-analysis is small, Cochrane's Q too often leads to false-positive conclusions (too large type I error) [7]. The modification I2 takes account of the
num-ber of included studies and has a correct probability of a type I error [3]. The measure T2 is insensitive to the
num-ber of studies as well, but sensitive to the metric of the effect size [2].
Currently, I2 appears to be used routinely in most
pub-lished meta-analyses. Interestingly, the observed amount of heterogeneity depends on the effect measure that is considered in a meta-analysis: little heterogeneity when considering odds ratios implies large heterogeneity when considering risk differences and vice versa [8]. The reason for this is analogous to effect measure modification in a single study: if odds ratios are the same between strata (e.g., age categories) of a single study, risk differences are likely to differ between strata.
Consequences of heterogeneity
Tests for heterogeneity indicate whether the variation in observed effects is either large or small. When heteroge-neity is low (non-significant) for the chosen effect mea-sure, variation between effects from different studies is (relatively) small. Thus, a fixed effects model can be used to synthesize the data, since the assumption underlying a fixed effects model is that the treatment effect is the same in each study, and variation between studies is due to sampling (i.e., chance) [3,7]. If variation in the effects found in the different studies is (relatively) large they could be considered as sampled from a distribution of effects, i.e., the true treatment effect that is estimated in the different studies is not a single value, but rather a dis-tribution of effects. In that case, a random effects model has been recommended [3,7]. It has also been suggested
that heterogeneity is inevitable in meta-analysis [9], and random effects models are therefore obligatory. If, how-ever, heterogeneity is (very) large, one could even con-sider not pooling results from different studies at all, since studies are likely to be (very) different [2]. Further-more, if there is a cause for heterogeneity, for example a subgroup effect, neither fixed nor random effects models take such relations between the effect size and subgroups into account. Another explanation for heterogeneity (other than differential treatment effects) could be a tematic error in the included studies. For example, sys-tematic error that is related to e.g., the proportion of women, or differences in methodology (e.g., differences in outcome ascertainment) of the included studies [10].
Relevant subgroup effects
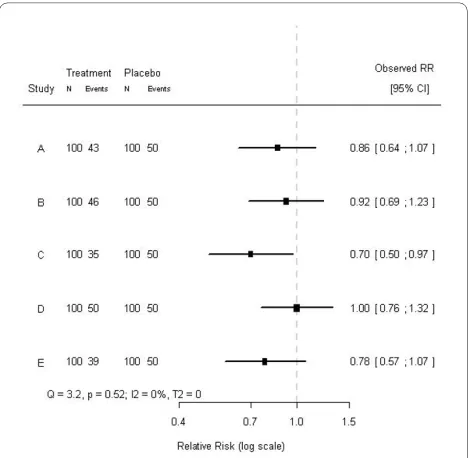
Test for heterogeneity do not indicate possible causes for heterogeneity. In fact, testing for heterogeneity in two meta-analyses - one with a clear cause for heterogeneity (e.g., a subgroup effect), and the other not - can lead to the same conclusions with respect to heterogeneity. For example, consider a hypothetical meta-analysis of five randomized trials on the effects of some treatment. Each trial consisted of 200 subjects, randomized to either treatment or placebo and the baseline risk for the out-come was 50%. The effects and their 95% confidence intervals are shown in Figure 1. Testing for heterogeneity indicated that these effects could not be considered het-erogeneous (Q = 3.2, p = 0.52; I2 = 0%; T2 = 0). A closer
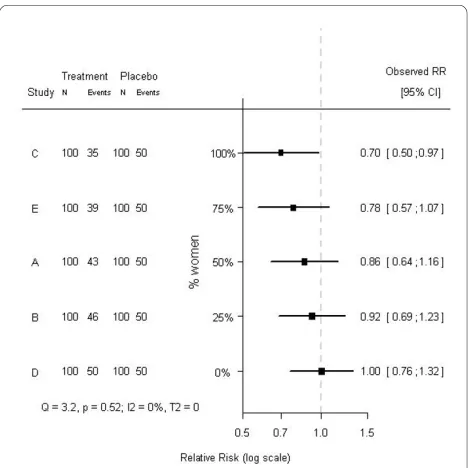
look at the individual trials revealed that the proportion of women included in the studies differed considerably: from 0% to 100%. Rearranging the order of the effects by the proportion of women included in each study resulted in Figure 2. The tests for heterogeneity reached exactly the same conclusions, since the ordering of the observed treatment effects is not taken into account when testing for heterogeneity. Clearly, in the modified forest plot (Fig-ure 2) the data have a certain pattern, which may indicate a differential treatment effect among men and women, i.e., modification of the treatment effect by sex. In fact, the treatment was effective in women (RR = 0.7), but not in men (RR = 1.0), and when analyzing the individual patient data (i.e., fitting a regression model to the individ-ual patient data rather than the aggregated data and including a factor to account for differences between tri-als), a statistically significant subgroup effect was indeed found (p-value for interaction 0.011). Hence, in aggre-gated data the differential treatment effect by sex was not indicated by tests for heterogeneity, but only suggested by the modified forest plot, whereas in individual patient data this differential effect was clearly observed and sta-tistically significant. Whether this subgroup effect is clin-ically relevant is rather subjective, but we can conclude that tests for heterogeneity on aggregated data appear not
to tell the whole story about heterogeneity on individual patient data.
What is important is that a regular forest plot (Figure 1) only contains a horizontal axis (indicating the effect size), whereas the modified forest plot (Figure 2) contains two axes. Both in the regular forest plot and in the modified forest plot the horizontal axis indicates the effect size. The additional vertical axis in the modified forest plot indicates the proportion of a certain subgroup variable in the included studies. Importantly, the vertical axis does not simply indicate the order of the subgrouping variable, but also scales this variable.
An often used quantitative approach to investigate the association between a certain subgroup characteristic and the size of the treatment effect is by applying meta-regression analysis [11]. Such analyses however rely on several assumptions, e.g., linearity of the association, and might be hard to interpret for their quantitative nature. Furthermore, in ordinary meta-regression analysis the treatment effects from the included studies are handled as if they are true values rather than estimates, which can result in bias when using least squares regression [4]. In addition, aggregated data meta-(regression) analyses are inappropriate to estimate unbiased treatment effects in patient subgroups, since such comparisons are observa-tional by nature. As a result, the observed subgroup effect may be attributable to other variables than the subgroup-ing variable [12]. Furthermore, as indicated before, nei-ther fixed nor random effects models address the cause for heterogeneity. Individual patient data meta-analysis can be a valid alternative to study subgroup effects [12]. In conclusion, the modified forest plot is a qualitative, visual alternative to assess the potential for a clinical rele-vant subgroup effects.
Results
In empirical meta-analyses subgroup effects can lead to patterns in a modified forest plot as well, as is illustrated by the following clinical example. In an individual patient data (IPD) meta-analysis on the effects of amoxicillin in children with acute otitis media, amoxicillin was more effective in children with bilateral otitis (p-value for inter-action 0.021) [13]. Prior to this IPD meta-analysis age was thought to modify the effects of amoxicillin. Most of the studies included in the meta-analysis explicitly men-tioned age distributions, but did not report the propor-tion of bilateral otitis. If the included studies, however, had reported the proportion of bilateral otitis, indications for the differential treatment effect found in the IPD meta-analysis could already have been suggested in a meta-analysis on the aggregated data (i.e., by construct-ing a modified forest plot). In Figure 3, the studies are chronologically ordered, whereas in Figure 4 their order is based on the proportion of children with bilateral acute
Figure 2 Modified forest plot of a hypothetical meta-analysis of
five studies, ordered by the proportion of women in each study.
otitis media (modified forest plot). As in the aforemen-tioned example on the hypothetical meta-analysis, the
measures of heterogeneity are the same for the Figures 3 and 4, as the order of the effects is not taken into account (Q = 3.29, p = 0.51; I2 = 0%; T2 = 0). What is striking,
though, is the apparent relation between the proportion of bilaterality and the effects of amoxicillin in the differ-ent trials. Hence, based on the modified forest plot (Fig-ure 4) a differential treatment effect for children with and without bilateral otitis is suggested. Similar to the hypo-thetical data presented above, in this clinical example tests for heterogeneity on aggregated data did not concur with the test for heterogeneity on individual patient data.
Discussion and conclusions
Neither the absence nor the presence of heterogeneity (as indicated by the result of heterogeneity tests) in aggre-gated data meta-analyses appears to be indicative for sub-group effects. Irrespective of statistical test results, subgroup effects can be present in the data. A modified forest plot, including an additional (vertical) axis indicat-ing the proportion of the subgroup variable (e.g., the pro-portion of bilateral otitis), may be helpful to identify clinically relevant subgroup effects. Unfortunately, pat-terns in a modified forest plot can only indicate (qualita-tive) subgroup effects. To quantify a subgroup effect, meta-regression analysis can be applied, but validity of results is then subject to several assumptions, and indi-vidual patient data meta-analysis might be needed [12]. The modified forest plot is a qualitative, visual, and easy-to-interpret alternative for exploring potential clinically relevant subgroup effects in studies included in aggre-gated data meta-analyses and should be considered when exploring such effects.
Competing interests
The authors declare that they have no competing interests.
Authors' contributions
All authors contributed to the conception and design of the study, analyses, and interpretation of data. RG drafted the manuscript, and all authors provided critical revision. RG had full access to all of the data in the study and takes responsibility for the integrity of the data and the accuracy of the data analysis. All authors read and approved the final manuscript.
Author Details
1Julius Center for Health Sciences and Primary Care, University Medical Center Utrecht, Utrecht, The Netherlands and 2Department of Epidemiology and Biostatistics, Erasmus Medical Center Rotterdam, Rotterdam, The Netherlands
References
1. Ioannidis JP: Interpretation of tests of heterogeneity and bias in meta-analysis. J Eval Clin Pract 2008, 14:951-7.
2. Borenstein M, Hedges LV, Higgins JPT, Rothstein HR: Identifying and quantifying heterogeneity. In Introduction to Meta-analysis 1st edition. Chichester, UK: John Wiley&Sons; 2009:107-26.
3. Higgins JPT, Thompson SG: Quantifying heterogeneity in a meta-analysis. Stat Med 2002, 21:1539-58.
Received: 28 January 2010 Accepted: 17 May 2010 Published: 17 May 2010
This article is available from: http://www.biomedcentral.com/1471-2288/10/43 © 2010 Groenwold et al; licensee BioMed Central Ltd.
This is an Open Access article distributed under the terms of the Creative Commons Attribution License (http://creativecommons.org/licenses/by/2.0), which permits unrestricted use, distribution, and reproduction in any medium, provided the original work is properly cited.
BMC Medical Research Methodology 2010, 10:43
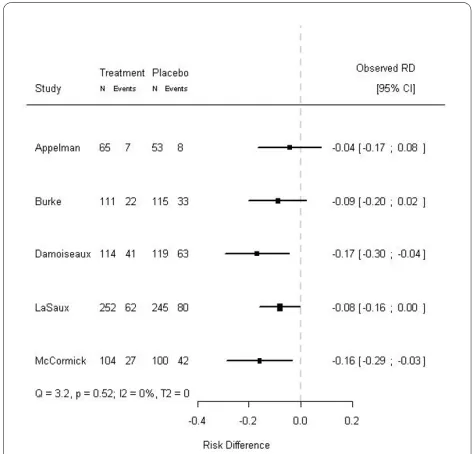
Figure 3 Forest plot of a meta-analysis on five studies on the
ef-fects of amoxicillin in children with acute otitis media. The
treat-ment effects and corresponding 95% confidence intervals of five out of six randomized trials included in an IPD meta-analysis on the effects of amoxicillin in children with acute otitis media are shown [13]. The dashed line (- - - -) indicates no treatment effect. The studies are or-dered chronologically. In the excluded study, bilaterality was not regis-tered.
Figure 4 Modified forest plot of a meta-analysis on five studies on the effects of amoxicillin in children with acute otitis media,
ordered by the proportion of bilateral otitis in each study. The
4. Arends LR, Hoes AW, Lubsen J, Grobbee DE, Stijnen T: Baseline risk as a predictor of treatment benefit: three clinical meta-re-analyses. Stat Med 2000, 19:3497-3518.
5. Cochran WG: Some methods for strengthening the common χ2 tests.
Biometrics 1954, 10:417-51.
6. DerSimonian R, Laird N: Meta-analysis in clinical trials. Control Clin Trials 1986, 7:177-88.
7. Higgins JPT, Thompson SG, Deeks JJ, Altman DG: Measuring inconsistency in meta-analysis. BMJ 2003, 327:557-60. 8. Engels EA, Schmid CH, Terrin N, Olkin I, Lau J: Heterogeneity and
statistical significance in meta-analysis: an empirical study of 125 meta-analyses. Stat Med 2000, 19:1707-28.
9. Higgins JP: Commentary: heterogeneity in meta-analysis should be expected and appropriately quantified. Int J Epidemiol 2008,
37:1158-60.
10. Sterne JA, Juni P, Schulz KF, Altman DG, Bartlett C, Egger M: Statistical methods for assessing the influence of study characteristics on treatment effects in 'meta-epidemiological' research. Stat Med 2002,
21:1513-24.
11. Thompson SG, Sharp SJ: Explaining heterogeneity in meta-analysis: a comparison of methods. Stat Med 1999, 18:2693-708.
12. Groenwold RH, Donders AR, Heijden GJ van der, Hoes AW, Rovers MM:
Confounding of subgroup analyses in randomized trials. Arch Intern Med 2009, 169:1532-4.
13. Rovers MM, Glasziou P, Appelman CL, Burke P, McCormick DP, Damoiseaux RA, Gaboury I, Little P, Hoes AW: Antibiotics for acute otitis media: a meta-analysis with individual patient data. Lancet 2006,
368:1429-35.
Pre-publication history
The pre-publication history for this paper can be accessed here: http://www.biomedcentral.com/1471-2288/10/43/prepub
doi: 10.1186/1471-2288-10-43
Cite this article as: Groenwold et al., Subgroup effects despite
homoge-neous heterogeneity test results BMC Medical Research Methodology 2010,