R E S E A R C H
Open Access
Predictive algorithms for determination of
reflectance data from quantity of pigments
within experimental dental resin composites
Razvan Ghinea
1,4*†, Oscar Pecho
1†, Luis Javier Herrera
2†, Ana Maria Ionescu
1†, Juan de la Cruz Cardona
1†,
María Purificación Sanchez
3†, Rade D Paravina
4†, María del Mar Perez
1,4†From
2nd International Work-Conference on Bioinformatics and Biomedical Engineering (IWBBIO 2014)
Grenada, Spain. 7-9 April 2014
* Correspondence: [email protected] 1Department of Optics, University
of Granada, Campus Fuentenueva s/n, 18071, Granada, Spain
Abstract
Background:Being able to estimate (predict) the final spectrum of reflectance of a biomaterial, especially when the final color and appearance are fundamental for their clinical success (as is the case of dental resin composites), could be a very useful tool for the industrial development of these type of materials. The main objective of this study was the development of predictive models which enable the determination of the reflectance spectrum of experimental dental resin composites based on type and quantity of pigments used in their chemical formulation.
Methods:49 types of experimental dental resin composites were formulated as a mixture of organic matrix, inorganic filler, photo activator and other components in minor quantities (accelerator, inhibitor, fluorescent agent and 4 types of pigments). Spectral reflectance of all samples were measured, before and after artificial chromatic aging, using a spectroradiometer. A Multiple Nonlinear Regression Model (MNLR) was used to predict the values of the Reflectance Factors values in the visible range (380 nm-780 nm), before and after aging, from % Pigment (%P1, %P2, %P3 and %P4) within the formulation.
Results:The average value of the prediction error of the model was 3.46% (SD: 1.82) across all wavelengths for samples before aging and 3.54% (SD: 1.17) for samples after aging. The differences found between the predicted and measured values of the chromatic coordinates are smaller than the acceptability threshold and, in some cases, are even below the perceptibility threshold.
Conclusions:Within the framework of this pilot study, the nonlinear predictive models developed allow the prediction, with a high degree of accuracy, of the reflectance spectrum of the experimental dental resin composites.
Background
It has been reported that the composite restorative materials are one of the many successes of modern biomaterials research due to their capability to replace biological tissue in both appearance and function [1]. In a recent review of treatment considera-tions for esthetic restoraconsidera-tions it has been pointed out that at least half of the posterior direct restoration placement now rely on composite materials [2]. Currently, methacry-late resin formulations dominate both the commercial market and research studies. The resin phase is composed primarily of dimethacrylate monomers (typically selected from Bis-GMA, BisEMA, and/or UDMA or a mixture of them) usually mixed with a low-viscosity reactive diluents (most commonly TEGDMA). These base monomers result in restorative materials with excellent mechanical properties, rapid polymeriza-tion, and low shrinkage.
Several authors implemented the use of experimental dental composites, as a contin-uous effort to understand the interrelationships among composition, resin viscosity, degree of conversion, shrinkage, flexural strength, fracture toughness, water sorption and solubility, etc. This type of materials were used to study the physical and mechani-cal properties of a new methacrylate monomer through comparisons with a commonly used Bis-GMA monomer [3], the effects of ceramic and porous fillers on the mechani-cal properties [4], the influence of irradiant energy on the degree of conversion, poly-merization rate and shrinkage stress [5], the effect of co-initiator ratio on the polymer properties [6] or the curing efficiency of dental resin composites [7]. Furthermore, the use of a fluorescent agent was incorporated in the chemical formulation to study the influence of the fluorescent whitening agent on the fluorescent emission of resin composites [8].
Color prediction in dentistry is a research area that has barely been explored. So far it has been proven that the polymerization dependent color changes in resin composites can be successfully predicted using multivariable linear models of statisti-cal inference [9]. Also, in a recent study, the color change after tooth bleaching was predicted using a novel fuzzy logic model [10] while other authors were able to pre-dict the final color of 25 opaque feldspathic dental ceramic specimens fabricated by mixing six different pure shades in different concentrations [11].
The reflectance spectra is a physical characteristic of a sample, which provides valu-able information with respect to the interaction of light (incident radiation) with the sample. Furthermore, based on the values of the reflectance factors for each wave-length of the visible spectrum, the final color of the sample under any available illumi-nant can be calculated. Therefore, being able to estimate (predict) the spectrum of reflectance of a biomaterial, especially in the case of materials whose color and appear-ance are fundamental for its clinical success (as it is the case of dental resin compo-site), could be a very useful tool for the industrial development of these type of materials. However, to the best of our knowledge, there is no available study on reflec-tance predictions for experimental dental resin composites.
Methods
Experimental dental resin formulation
For the development of this study, 49 different types of experimental dental resin com-posites (n = 3) were formulated as a mixture of organic matrix, inorganic filler, photo activator and other components in minor quantities: accelerator, inhibitor, fluorescent agent and four types of pigments (in various mixtures) according to available standards and literature [8], and following standard manufacturing procedures. The relative quantities of each chemical component within the experimental resin composites are listed in Table 1.
A total of 49 different mixtures of pigments were formulated by varying the relative amount of each of the four pigments. All chemical components were weighted using a high precision digital scale (BL60S, Sartorius AG, Goettingen, Germany) and carefully hand-mixed until a homogeneous mixture was obtained. All specimens were cylinder shaped with a diameter of 20 mm and 1.5 mm thickness. Each of the 147 specimens was packed in a custom built silicon mold in a glass plate sandwich with a mylar strip on both sides. The specimens were light cured at 1100 mW/cm2 for 60 seconds on each side using a LED light-curing unit (BluePhase, Ivoclar Vivadent AG, Schaan, Liechtenstein). In order to mimic a clinical situation and before storage, all samples were polished using a one-step diamond micro-polishing system (PoGo, Dentsply, USA), by applying light intermittent pressure at moderate speed during 40s.
All samples underwent an artificial chromatic aging. Specimens were placed inside an artificial aging chamber (Suntest XXL, ATLAS, USA) and subjected to artificial chro-matic aging. The artificial aging cycle was defined as a 102 minutes dry and 18 minutes of water spray both under an artificial daylight simulator equivalent to CIE D65 Illumi-nant at 38 ± 3°C constant temperature and 50 ± 10% relative humidity, as described by ISO 4892-2 A1 and ISO 7491 Standards [12,13].
Reflectance measurements
The reflectance spectrum in the 380 nm-780 nm range of all specimens was measured inside a completely dark room using a spectroradiometer (PR 670, PhotoResearch,
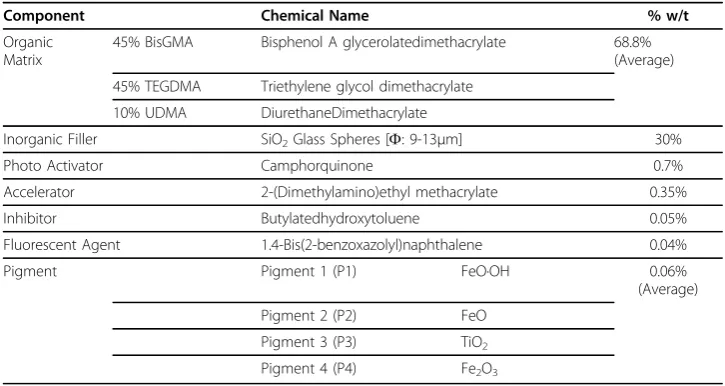
Table 1. Chemical components and their relative percentages by weight (% w/t) within the total mixture used to formulate the resin composites from this study
Component Chemical Name % w/t
Organic Matrix
45% BisGMA Bisphenol A glycerolatedimethacrylate 68.8% (Average)
45% TEGDMA Triethylene glycol dimethacrylate
10% UDMA DiurethaneDimethacrylate
Inorganic Filler SiO2Glass Spheres [F: 9-13µm] 30%
Photo Activator Camphorquinone 0.7%
Accelerator 2-(Dimethylamino)ethyl methacrylate 0.35%
Inhibitor Butylatedhydroxytoluene 0.05%
Fluorescent Agent 1.4-Bis(2-benzoxazolyl)naphthalene 0.04%
Pigment Pigment 1 (P1) FeO·OH 0.06%
(Average)
Pigment 2 (P2) FeO
Pigment 3 (P3) TiO2
USA) and a spectrally calibrated reflectance standard (SRS-3, PhotoResearch, USA). Specimens were placed on a custom built sample holder, 40 cm away from the spec-troradiometer and illuminated using a Xe-Arc Light Source (Oriel Research, Newport Corporation, USA). The illuminating/measuring geometry corresponded to CIE 45°/0°. The aperture of the spectroradiometer was set to 1°, which allowed the measurement of a central spot (measuring field) of the specimen of approximately 0.7 cm.
Short-term repeated reflectance measurements without replacement were performed and each sample was measured three times. As three samples of each group were pro-duced, this gave a total of 9 recording for each type and the results were averaged. This procedure was performed before and after the chromatic artificial aging procedure.
Color and color difference calculations
Color calculations (chromatic coordinates CIE L*, a*and b*) for both real and predicted reflectance spectra were performed in base of the CIE D65 Standard Illuminant and the CIE Colorimetric 2° Standard Observer assumptions [14].
The total color differences between the predicted and the measured (real) values of the CIE L*a*b* chromatic coordinates were calculated according to the CIELAB color difference formula (E∗ab):
E∗ab=
L∗2+a∗2+b∗2
and the CIEDE2000 total color difference formula (ΔE00), which corrects for the
non-uniformity of the CIELAB color space for small color differences under reference conditions:
E00
L KLSL
2 +
C KCSC
2 +
H KHSH
2 +RT
C KCSC
H KHSH
where ΔL’, ΔC’ andΔH’are the differences between the two samples forming the pair in lightness, chroma and hue, and RT is the rotation function which accounts for
the interaction between chroma and hue differences in the blue region. The weighting functions SL, SC andSHadjust the total color difference for variation in the location of the color difference pair inL’, a’andb’coordinates and the parametric factorsKL, KC and KHare correction terms for experimental conditions. For calculations made in this study, all the parametric factors were set to 1. All the discontinuities due to mean hue computation and hue-difference computation pointed out and characterized by Sharma and collaborators [15] were taken into account when the calculations with the CIEDE2000 color difference formula were performed.
Design of the predictive models
A Multiple Nonlinear Regression Model (MNLR) was used to predict the values of the Reflectance Factors values in the visible range (380 nm-780 nm) before and after aging from % Pigment (%P1, %P2, %P3 and %P4) within the formulation.
The equation describing the model is a 4th Order Polynomial, as described by:
Y=pr1 +pr2·X1+pr3·X2+pr4·X3+pr5·X4+pr6·X12+pr7·X22+pr8·X23+pr9·X24+
+pr10·X31+pr11·X 3
2+pr12·X 3
3+pr13·X 3
4+pr14·X 4
1+pr15·X 4
2+pr16·X 4
3+pr17·X 4 4
where:
- Y is the predicted variable: Reflectance Factors values in the visible range (380 nm-780 nm) at 2 nm step the before and after aging;
- Xiare the input variables: %P1, %P2, %P3 and %P4;
- pr1 ... pr17 are the parameters of the model.
The models were built using the Training Group and tested using the Validation Group. The model was considered to be accurate after 200 iterations were performed and/or a convergence of 0.00001 was achieved.
A total of 402 models (one for each Reflectance Factor before and after aging) were designed. All the Multiple Nonlinear Regression predictive models were designed using a commercial software (XLSTAT, Addinsoft, USA).
Results and discussion
In dentistry, it would be ideal to achieve a restoration that has identical colors as the tooth structure under various illumination conditions, within at least acceptable limits, but more preferably within limits of perceived color difference [16]. Although the importance of the pigments on the final color and appearance of the dental resin com-posite is well known, there is no research study available which made use of coloring pigments when formulating the experimental dental resin composites. Therefore, in this study, the use of pigments was included in the chemical formulation of the resin composites.
The research in science and biomedical applications often involves using controllable and/or easy to measure variables (input factors) to explain, regulate or predict the behavior of other variables (output factors or dependent variables). When dealing with a reduced number of input factors which are not significantly redundant and have a strong relationship with the output variables, the MNLR is one of the best options to take into account for modeling the data.
The correlation between the input variables of the model (in this case, the Reflec-tance Factors at 2 nm steps in the 380 nm-780 nm interval before and after the artifi-cial aging) and the output variables of the model (in this case, the percentage of each type of Pigment used - %P1, %P2, %P3 and %P4), was carried out as an initial step. The results obtained for the Pearson Correlation coefficient are graphically presented in Figure 1.
Group) before aging, there is a strong inverse correlation between the quantity of the fourth Pigment (%P4) and reflectance factors of wavelengths between 525 nm-650 nm. This implies that higher quantities of Pigment 4 within the mixture of the experimen-tal resin composite will decrease the values of the reflectance factors between the specified interval, affecting the lightness value of the sample and generating an orange-reddish color shift. Also, a strong correlation usually is associated with increased per-formance of the predictive model, but no conclusion should be drawn before analyzing the other parameters of the quality of fit, such as goodness of fit or relative residuals.
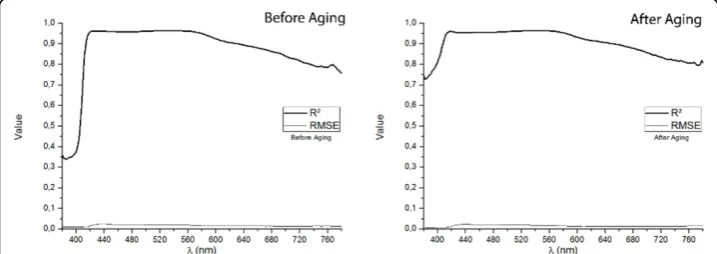
The goodness of fit, in terms of R2 and the Root Mean Square Error (RMSE) for the predictive models of the Reflectance Factors for wavelengths between 380 nm-780 nm, both before and after the artificial aging, is displayed on Figure 2. Numerical measures of goodness of fit are divided into two types: measures of deviation from the real (mea-sured) values and measures of how well the trend relative magnitudes are predicted. If only one type of these measurements is used, only one of these two types of informa-tion is being captured, and that it is why several researchers recommend the use of a combination of R2 for trend relative magnitude and RMSE for deviation from exact data location [17]. We found high values (>0.7) of the Coefficient of Determination for
Figure 1Pearson Correlation Coefficients between 380 nm-780 nm Reflectance Factors before and after aging and % Pigment.
the predictive models of the Reflectance Factors for wavelengths higher than 425 nm, both before and after aging. However, it seems that the predictive model works best for wavelengths between 425 nm and 600 nm, since in this interval the R2 values are higher than 0.9. This mean that future works should be focused on improving the MNLR models in order to obtain better performance for larger wavelengths. It should be noted that, if we assess the quality of the predictive model on the exclusive basis of the value of R2, the model performs better for aged samples, since the values obtained for the Coefficient of Determination are slightly higher. Both before and after aging, the RMSE values are very low, in accordance to the interval of the studied variable. All these results support the quality of the Multiple Nonlinear Regression Predictive model designed and serve to ensure the proper development of the method.
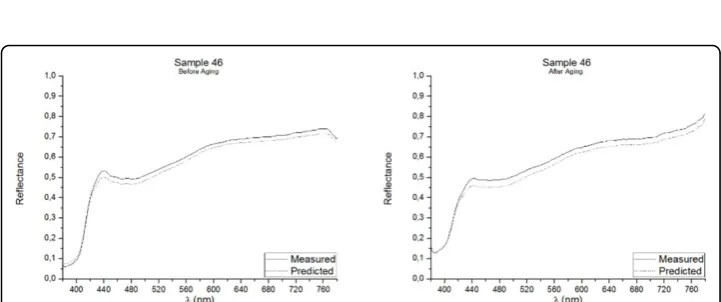
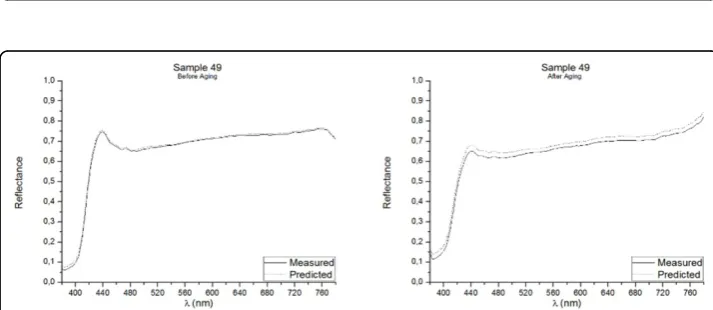
One of the best methods for assessing the accuracy of point predictions is to use overlay scatter plots and overlay line graphs. In these graphical forms, the model and data are overlaid on the same graph, allowing a direct comparison of the real (mea-sured) data and the predicted values. The reflectance spectrum of the five samples included in the Validation Group, as measured with the PR-670 Spectrorradiometer and as predicted with the Multiple Nonlinear Regression model, both before and after aging, are presented in Figures 3, 4, 5, 6, 7. Visual displays of goodness of fit are useful for a rough estimate of the degree of fit and for indicating where the fits are most pro-blematic. Visual displays are also useful for diagnosing a variety of types of problems (e.g., systematic biases in model predictions). Noteworthy, the human visual system is
Figure 3Real (measured) and Predicted spectral reflectance of Sample 45 between 380 nm-780 nm before aging (left) and after aging (right).
not particularly accurate in assessing small to moderate differences in the fits of model to data.
Our visual system is also subject to many visual complications that can produce sys-tematic distortions in the visual estimates of the quality of a fit [17]. However, as it can be observed in Figures 3, 4, 5, 6, 7, the quality of the fit is excellent for almost the entire spectrum, providing accurate estimates of the Reflectance Factors for all wavelengths.
Figure 5Real (measured) and Predicted spectral reflectance of Sample 47 between 380 nm-780 nm before aging (left) and after aging (right).
Figure 6Real (measured) and Predicted spectral reflectance of Sample 48 between 380 nm-780 nm before aging (left) and after aging (right).
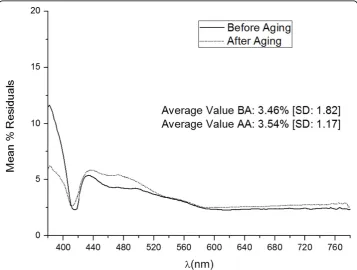
In order to assess the overall quality of the prediction capacity of the proposed mod-els, the mean value over the 5 samples (relative to the value of the variable - Reflec-tance Factor) along the 380 nm-780 nm interval was calculated. The results for samples before and after the aging procedure was applied are schematically shown in Figure 8. For samples before aging, the average value of the prediction error of the model was 3.46 ± 1.82%, showing higher values for shorter wavelengths and consider-ably lower values for longer wavelengths In the case of the samples after aging, the average value of the prediction error was 3.54 ± 1.17%, exhibiting, as the case of sam-ples before aging, lower error for longer wavelengths. The high errors obtained for short wavelengths are probably caused by the instability of the measuring system (the spectrorradiometer) which presents variability in the measured data for wavelengths lower than 400 nm. This variability is expected to affect the quality of the predictive model, since no clear pattern in the input data can be established, so the provided out-put variables are distant from the measured ones.
Several MNLR predictive models have been developed, which accurately predicted the reflectance spectrum of the manufactured experimental dental resin composites. These models are very helpful when, in a laboratory situation, the chromatic behavior of the samples needs to be controlled. In this study, we considered the pigments as the main responsible (not exclusive) of the final color of the composites, and therefore we centered the study on the influence of the four types of pigments on the final color of the experimental dental resin composites.
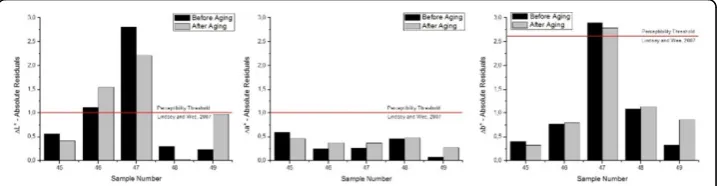
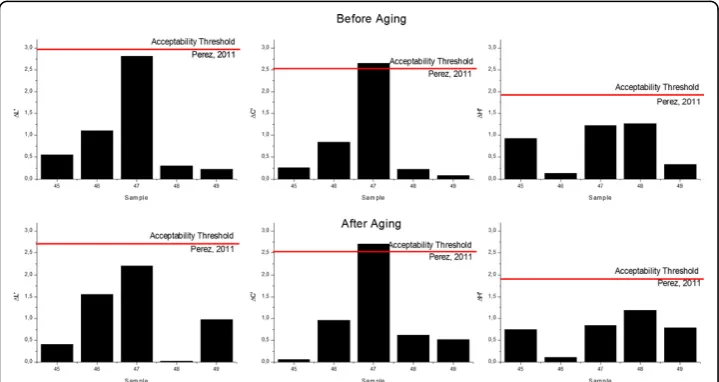
In Figure 9 are plotted the absolute values of the Residuals for CIE L*, a*and b* coordinates before and after aging. Among the three chromatic coordinates studied,
for all samples included in the Validation Group, the CIE a* coordinate showed the smallest residuals, with absolute residual values smaller than 0.6 in all cases. When analyzing absolute residuals, the magnitude of the studied variable it must be taken into account, since the a* chromatic coordinate vary within a scale of 2-6 units, while the b*coordinate can reach double superior values and the L*coordinate values are within the 80-85 units range. Therefore, obtaining very low values of residuals for this particular variable it is not so surprising, and the differences between the predicted and the measured values must be evaluated from a more objective point of view, such as comparisons with the chromatic perceptibility thresholds in dentistry. In the case of the yellow-blue axis of the color space (b*), the predicted values matched very closely the measured ones. The smallest residual registered was 0.319, while the greatest one was 2.787. In the case of the L*chromatic coordinate the absolute differences between the measured and the predicted values ranged between 0.232 and 2.811 units.
In a study on the perceptibility and acceptability of tooth color differences using computer-generated pairs of teeth with simulated gingival displayed on a calibrated monitor, Lindsey and Wee [18] established that ΔL* = 1.0, Δa* = 1.0 andΔb* = 2.6 units are considered as 50:50% perceptibility threshold for the human eye. In our study, the differences between the predicted and the measured values of the chromatic coordinates exceeded the lightness threshold for 40% of the studied samples (both before and after aging). For the b* chromatic coordinate, 80% of the samples presented differences which were unable to be perceived by a human observer with normal color vision, while for the red-green axis (a* coordinate) all the studied samples exhibited differences bellow the perceptibility threshold for this coordinate, independently if the sample were analyzed before or after the aging procedure was applied.
The study on the accuracy of the MNLR predictive models can be extended with the calculation of the total color differences (in terms ofΔE00 andE∗ab total color
differ-ences), between the predicted and measured values of the chromatic coordinates, and consequently evaluate them through comparisons with the available perceptibility and acceptability thresholds for dentistry [19]. The total color differences in terms ofΔE00
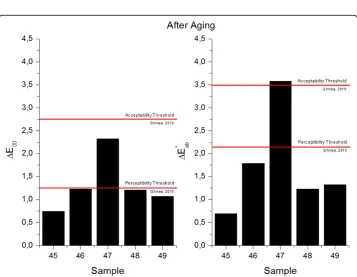
and E∗ab between the predicted and measured values for the samples included in the Validation Group before aging are presented in Figure 10 while the values obtained for samples after aging are presented in Figure 11. In the case of Sample 47, the differ-ences found were higher than both thresholds, probably due to the high discrepancies between the predicted and measured value of lightness (L*). After the artificial aging procedure was applied, if the differences between the predicted and measured values are computed with the newest ΔE00 formula, all values fall within the acceptability
threshold, and in 75% of the studied cases, the differences are even smaller than the
Figure 10Total color differences in terms ofΔE00(left) andE∗ab (right) between the predicted
and measured values for samples in the Validation Group before aging.
Figure 11Total color differences in terms ofΔE00(left) andE∗ab (right) between the predicted
perceptibility threshold. If, instead, the CIE1976 total color difference formula is used (E∗ab), for Sample 47, similar to what happens before aging, the value of the differ-ence is higher than both thresholds, while for the other 4 samples included in the Vali-dation Group, the calculated total color differences are smaller than both perceptibility and acceptability thresholds.
The absolute values of the differences in lightness (ΔL’), chroma (ΔC’) and hue (ΔH’) between the predicted and the measured values for the five samples included in the validation group (both before and after aging) are presented in Figure 12.
The visual 50:50% acceptability thresholds for lightness, chroma and hue in dentistry were established as ΔL’= 2.92,ΔC’= 2.52 and ΔH’= 1.90 units [20]. The differences found between the predicted and the measured values are smaller than the acceptabil-ity thresholds for lightness and hue, independently if the samples are analyzed before or after the aging procedure was applied. In the case of chroma differences, for one of the samples included in the Validation Group, the computed difference exceeded the acceptability threshold, while all the other four samples exhibited values considerably lower than the threshold.
It has to be mentioned that the range of application of the proposed predictive models is limited, since they are designed to work exclusively with the experimental dental resins developed in this study. It is necessary to expand the present work with further studies on multiple areas, such as varying the materials used for the for-mulation, varying amounts of both the organic matrix and the inorganic filler as well as the quantities of the other components used in the chemical formulation.
It would also be interesting to study more carefully the behavior of the different pig-ments, through a wider range of combinations between them and, on the other hand, other pigments can be used for colorimetric formulations. Another development path for future studies is an improved experimental design, in terms of better coverage of the dental color space with the manufactured samples. A proper distribution of the samples within the area of interest of the color space will allow the use of newer, more accurate and reliable predictive methods, such as Fuzzy Logic.
However, one should not underestimate the importance of the exact knowledge of the reflectance spectrum of the samples to be analyzed, since by knowing the reflec-tance factor values for any wavelength within the visible spectrum (380 n-780 nm) we are able to calculate the values of the chromaticity coordinates under any illuminant (not only the daylight simulator - CIE D65) and for any CIE Colorimetric Standard Observer. These calculations have the potential to provide important additional infor-mation, depending on the objective of the study. In this sense, if the study is intended to cover a widely range of colorimetric coordinates under different Standard Illumi-nants and with different Standard Observers, it is advisable to design predictive models for reflectance factors at each wavelength, which will allow to make various calcula-tions based on the equacalcula-tions provided by the International Commission on Illumina-tion (CIE).
Soft science applications involve so many variables that it is not practical to seek a model which explicitly relates them all. The Multiple Nonlinear Regression is one of the possible solutions and although it is continuously evolving as a statistical modeling technique, there are other fields which can provide also good results, such as principal components regression, maximum redundancy analysis, methods which handle the colinearity in regression, such as the ridge regression [21], or newer methods, such as the neural networks [22]. The neural networks are probably the strongest competitors for MNLR in terms of flexibility and robustness of the predictive models, but they do not explicitly incorporate a linear extraction of latent factors - that is dimension reduction [23].
Conclusions
Within the framework of this preliminary study, the nonlinear predictive models devel-oped allow the prediction, with a high degree of accuracy, of the reflectance spectrum of the experimental dental resin composites (average error <3.54% across all wave-lengths of the visible spectrum). The differences found between the predicted and mea-sured values of the chromatic coordinates are smaller than the acceptability threshold established for this type of materials and, in some cases, are even below the percept-ibility threshold. These results open the way for custom design of dental resin compo-sites, with multiple direct and immediate clinical applications, such as the manufacture of dental shade guides, development of new dental materials, and finally, performing dental restorations that perfectly match the color of their surrounding dental struc-tures. However, before bringing these materials to the clinic, the present study has to be complemented with studies on other physical and chemical properties of the mate-rial, such as polymerization shrinkage, hardness, wear resistance, degree of polymeriza-tion, temporal and thermo chromatic stability, etc.
Competing interests
The authors declare that they have no competing interests.
Authors’contributions
All authors contributed equally to this work.
Acknowledgements
Declarations
Publication of this article was supported by Spanish Ministry of Economy and Competitiveness MAT2013-43946-R Grant.
This article has been published as part ofBioMedical Engineering OnLineVolume 14 Supplement 2, 2015: Select articles from the 2nd International Work-Conference on Bioinformatics and Biomedical Engineering (IWBBIO 2014). The full contents of the supplement are available online at http://www.biomedical-engineering-online.com/supplements/14/S2.
Authors’details
1Department of Optics, University of Granada, Campus Fuentenueva s/n, 18071, Granada, Spain.2Department of
Computer Architecture and Computer Technology, University of Granada, C/ Periodista Daniel Saucedo Aranda s/n, 18071, Granada, Spain.3Department of Inorganic Chemistry, University of Granada, Campus Fuentenueva s/n, 18071, Granada, Spain.4Houston Center for Biomaterials and Biomimetics, Department of Restorative Dentistry and Prosthodontics, University of Texas, School of Dentistry, 7500 Cambridge St., Houston, TX 77054, USA.
Published: 13 August 2015
References
1. Cramer NB, Stansbury JW, Bowman CN:Recent advances and developments in composite dental restorative materials.Journal of Dental Research2011,90(4):402-416.
2. Sadowsky SJ:An overview of treatment considerations for esthetic restorations: a review of the literature.Journal of Prosthetic Dentistry2006,96(6):433-442.
3. Atai M, Nekoomanesh M, Hashemi SA, Amani S:Physical and mechanical properties of an experimental dental composite based on a new monomer.Dental Materials2004,20(7):663-668.
4. Zandinejad AA, Atai M, Pahlevan A:The effect of ceramic and porous fillers on the mechanical properties of experimental dental composites.Dental Materials2006,22(4):382-387.
5. Calheiros FC, Daronch M, Rueggeberg FA, Braga RR:Influence of irradiant energy on degree of conversion, polymerization rate and shrinkage stress in an experimental resin composite system.Dental Materials2008, 24(9):1164-1168.
6. Schneider LF, Cavalcante LM, Consani S, Ferracane JL:Effect of co-initiator ratio on the polymer properties of experimental resin composites formulated with camphorquinone and phenyl-propanedione.Dental Materials2009, 25(3):369-375.
7. Schneider LF, Cavalcante LM, Prahl SA, Pfeifer CS, Ferracane JL:Curing efficiency of dental resin composites formulated with camphorquinone or trimethylbenzoyl-diphenyl-phosphine oxide.Dental Materials2012, 28(4):392-397.
8. Park MY, Lee YK, Lim BS:Influence of fluorescent whitening agent on the fluorescent emission of resin composites. Dental Materials2007,23(6):731-735.
9. Ghinea R, Ugarte L, Ionescu AM, Cardona JC, Perez MM:Development of a linear model to predict polymerization dependent color changes.Proceedings of SCADNewport Beach, USA; 2010.
10. Herrera LJ, Pulgar R, Santana J, Cardona JC, Guillen A, Rojas I, Perez MM:Prediction of color change after tooth bleaching using fuzzy logic for Vita Classical shades identification.Applied Optics2010,49(3):422-429.
11. Wee AG, Chen WY, Johnston WM:Color formulation and reproduction of opaque dental ceramic.Dental Materials 2005,21(7):665-670.
12. ISO 4892-2:2013. Plastics - Methods of exposure to laboratory light sources - Part 2. Xenon-arc lamps. International Organization for Standardization; 2013.
13. ISO 7491:2000. Dental materials–Determination of colour stability. International Organization for Standardization; 2000.
14. CIE - International Comission on Illumination: Technical Report: Colorimetry. Vienna, Austria; 2004.
15. Sharma G, Wu W, Dalal E:The CIEDE2000 color-difference formula: Implementation notes, supplementary test data, and mathematical observations.Color Research and Application2004,30(1):21-30.
16. Johnston WM:Color measurement in dentistry.Journal of Dentistry2009,37(SUPPL. 1):e2-e6.
17. Schunn C, Wallach D:Evaluating goodness-of fit in comparison of models to data.Psychologie der Kognition: Reden and Vorträge anlässlich der Emeritierung von Werner Tack, University of Saarland Press, Saarbrücken, Germany; 2005. 18. Lindsey DT, Wee AG:Perceptibility and acceptability of CIELAB color differences in computer-simulated teeth.
Journal of Dentistry2007,35(7):593-599.
19. Ghinea R, Perez MM, Herrera LJ, Rivas MJ, Yebra A, Paravina RD:Color difference thresholds in dental ceramics. Journal of Dentistry2010,38(SUPPL. 2):e57-e64.
20. Perez MM, Ghinea R, Herrera LJ, Ionescu AM, Pomares H, Pulgar R, Paravina RD:Dental ceramics: A CIEDE2000 acceptability thresholds for lightness, chroma and hue differences.Journal of Dentistry2011,39(SUPPL. 3):e37-e44. 21. Hoerl AE, Kennard RW:Ridge Regression - Biased Estimation for Nonorthogonal Problems.Technometrics2000,
b42(1):80-86.
22. Haykin S:Neural networks: A comprehensive foundation.New York: MacMillan; 1994.
23. Frank IE, Friedman JH:A Statistical View of Some Chemometrics Regression Tools.Technometrics1993,35(2):109-135.
doi:10.1186/1475-925X-14-S2-S4