S O F T W A R E R E V I E W
Open Access
SVAw - a web-based application tool for
automated surrogate variable analysis of gene
expression studies
Mehdi Pirooznia
1, Fayaz Seifuddin
1, Fernando S Goes
1, Jeffrey T Leek
2and Peter P Zandi
1,3*Abstract
Background:Surrogate variable analysis (SVA) is a powerful method to identify, estimate, and utilize the components of gene expression heterogeneity due to unknown and/or unmeasured technical, genetic,
environmental, or demographic factors. These sources of heterogeneity are common in gene expression studies, and failing to incorporate them into the analysis can obscure results. Using SVA increases the biological accuracy and reproducibility of gene expression studies by identifying these sources of heterogeneity and correctly accounting for them in the analysis.
Results:Here we have developed a web application called SVAw (Surrogate variable analysis Web app) that provides a user friendly interface for SVA analyses of genome-wide expression studies. The software has been developed based on open source bioconductor SVA package. In our software, we have extended the SVA program functionality in three aspects: (i) the SVAw performs a fully automated and user friendly analysis workflow; (ii) It calculates probe/gene Statistics for both pre and post SVA analysis and provides a table of results for the regression of gene expression on the primary variable of interest before and after correcting for surrogate variables; and (iii) it generates a comprehensive report file, including graphical comparison of the outcome for the user.
Conclusions:SVAw is a web server freely accessible solution for the surrogate variant analysis of high-throughput datasets and facilitates removing all unwanted and unknown sources of variation. It is freely available for use at http://psychiatry.igm.jhmi.edu/sva. The executable packages for both web and standalone application and the instruction for installation can be downloaded from our web site.
Introduction
Accurate analysis of high-throughput data in molecular biology is complicated because of the presence of under-lying factors that cause unwanted heterogeneity in the data. An inherent issue with microarray expression stud-ies is that of artefactual or confounded variation. In addition to the biological factors that are of interest to the researcher, gene expression levels are affected by other factors that are both technical and biological. A typical example is a batch effect, which can occur when some samples are processed differently than others [1]. These heterogeneity factors, also commonly known as
batch effect, can range from genetic and environmental variables to demographic factors [2,3]. The impact of these factors may vary from a deviation in the outcome to potentially completely compromising the statistical or biological validity of a study [4]. The sva method devel-oped by Leeket al.[4,5] addresses this issue by identify-ing, estimating and removing unwanted sources of variation in high-throughput experiments. The sva func-tion estimates surrogate variables, which are covariates constructed directly from high-dimensional data, and then uses these variables in downstream analyses such as differential expression analysis. Here we employed the
Leek et al. sva algorithm [4,5] and implemented a web
application, called SVAw, to perform fully automated analysis in a user friendly web browser view. SVAw can also be downloaded as a fully functional automated standalone application.
* Correspondence:[email protected] 1
Department of Psychiatry and Behavioral Sciences, Johns Hopkins School of Medicine, Baltimore, MD, USA
3
Department of Mental Health, Johns Hopkins Bloomberg School of Public Health, Baltimore, MD, USA
Full list of author information is available at the end of the article
SVAw is a tool that enables researchers to utilize Sur-rogate Variable Analysis when analyzing high throughput genomic data to capture such heterogeneities in the dataset that can potentially lead to biased analysis of the data. Additionally, the web server makes the Surrogate Variable Analysis more accessible to researchers with no programming background in order to identify and con-trol for potential heterogeneity in their genomics data. The SVAw calculates probe/gene statistics such as the fold change and p-value for both pre (unadjusted) and post sva analysis (adjusted with sva) and generates a comprehensive report, including graphical comparison of the outcome.
Results
A typical gene expression analysis involves identifying differential expressed genes among various experimen-tal conditions. Statistical analysis will usually calculate the magnitude of fold changes as well as measures of statistical significance (p-values). SVAw generates pre-and post-Surrogate variable Analysis p-values pre-and fold changes of the analyzed data. The statistical and graph-ical visualization of the data before and after the SVA procedure gives the user a clear sense of the extent of het-erogeneity in their dataset. In particular, visualization of the data using three different graphical representations: 1) volcano plot; 2) MA plot and 3) histogram of p-values, draws the user’s attention to the different aspects of statis-tical analysis. The SVAw architecture simplifies the ana-lysis of gene expression data by executing a computational workflow on a set of data uploaded by user. For a midsize dataset (50 samples) SVAw can process up to 1mb of raw data per minute using both the web and standalone appli-cations on a quad core AMD processor with 8GB mem-ory. The SVAw web server is currently able to process up to a 16MB input file size.
1. Data format
1.1. Input data: For SVAw, there are two required input files from the user: Expression and Factors file. The expression file is am x nexpression matrix withnarrays formgenes/probesets/probes. Factors file is am x 2matrix withmindividuals/ arrays divided into groups. Column1 is the unique identifier (ID) and column2 is the group status as 1 stand for“Group1 arrays”(for e.g. "cases") and 0 for
“Group2”arrays (for e.g. "controls").
1.2. Output: SVAw has a comprehensive output. All text files will be in plain-text in tabular format with each row terminated by a new-line character. These files can be easily used in spreadsheet applications and database programs (such as SQL databases) for further analysis. Output files include:
1.1.1. Surrogate_Variable.txt: Anm x nmatrix with m individuals/arrays and n surrogate variables predicted for the data set by SVAw. 1.1.2. Probe_Statistics.txt: A table of results for
regression of gene expression on the primary variable of interest before and after correcting for surrogate variables. This file includes the following columns (fields) for each gene/ probesets/probes:
[pre-sva] calculations:
Coefficient unadjusted: linear regression coefficient from the fitted model before sva adjustment.
Fold change: up or down regulated
(unadjusted), log2 ratio of mean expression of Group1 (e.g., "cases") vs. Group2 (e.g., "controls") from the fitted model before sva adjustment. p_unadjusted: p-value for the test of significance comparing the mean expression levels between groups (e.g., Group1 or“cases” vs. Group2 or“controls”) for all genes/ probesets/probes from the fitted model before sva adjustment.
[post-sva] calculations:
surrogate variables included as "covariates" in the linear regression model of gene
expression on the primary variable of interest: Coefficient after sva adjusted.
Fold change: up or down regulated after adjustment with sva
p_adjusted: p-value for the test of significance after sva adjustment
1.1.3. Probe_Statistics_Significants.txt: A subset of the Probe_Statistics.txt table (above) of results by significance (p-value [post-sva] < 0.05). All genes/probesets/probes meeting this criterion are shown in this table.
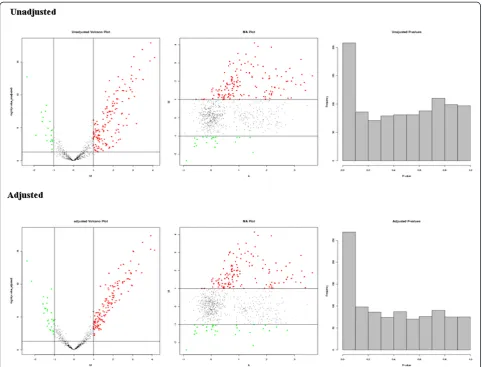
1.1.4. Unadjusted and Adjusted Graph (Figure1) files in PNG format: These files contains three plots:
▪Volcano Plot: Plot to compare the size of the fold change to the statistical significance level. The x axis is the fold change between the two groups (on a log scale) indicating biological impact of the change, and the y axis represents the p-value for at-test of differences between samples (on a negative log scale) indicating the statistical evidence, or reliability of the change.
▪MA Plot: M (the intensity ratio) vs. A (the average intensity)
▪Histogram: Histograms of the unadjusted and the sva adjusted p-values from
differential expression analysis
Piroozniaet al. Source Code for Biology and Medicine2013,8:8 Page 2 of 6
1.2.5.Report.htm: A brief report of the analysis in html format.
2. Sample Tests
We tested the functionality of SVAw using well-known datasets from gene expression experiments with different sizes of inputs, as well as simulated datasets. Some of the datasets include genome-wide expression studies using autopsy brain samples from the Stanley Medical Research Institute (SMRI) comparing bipolar and depression cases and controls. Details of the methods and results are provided online at Metamoodics web resource [6].
Methods
1. SVA
We employed Surrogate variable estimation based on the algorithms in Leek and Storey [4,7]. The
2. Univariate linear regression
Univariate linear regression [10] analysis is first applied and linear regression coefficients are obtained from the fitted models. We then calculate the log2 ratio (Fold Change (FC)) of mean
expression levels for group1 vs. group2 from the fitted model before sva adjustment. P-values for the test of significance for each genes/probesets/probes comparing mean expression levels between the two groups is also estimated from the fitted model before sva adjustment.
3. Multivariate linear regression
We incorporate the surrogate variables as cofounders and perform multivariate linear regression [10]. FCs and p-values for each genes/ probesets/probe are then calculated from the fitted models after the sva adjustment.
Implementation
1. Web Server System Architecture
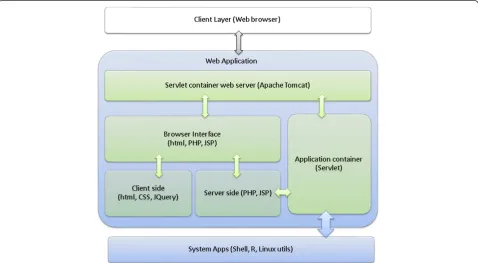
The Web Server is designed and implemented on the basis of two-tier client–server architecture; a presentation layer or front-end and a business layer or back-end. Figure2illustrates the core
components of the system. Java Servlet container Apache's Jakarta Tomcat application server [11] has
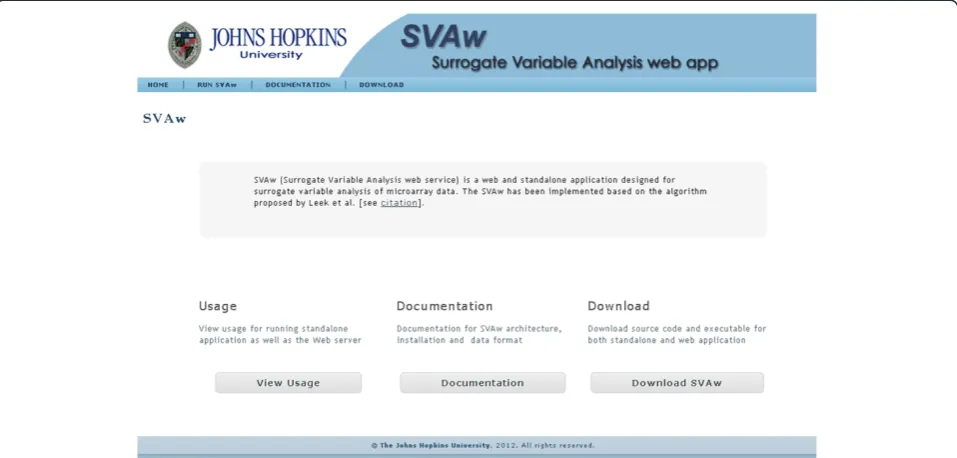
been employed to take advantage of state-of-the-art Java technologies [12] in order to provide effective client server-side application execution. The front-end web application program (Screenshot shown in Figure3), constructed based on JQuery [13], and Java Server Page (JSP) 2.0 technology [14], is in charge of task submissions and results displays. The back-end program consists of series of servlets [15] that communicates with system resources and utilities. Several open source applications and technologies [16-19] have been employed to enhance the flexibility and extendibility of this component. Open source R statistical analysis packages [18,19] are mainly in charge of the data analysis and processing. The web application is hosted on Apache Tomcat web server [20] on a Red Hat Linux operating system [21]. A war file (Web application ARchive) [22] format can be downloaded from our website and imported to any Servlet container web server.
1.1. Download and install the pre-requirements: Download and install R package [18].
Download and install“corpcor”R package [23]: wgethttp://cran.r-project.org/src/contrib/ corpcor_1.6.4.tar.gz
R CMD INSTALL corpcor_1.6.2.tar.gz Download and install“qvalue”R package [24]:
Figure 2Web server 2-tier client server system architecture.Flow chart demonstrates the components of the servlet container web server (Tomcat) communicating with system applications such as shell utils and R packages to perform SVA analysis, univariate and multivariate regression.
Piroozniaet al. Source Code for Biology and Medicine2013,8:8 Page 4 of 6
wgethttp://www.bioconductor.org/packages/ 2.9/bioc/src/contrib/qvalue_1.28.0.tar.gz
R CMD INSTALL qvalue_1.28.0.tar.gz Download and install“corpcor”R package [5]: wgethttp://www.bioconductor.org/packages/ 2.11/bioc/src/contrib/sva_3.4.0.tar.gz
R CMD INSTALL sva_3.1.2.tar.gz 1.2. Web application Installation:
Download and install TOMCAT [11]. Download SVAw.war
wgethttp://psychiatry.igm.jhmi.edu/sva/SVAw. war
Deploy war files into the webapps directory: \Tomcat home\webapps
Start TOMCAT
SVAw.war is automatically extracted, then becomes available in:
http://127.0.0.1:8080/sva/
2. Standalone Application
2.1. Installation for the standalone application: 2.1.1. Download and install the pre-requirements:
This is the same as section 1.1 (pre-requirements for web application).
2.1.2. Download and install the application
Download and unzip the standalone application: wgethttp://psychiatry.igm.jhmi.edu/sva/ package/SVAw_standalone.tar.gz
tar -zxvf SVAw_standalone.tar.gz
The SVAw standalone executable package has been designed and implemented using Shell scripting language. The packages can be run on 32 and 64-bit
Linux system. Before running the packages, some essential R packages declared in the download page are needed to be installed in the system.
Conclusion
SVAw is a web-based freely accessible solution for the surrogate variant analysis of high- throughput datasets and should facilitate removing all unwanted and un-known sources of variation. It provides users to analyze gene expression data directly and simply by an easy-to-use browser user interface. Moreover, we also provide execut-able standalone packages for users to incorporate and build their pipeline locally.
Availability and requirements
Project name: SVAw (Surrogate variable analysis Web app) Project home page: http://psychiatry.igm.jhmi.edu/sva Operating system(s): Platform independent
Programming language: Java 1.5.0 or higher, R v2.10 or higher
Other requirements: Tomcat 5.5 or higher, supported web browsers: Firefox3+, chrome, safari3+, Internet Explorer8+
License: GNU GPL
Any restrictions to use by non-academics: none
Competing interests
The authors declare that they have no competing interests.
Authors’contributions
MP, JTK and PPZ conceived and designed the project. MP and FS wrote and ran the algorithms. MP constructed and designed the web-server and coded the web application. FS performed the experimental analysis. MP, FSG and
PPZ directed to project. All authors read, contributed to and approved the final manuscript.
Acknowledgements
This project is supported by the National Institutes of Health (K01-MH093809 to M.P.), (R01-MH083738 to P.P.Z.).
Author details
1Department of Psychiatry and Behavioral Sciences, Johns Hopkins School of
Medicine, Baltimore, MD, USA.2Department of Biostatistics, Johns Hopkins Bloomberg School of Public Health, Baltimore, MD, USA.3Department of Mental Health, Johns Hopkins Bloomberg School of Public Health, Baltimore, MD, USA.
Received: 8 May 2012 Accepted: 21 January 2013 Published: 11 March 2013
References
1. Gagnon-Bartsch JA, Speed TP:Using control genes to correct for unwanted variation in microarray data.Biostatistics2012,13(3):539–552. 2. Leek JT, Scharpf RB, Bravo HC, Simcha D, Langmead B, Johnson WE, Geman D,
Baggerly K, Irizarry RA:Tackling the widespread and critical impact of batch effects in high-throughput data.Nat Rev Genet2010,11(10):733–739. 3. Teschendorff AE, Zhuang J, Widschwendter M:Independent surrogate
variable analysis to deconvolve confounding factors in large-scale microarray profiling studies.Bioinformatics2011,27(11):1496–1505. 4. Leek JT, Storey JD:Capturing heterogeneity in gene expression studies
by surrogate variable analysis.PLoS Genet2007,3(9):1724–1735. 5. Leek JT, Johnson WE, Parker HS, Jaffe AE, Storey JD:The sva package for
removing batch effects and other unwanted variation in high-throughput experiments.Bioinformatics2012,28(6):882–883. 6. Pirooznia M, Seifuddin F, Judy J, Goes FS, Zandi PP:Metamoodics: An
Integrated Web Resource For Systematic Meta-Analysis Of Genetic Association Studies In Mood Disorders. http://metamoodics.org.
7. Leek JT, Storey JD:A general framework for multiple testing dependence.
Proc Natl Acad Sci USA2008,105(48):18718–18723.
8. Storey JD, Akey JM, Kruglyak L:Multiple locus linkage analysis of genomewide expression in yeast.PLoS Biol2005,3(8):e267.
9. Gibson G:The environmental contribution to gene expression profiles.
Nat Rev Genet2008,9(8):575–581.
10. Draper NR, Smith H:Applied Regression Analysis. Hoboken, NJ: Wiley-Interscience; 1998.
11. Apache Tomcat. http://tomcat.apache.org/.
12. Java programming language. http://www.oracle.com/technetwork/java/ index.html.
13. jQuery JavaScript Library. http://jquery.com/.
14. JavaServer Pages Technology. http://www.oracle.com/technetwork/java/ javaee/jsp/.
15. Java Servlet Technology. http://www.oracle.com/technetwork/java/index-jsp-135475.html.
16. Visne I, Dilaveroglu E, Vierlinger K, Lauss M, Yildiz A, Weinhaeusel A, Noehammer C, Leisch F, Kriegner A:RGG: a general GUI Framework for R scripts.BMC Bioinforma2009,10:74.
17. Newton R, Deonarine A, Wernisch L:Creating web applications for spatial epidemiological analysis and mapping in R using Rwui.Source code for biology and medicine2011,6(1):6.
18. The R Project for Statistical Computing. http://www.r-project.org/. 19. The Bioconductor project. http://www.bioconductor.org/. 20. The Apache HTTP Server Project. http://httpd.apache.org/.
21. Red HatWEnterprise LinuxWservers. http://www.redhat.com/products/ enterprise-linux/.
22. WAR file format. http://en.wikipedia.org/wiki/WAR_file_format_(Sun). 23. corpcor R package. http://strimmerlab.org/software/corpcor/. 24. qvalue: Q-value estimation for false discovery rate control. http://www.
bioconductor.org/packages/release/bioc/html/qvalue.html.
doi:10.1186/1751-0473-8-8
Cite this article as:Piroozniaet al.:SVAw - a web-based application tool for automated surrogate variable analysis of gene expression studies.
Source Code for Biology and Medicine20138:8.
Submit your next manuscript to BioMed Central and take full advantage of:
• Convenient online submission
• Thorough peer review
• No space constraints or color figure charges
• Immediate publication on acceptance
• Inclusion in PubMed, CAS, Scopus and Google Scholar
• Research which is freely available for redistribution
Submit your manuscript at www.biomedcentral.com/submit
Piroozniaet al. Source Code for Biology and Medicine2013,8:8 Page 6 of 6