R E S E A R C H A R T I C L E
Open Access
The impact of survey mode on the
response rate in a survey of the factors that
influence Minnesota physicians
’
disclosure
practices
Lesley Weaver
*, Timothy J. Beebe and Todd Rockwood
Abstract
Background:There is evidence that the physician response rate is declining. In response to this, methods for increasing the physician response rate are currently being explored. This paper examines the response rate and extent of non-response bias in a mixed-mode study of Minnesota physicians.
Methods:This mode experiment was embedded in a survey study on the factors that influence physicians’ willingness to disclose medical errors and adverse events to patients and their families. Physicians were randomly selected from a list of licensed physicians obtained from the Minnesota Board of Medical Practice. Afterwards, they were randomly assigned to either a single-mode (mail-only or web-only) or mixed-mode (web-mail or mail-web) design. Differences in response rate and nonresponse bias were assessed using Fischer’s Exact Test.
Results:The overall response rate was 18.60%. There were no statistically significant differences in the response rate across modes (p–value = 0.410). The non-response analysis indicates that responders and non-responders did not differ with respect to speciality or practice location.
Conclusions:The mode of administration did not affect the physician response rate.
Keywords:Mixed-mode, Physicians, Response rate, Non-response bias
Background
Surveys are a useful means of collecting information on physicians’ knowledge, attitudes, and beliefs. Unfortu-nately, the physician response rate is declining [1–4], threatening the external validity of physician surveys and increasing the possibility of non-response bias. However, prior research suggests that physician surveys may be less prone to non-response bias than surveys of other populations, given that physicians are rather homogenous with respect to their knowledge, attitudes, and beliefs [5]. Nevertheless, researchers are searching for effective ways of increasing their participation in sur-veys, given that the response rate is often considered an indicator of survey quality. Specifically, the greater a
survey’s response rate; the greater the study’s external validity [6].
Prior research suggests numerous strategies that could be used to increase the physician response rate, including the use of incentives [7], short questionnaires [5,8], mul-tiple reminders [9, 10], and survey sponsorship [11, 12]. Monetary incentives tend to be more effective at increas-ing the response rate than non-monetary incentives and lotteries [11]. And, prepaid incentives tend to work better than promised incentives [7, 11]. However, a study con-ducted by Ziegenfuss, Niederhauser, Kallmes, and Beebe [13] found that responders preferred the chance to win an iPad to the guarantee of receiving a $5 Amazon giftcard. Sending multiple reminders is particularly important, given physicians’ busy schedules and demanding work-loads, which can lead to refusals and unit non-response.
The mode, or medium used to administer the ques-tions to potential respondents, can also affect the
© The Author(s). 2019Open AccessThis article is distributed under the terms of the Creative Commons Attribution 4.0 International License (http://creativecommons.org/licenses/by/4.0/), which permits unrestricted use, distribution, and reproduction in any medium, provided you give appropriate credit to the original author(s) and the source, provide a link to the Creative Commons license, and indicate if changes were made. The Creative Commons Public Domain Dedication waiver (http://creativecommons.org/publicdomain/zero/1.0/) applies to the data made available in this article, unless otherwise stated.
* Correspondence:[email protected]
response rate [14]. Compared to web surveys, physicians are more apt to respond to mail surveys [7,11,15]. And, the use of mixed-mode designs tends to generate a higher response rate amongst health care professionals
than single-mode designs [16–19]. However,
single-mode designs tend to generate a higher response rate than simultaneous, mixed-mode designs [20]. Mixed-mode designs allow physicians to choose the mode they will use to respond to a survey request. The availability of mode choice may be particularly important to physicians, given that they are accustomed to having considerable autonomy in their professional lives.
With mixed-mode designs, the sequencing and timing of the medium used to administer the survey is import-ant. Beebe and colleagues [21] found that following a mail survey with a web survey produces a higher re-sponse rate amongst physicians than doing the opposite. And, a meta-analysis conducted by Medway and Fulton [20] found that sequential, mixed-mode designs tend to produce a higher response rate than simultaneous, mixed-mode designs. However, their analysis was based on studies of various populations, so their results may not be generalizable to physicians. For simultaneous, mixed-mode designs, the rate maybe lower because ask-ing individuals to make a choice places an additional re-sponse burden on them. For instance, in a web-mail design, they might spend time weighing the advantages and disadvantages of each option. And, if they choose the web option, they must find an Internet connected device, open a web browser, and type in the survey link.
In some mixed-mode studies of physicians, the final mode used differs from the mode used for all the prior contacts [21–25]. However, one study did change modes after the initial mailing [19]. This mixed-mode study combines elements of the aforementioned designs to examine which mode of contact has the greatest impact on the physician response rate. It also looks at their im-pacts on nonresponse bias (i.e., the extent to which re-sponders differ from non-rere-sponders).
Current study
Prior research suggests that physicians are more apt to respond to mail surveys than web surveys [7, 11, 15]. However, the practice of medicine is becoming more technologically driven. For instance, many hospitals and clinics have transitioned from paper medical records to electronic medical records, requiring physicians to use computers as part of their day-to-day practice. Based on this, one could assume that they are comfortable using them. If this is indeed the case, then perhaps the current generation of physicians will be more receptive to com-pleting a web survey than their predecessors. The pur-pose of this cross-sectional, mixed-mode study is to
examine how the mode of survey administration affects the physician response rate.
Methods
The mode experiment was embedded in The Medical Error Disclosure Survey (MEDS) and the Adverse Event Disclosure Survey (AEDS), which was fielded from No-vember 2017 to February 2018. They examined the fac-tors that influence physicians’ willingness to disclose medical errors and adverse events to patients and their families, respectively.
A list of 14,772 licensed, Minnesota physicians was ob-tained from the Minnesota Board of Medical Practice. From this list, a random sample of 1565 physicians was selected. Of those selected, 341 (21.79%) only had a pos-tal address listed. The remaining 1224 (78.21%) had both a postal and email address listed. Physicians in the latter group were randomly assigned to one of four mode groups: mail-only, mail-web, web-mail, and web-only. There were 306 physicians in each group. Within each mode group, physicians were randomly assigned to re-ceive either the MEDS (n= 612) or AEDS (n= 612). Of these, 293 physicians participated in the survey, yielding an unweighted response rate of 18.60%.
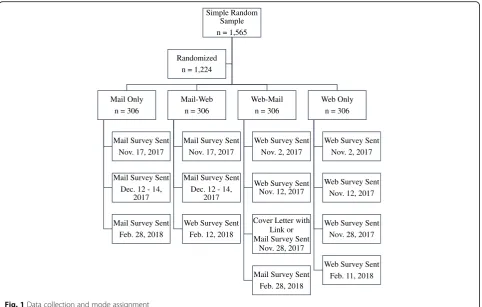
Figure 1 depicts the crossover design used in this study. All the mail contacts included a cover letter that was printed on the University of Minnesota, Twin Cities letterhead. The letter explained the purpose of the study, why they were selected, and the voluntary, confidential nature of their participation. It was accompanied by a copy of their assigned survey booklet and a business reply envelope. The paper surveys were returned to the primary author at the School of Public Health at the University of Minnesota, Twin Cities. At the end of data collection, the surveys were given to Northwest Key-punch, Inc., where they were entered into a database by data entry professionals. Upon return of the surveys and receipt of the database, the primary author randomly spot-checked the data to ensure its accuracy.
For all web surveys, the body of the email included in-formation that was similar to what was included in the mailed cover letters. The emails also included an embed-ded link to the survey, which were programmed using Qualtrics™. At the end of data collection, an Excel file containing participants’responses was downloaded from Qualtrics. It was merged with the database from North-west Keypunch, Inc. prior to data analysis.
a personalized, survey link, which they were asked to type into their internet browser. Meanwhile, those in the survey packet group were mailed a cover letter, survey
booklet, and business reply envelope. Later,
non-responders in both groups were sent a survey packet.
Non-responders in the mail-only and mail-web groups received up to two additional contacts. In contrast, non-responders in the web-mail and web-only groups received up to three additional contacts. When physi-cians returned the survey, refused to participate, or were deemed ineligible, all subsequent contact with them ceased. Informed consent was implied if physicians com-pleted and returned the survey. Written and verbal con-sent was not obtained. Physicians who completed the survey were entered into a drawing for their choice of one of four tablets (market value approximately $500). This study was approved by the Institutional Review Board at the University of Minnesota, Twin Cities.
Analysis
By mode, response rates were computed by tallying the number of completes and dividing it by the number of eligible cases in accordance with the RR1 guidelines out-lined by the American Association for Public Opinion Research [26]. The chi-square test was used to test for overall differences in the response rate across modes,
and the Fisher’s Exact test was used to examine potential non-response bias. Data from the original sampling frame was used to compare the practice area and loca-tion of responders and non-responders within each group. To determine location, the sampling frame was merged with the 2004 ZIP RUCA Code files for the state of Minnesota, which was obtained from the Washington, Wyoming, Alaska, Montana and Idaho (WWAMI) Rural Health Research Center [27]. Unfortunately, it was not possible to compare responders and non-responders on other variables because the sampling frame only in-cluded physicians’license number, specialty, and mailing address and/or email address. Ap-value of 0.05 was used to determine statistical significance. All analyses were conducted using STATA, Version 15 [28].
Results
For the mode experiment, the overall response rate was 18.60%. Table 1 presents the response rates by mode. The mail-only and mail-web groups had the highest re-sponse rate at 19%. The web-only group had the lowest at 15%. However, these results were not statistically significant.
Table 2 compares the practice area of responders and non-responders by mode. Across all modes, the majority of responders were specialists. The proportion of re-sponders who were specialists ranged from 45.71% in Simple Random
Sample n = 1,565
Mail Only n = 306
Mail Survey Sent Nov. 17, 2017
Mail Survey Sent Dec. 12 - 14,
2017
Mail Survey Sent Feb. 28, 2018
Mail-Web n = 306
Mail Survey Sent Nov. 17, 2017
Mail Survey Sent Dec. 12 - 14,
2017
Web Survey Sent Feb. 12, 2018
Web-Mail n = 306
Web Survey Sent Nov. 2, 2017
Web Survey Sent Nov. 12, 2017
Cover Letter with Link or Mail Survey Sent
Nov. 28, 2017
Mail Survey Sent Feb. 28, 2018
Web Only n = 306
Web Survey Sent Nov. 2, 2017
Web Survey Sent Nov. 12, 2017
Web Survey Sent Nov. 28, 2017
Web Survey Sent Feb. 11, 2018 Randomized
n = 1,224
the web-mail (booklet) group to 73.53% in the web-mail (link) group. Across all modes, there were not any statis-tically significant differences in the practice area of re-sponders and non-rere-sponders.
Table 3 compares the practice location of responders and non-responders by mode. Regardless of mode, the majority of them practice in an urban area. There were not any statistically significant differences in practice lo-cation amongst the two groups.
Discussion
There were not any statistically significant differences in the response rate across modes. The higher response rate for the web-mail group was unexpected, but con-sistent with prior research [19]. However, the finding that the overall response rate was lowest for the web-only group was expected. Amongst physicians the response rate for mailed surveys tend to be greater than
it is for web surveys [3,7,11,15,17,29]. There could be numerous reasons for this. Due to spam filters, the emailed invitations could have ended up in physicians’ spam folders only to be deleted later. Also, the volume of emails that some physicians receive may force them to skim their inboxes and only respond to the most im-portant emails. It was not possible to determine if physi-cians deleted the email invitations without opening them or if they were diverted by spam filters.
Given specialists’ demanding work schedules, it was surprising to find that they had a higher response rate than generalists, especially for the web-only group. In a study comparing mail and web surveys, Leece and col-leagues [15] found that surgeons who are members of the Orthopaedic Trauma Association are more apt to re-spond to mail surveys than web surveys. And, in a study of various specialists, Cunningham and colleagues [30] found that the response rate to their web survey varied by specialty. The response rate was 46.6% for neurolo-gists/neurosurgeons, 29.2% for pediatricians, and 29.6% for general surgeons. Taken together, these findings sug-gest that perhaps researchers should be using different modes when studying different groups of specialists. Fu-ture research should tease out the relationship between physicians’specialty and their mode preferences.
Prior research suggests that individuals are more apt to respond to survey on topics that are important or of interest to them [31, 32]. Thus, it is possible that the higher response rate amongst specialists is due to the topic’s salience, not their mode preferences. Compared to generalists, specialists are apt to treat patients with multiple health conditions or that require intensive, complex medical care. Due to the complexities of care, Table 1Response rate by mode
Respondents Non-respondents X2 P-value
Mail Only 18.96%
(62)
81.04% (265)
Mail-Web 18.95%
(58)
81.05% (248)
Web-Mail (link) 20.12% (34)
79.88% (135)
3.9726 0.410
Web-Mail (booklet) 22.15% (35)
77.85% (123)
Web Only 15.21%
(47)
84.79% (262)
Total 18.60%
(236)
81.40% (1033)
Table 2Practice area of responders and non-responders
Responders Non-responders
Generalist Practice Specialist Practice Generalist Practice Specialist Practice
Mail Only 45.16%
(28)
54.84% (34)
48.68% (129)
51.32% (136)
Mail-Web 43.10%
(25)
56.90% (33)
45.16% (112)
54.84% (136)
Web-Mail (link) 26.47%
(9)
73.53% (25)
45.93% (62)
54.07% (73)
Web-Mail (booklet) 54.29%
(19)
45.71% (16)
45.53% (56)
54.47% (67)
Web Only 42.55%
(20)
57.45% (27)
50.76% (133)
49.24% (129)
Total 42.80%
(101)
57.20% (135)
47.63% (492)
52.37% (541)
P-value 0.217 0.714
the best laid plans for the optimal delivery of care may not pan out, leading to a medical error or series of er-rors. Nationwide, there is a push for the timely disclos-ure of medical errors to patients and/or their families, especially in hospitals. The saliency of disclosure for spe-cialists may have prompted some of them to complete the survey. While patients treated by generalists can also experience a medical error, the issue may be less salient for them.
Additionally, the disclosure of adverse events and medical errors is a sensitive topic for many physicians. Following a medical error, physicians may experience emotional and psychological distress in the form of anx-iety, sleeplessness, guilt, feelings of inadequacy, and de-creased job satisfaction [33–36]. To avoid triggering unpleasant emotional or psychological states, physicians may have opted out of or refused to complete the sur-vey. To reduce the chances of this occurring, the survey did not ask physicians to describe any medical errors or adverse events they were personally involved in. Instead, it was designed to capture their general attitudes toward the disclosure of them. However, the design of the sur-vey and use of lottery incentives may not have been enough to overcome some physicians’reluctance to dis-cuss such a sensitive topic.
There are a few limitations associated with this study. First, the state licensure database did not contain many demographic variables, so it was not possible to conduct a more thorough non-response analysis. Second, the sample size was relatively small, making it difficult to identity significant differences. Third, the overall re-sponse rate was lower than the community standard of 50% for physician surveys [37], likely due to the time of year the study was conducted. The bulk of the surveys were administered around the Thanksgiving and Christ-mas holidays, a very busy time of year. Nevertheless, the primary purpose of the investigation was to assess the
differential impact of our manipulations across condi-tions. While lower than expected participation may have adversely impacted the study’s statistical power and con-tributed to the lack of statistically significant differences, the impacts observed do offer incremental evidence in support of certain approaches to increasing survey yield. Lastly, the mode groups did not receive the same num-ber of follow-ups, which could have influenced the re-sponse rate. Due to resource constraints, it was not possible to conduct additional follow-ups with the mail and mail-web groups.
Conclusion
While the results presented were not statistically signifi-cant, additional research on the impact of survey mode on the physician response rate is needed. Identifying ways to improve their response rate is important, given that a low response rate can contribute to non-response bias, an unrepresentative sample, and negatively impact the generalizability of a study’s findings [6]. Future re-search should examine whether there is a relationship between survey mode, physicians’specialty, and the sponse rate. Examining this relationship could help re-searchers develop more effective survey protocols in the future.
Abbreviations
AEDS:Adverse Event Disclosure Survey; MEDS: Medical Error Disclosure Survey; WWAMI: Washington, Wyoming, Alaska, Montana and Idaho Rural Health Research Center
Acknowledgements
Not applicable.
Funding
This study was part of LW’s dissertation research, which was funded by her thesis adviser, TR. She used the funding to cover some of the expenses associated with the printing and mailing of the survey packets. TR helped LW design the mode experiment, selected the appropriate formula for the response rate calculations, and provided the WWAMI data. LW computed Table 3Practice location of responders and non-responders
Responders Non-responders
Urban Large Rural Small Rural Urban Large Rural Small Rural
Mail Only 81.97%
(50)
13.11% (8)
4.92% (3)
85.61% (226)
9.47% (25)
4.92% (13)
Mail-Web 89.66% (52) 8.62%
(5)
1.72% (1)
88.71% (220)
7.66% (19)
3.63% (9)
Web-Mail (link) 82.35% (28) 11.76%
(6)
5.88% (2)
85.93% (116)
8.89% (12)
5.19% (7)
Web-Mail (booklet) 71.43% (25) 17.14%
(6)
11.43% (4)
83.74% (103)
9.76% (12)
6.50% (8)
Web Only 93.62% (44) 4.26%
(2)
2.13% (1)
87.40% (229)
9.92% (26)
2.67% (7)
Total 84.68% (199) 10.64%
(27)
4.68% (9)
86.63% (894)
9.11% (94)
4.26% (44)
the response rates and performed and interpreted the results of all statistical analyses. TR also reviewed the manuscript prior to its submission.
Availability of data and materials
The dataset used for this research project will not be publicly available due to confidentiality concerns. Due to the small sample size and presence of identifiers (i.e. speciality and practice location), and small numerator and denominator values, others may be able to discern study participants’ identities.
Scientific (medical) writers
Not applicable.
Authors’contributions
TR and TB provided guidance on the mixed-mode study design. LW reviewed the literature, performed the statistical analysis, developed the ta-bles and figures, and wrote the initial draft of the article, which was edited by TB. All authors read and approved the final manuscript.
Ethics approval and consent to participate
Informed consent was implied if physicians completed and returned the survey. Written and verbal consent was not documented or directly obtained from participating physicians. This study was approved by the Institutional Review Board at the University of Minnesota, Twin Cities.
Consent for publication
Not applicable.
Competing interests
The authors declare that they have no competing interests.
Publisher’s Note
Springer Nature remains neutral with regard to jurisdictional claims in published maps and institutional affiliations.
Received: 20 December 2018 Accepted: 26 March 2019
References
1. Cull WL, O’Connor KG, Sharp S, Tang SS. Response rates and response bias for 50 surveys of pediatricians. Health Serv Res 2005;40(1):213–226. Available fromhttps://doi.org/10.1111/j.1475-6773.2005.00350.x
2. Cook JV, Dickinson HO, Eccles MP. Response rates in postal surveys of healthcare professionals between 1996 and 2005: an observational study. BMC HealthServ Res 2009;9(160). Available from https://doi.org/https://doi. org/10.1186/1472-6963-9-160.
3. Cho YI, Johnson TP, VanGeest JB. Enhancing surveys of health care professionals: a meta-analysis of techniques to improve response. Eval Health Prof 2013;36(3):382–407. Available fromhttps://doi.org/10.1177/ 0163278713496425.
4. McLeod CC, Klabunde CN, Willis GB, Stark D. Health care provider surveys in the United States, 2000-2010: a review. Eval Health Prof 2013;36(1):106–126. Available fromhttps://doi.org/10.1177/0163278712474001
5. Kellerman SE, Herold J. Physicians response to surveys. A review of the literature. Am J Prev Med 2001;20(1):61–67. Available fromhttps://doi.org/ 10.1016/S0749-3797(00)00258-0
6. Johnson TP, Wislar JS. Response rates and nonresponse errors in surveys. JAMA-J Am Med Assoc. 2012;307(17).https://doi.org/10.1001/jama.2012.3532. 7. Pit SW, Vo T, Pyakurel S. The effectiveness of recruitment strategies on
general practitioner’s survey response rates—a systematic review. BMC Med Res Methodol 2014;14(76). Available from https://doi.org/https://doi.org/10. 1186/1471-2288-14-76.
8. Jepson C, Asch DA, Hershey JC, Ubel PA. In a mailed physician survey, questionnaire length had a threshold effect on response rate. J Clin Epidemiol 2005;58(1):103–105. Available from https://doi.org/https://doi.org/ 10.1016/j.jclinepi.2004.06.004
9. Barclay S, Todd C, Finlay I, Grande G, Wyatt P. Not another questionnaire! Maximizing the response rate, predicting response and assessing non-response bias in postal questionnaire studies of GPs. Fam Pract 2002;19(1): 105–111. Available from https://doi.org/https://doi.org/10.1093/fampra/19.1.105
10. Bjertnaes OA, Garrett A, Botten G. Nonresponse bias and cost-effectiveness in a Norwegian survey of family physicians. Eval Health Prof 2008;31(1):65– 80. Available from https://doi.org/https://doi.org/10.1177/
0163278707311874.
11. VanGeest JB, Johnson TP, Welch VL. Methodologies for improving response rates in surveys of physicians: a systematic review. Eval Health Prof 2007; 30(4):303–321. Available from https://doi.org/https://doi.org/10.1177/ 0163278707307899
12. Flanigan TS, McFarlene E, Cook S. Conducting survey research among physicians and other medical professionals–a review of the current literature. New Orleans, LA: American Statistical Association Proceedings of the Survey Research Methods Section 2008;4136–4147.
13. Ziegenfuss JY, Niederhauser BD, Kallmes D, Beebe TJ. An assessment of incentive versus survey length trade-offs in a web survey of radiologists. J Med Internet Res. 2013;15(3):e49.https://doi.org/10.2196/jmir.2322. 14. Leeuw E, Berzelak N. Survey mode or survey modes? In: Wolf C, Joye D,
Smith TW, Fu Y, editors. The SAGE handbook of survey methodology. London: SAGE Publications Ltd; 2016. p. 142–56.
15. Leece P, Bhandari M, Sprague S, Swiontkowski MF, Schemitsch EH, Tornetta P, et al. Internet versus mailed questionnaires: a controlled comparison. J Med Internet Res. 2004;6(4):e39.https://doi.org/10.2196/jmir.6.4.e39. 16. Scott A, Jeon S, Joyce CM, Humphreys JS, Kalb G, Witt J, et al. A randomized
trial and economic evaluation of the effect of response mode on response rate, response bias, and item non-response in a survey of doctors. BMC Med Res Methodol 2011;11(126). Available from https://doi.org/https://doi.org/10. 1186/1471-2288-11-126.
17. Dykema J, Jones NR, Piche T, Stevenson J. Surveying clinicians by web: current issues in design and administration. Eval Health Prof 2013;36(3):352– 381. Available from https://doi.org/https://doi.org/10.1177/
0163278713496630.
18. Partin MR, Powell AA, Burgess DJ, Haggstrom DA, Gravely AA, Halek K, et al. Adding postal follow-up to a web-based survey of primary care and gastroenterology clinic physician chiefs improved response rates but not response quality or representativeness. Eval Health Prof 2015;38(3):382–403. Available from https://doi.org/https://doi.org/10.1177/0163278713513586. 19. Beebe TJ, Jacobson RM, Jenkins SM, Lackore KA, Finney-Rutten LJ. Testing the impact of mixed-mode designs (mail and web) and multiple contact attempts within mode (mail or web) on clinician survey response. Health Serv Res 2018;53(S1):3070–3083. Available from https://doi.org/https://doi. org/10.1111/1475-6773.12827
20. Medway RL, Fulton J. When more gets you less: a meta-analysis of the effect of concurrent options on mail survey response rates. Public Opin Quart 2012;76(4):733–746. Available from https://doi.org/https://doi.org/10. 1093/poq/nfs047.
21. Beebe TJ, Locke III GR, Barnes SA, Davern ME, Anderson KJ. Mixing web and mail methods in a survey of physicians. Health Serv Res 2007;42(3 Pt 1): 1219–1234. Available from https://doi.org/ https://doi.org/10.1111/j.1475-6773.2006.00652.x
22. Puleo E, Zapka J, White MJ, Mouchawar J, Somkin C, Taplin S. Caffeine, cajoling, and other strategies to maximize clinician survey response rates. Eval Health Prof 2002;25(2):169–184. Available from https://doi.org/https:// doi.org/10.1177/016327870202500203.
23. McMahon SR, Iwamoto M, Massoudi MS, Yusuf HR, Stevenson JM, David F, et al. Comparison of e-mail, fax, and postal surveys of pediatricians. Pediatrics. 2003;111(4):e299–303 Available fromhttp://pediatrics. aappublications.org/content/142/6?current-issue=y.
24. Ash JS, Gorman PN, Seshadri V, Hersh WR. Computerized physician order entry in U.S. hospitals: results of a 2002 survey. J Am Med Inform Assoc 2004;11(2):95–99. Available from https://doi.org/https://doi.org/10.1197/ jamia.M1427
25. Shah TU, Voils CI, McNeil R, Wu R, Fisher DA. Understanding gastroenterologist adherence to polyp surveillance guidelines. Am J Gastroenterol. 2012;107(9):1283–7.https://doi.org/10.1038/ajg.2012.59. 26. American Association for Public Opinion Research. Standard definitions: final
dispositions of case codes and outcome rates for surveys. 9th ed. Oakbrook Terrace: AAPOR; 2016.
27. Washington, Wyoming, Alaska, Montana, and Idaho (WWAMI) Rural Health Research Center.RUCA Data[Data set].Available fromhttp://depts. washington.edu/uwruca/ruca-download.php[Accessed 28thJune 2018]. 28. StataCorp. Stata Statistical Software: Release 15. College Station: StataCorp
29. Seguin R, Godwin M, MacDonald S, McCall M. E-mail or snail mail? Randomized controlled trial on which works better for surveys. Can Fam Physician. 2004;50(3):414–9 Available fromhttps://www.cfpc.ca/Home/. Accessed 16 Oct 2018.
30. Cunningham CT, Quan H, Hemmelgarn B, Noseworthy T, Beck CA, Dixon E, et al. Exploring physician specialist response rates to web-based surveys. BMC Med Res Methodol. 2015;15(32) Available fromhttps://doi.org/10.1186/ s12874-015-0016-z.
31. Groves RM, Presser S, Dipko S. The role of topic interest in survey participation decisions. Public Opin Quart 2004;68(1):2–31. Available from https://doi.org/https://doi.org/10.1093/poq/nfh002.
32. Groves RM, Singer E, Corning A. Leverage-saliency theory of survey participation: description and an illustration. Public Opin Quart. 2000;64(3): 299–308 Available fromhttps://www.jstor.org/stable/3078721. Accessed 12 Oct 2018.
33. Wu AW, Folkman S, McPhee AJ, Lo B. Do house officers learn from their mistakes? BMJ Qual Saf 2003;12(3):221–226. Available from http://dx.doi.org/
https://doi.org/10.1136/qhc.12.3.221
34. Hobgood C, Hevia A, Tamayo-Sarver JH, Weiner B, Riviello R. The influence of the causes and contexts of medical errors on emergency medicine residents’responses to their errors: an exploration. Acad Med. 2005;80(8): 758–64 Available fromhttps://journals.lww.com/academicmedicine/pages/ default.aspx. Accessed 28 Mar 2018.
35. Waterman AD, Garbutt J, Hazel E, Dunagan WC, Levinson W, Fraser VJ, et al. The emotional impact of medical errors on practicing physicians in the United States and Canada. Jt Comm J Qual Patient Saf 2007;33(8):467–476. Available from https://doi.org/https://doi.org/10.1016/S1553-7250(07)33050-X. 36. Schwappach DLB, Boluarte TA. The emotional impact of medical error
involvement on physicians: a call for leadership and organizational accountability. Swiss Med Wkly. 2009;139:9–15 Available fromhttps://smw.ch/. Accessed 29 June 2018.