Control of euglenophyte bloom and fish production enhancement
using duckweed and lime
Mohammad Shadiqur Rahman; Shahjahan Md.
*;
Mahfuzul Haque Md.; Saleha Khan
Received: April 2011 Accepted: September 2011
Abstract
Euglenophyte bloom is a common problem in most of the aquaculture ponds in Bangladesh. In the present study we conducted an experiment to control euglenophyte bloom for achieving better fish production using duckweed (Lemna minor) and lime. The experiment was carried out using four treatments, i.e., ponds were supplied with duckweed (T1), lime treatment (T2), both duckweed and lime (T3) and without supply of duckweed and lime (T4). Rohu, catla, mrigal, silver carp and silver barb were stocked and their gut contents were analyzed monthly. The ranges of water quality parameters were analyzed within the productive limit during the experimental period. The mean abundance of euglenophyte was significantly highest in T4 (17.62 ± 1.97 x 10⁴ cells/L), followed by T2 (2.96 ± 0.20 x 10⁴ cells/L), T1 (1.94 ± 0.35 x 10⁴ cells/L) and T3 (1.53 ± 0.42 x 10⁴ cells/L). Gut content analysis revealed that considerable amounts of euglenophyte were consumed by silver carp and silver barb, but not preferred by rohu, catla and mrigal. The gross yields of fish were 2133.37, 1967.76, 2816.52 and 1725.62 kg/ha/5 months in T1, T2, T3 and T4 respectively. The highest fish production in T3 and lowest fish production in T4 indicated the use of duckweed and lime is economically sustainable for controlling euglenophytes bloom, maintaining water quality and getting higher fish production.
Keywords: Euglenophytes, Bloom, Duckweed, Fish, Production, Pond, Water Quality, Lime
_________________
Department of Fisheries Management, Bangladesh Agricultural University, Mymensingh-2202, Bangladesh. *Corresponding author’s email: [email protected]
Introduction
Nutrients from decomposition of unutilized feed and organic wastes of living organisms plus those directly from the given fertilizers in aquaculture ponds favour the growth of phytoplankton. Among the different types of phytoplankton, euglenophyte is an important group which is responsible for the occurrence of red sticky scum on the surface in day time. When they lead to algal die-off sometimes they create severe aquatic environmental degradation. On the other hand, the bloom of this phytoplankton inhibits the light penetration as well as utilizing most of the nutrients from the water body for their growth. As a result, the growth of other beneficial planktons decreases markedly and ultimately the fish production is hampered. Some bloom forming genera of euglenophytes such as Euglena,
Phacus and Trachelomonas have significant effects in reducing the number of other algal species in aquaculture ponds (Leupold, 1988). Euglena sanguinea bloom is the cause of fish breath difficulty at the surface due to algae attach to the gill (Xavier et a1., 1991). The growth and development of euglenophyte depends on the combination of factors such as sunlight, warm temperature and polluted conditions. They prefer polluted water, which is high in organic materials and they can also tolerate stress habitats.
Phacus and Euglena are abundant at high organic loading rates (Phang and Ong, 1988) and at acidic environments (Xavier et al., 1991; Zakrys and Walne, 1994).
Recently the aquaculturists of Bangladesh are faced with the problems of
euglenophytes bloom and they are thinking about how to take control measures against that hazard. The fish farmers use the herbicides - CuS04, Simazin or Aquazin, Fenac, Silvex, Paraquat, Dequat, Endothal, 2-4-D, 2-4-5-T, etc. in their ponds without knowing their toxicity and residual effects. Most of the herbicides have negative effects on aquatic organisms and fishes, and are not environment friendly (McIntosh and Kavern, 1974). As a result they are facing numerous problems with marked inhibition of total production. An attempt has been made on the water quality improvement and euglenophytes bloom control for achieving better fish production using duckweed (Lemna minor) and lime (CaO).
Duckweed (Lemna minor) is an effective nutrient removal agent through biofiltration from organic nutrient rich water body (Perniel et al., 1998; Rahmani and Sternberg, 1999; Sharma et al., 2000). Due to the removal of nutrient from aquatic habitats the growth of euglenophytes will ultimately be reduced. On the other hand, duckweed is presently being used as fish feed. Duckweed has been shown to be readily consumed by a variety of herbivorous fish (Uddin et al., 2007; Chowdhury et al., 2008). Duckweed fed carp polyculture methodology permits increases in production and it also increases the financial and economic viability of the production system (Journey et al., 1991).
Lime is widely used to increase the fish production in ponds with acid bottom muds and soft water. Liming increases the alkalinity of water thereby increasing the
availability of carbondioxide for photosynthesis. Greater alkalinity after liming also buffers against drastic diel pH changes common in eutrophic ponds. The net effect of changes in water quality following liming is to increase phytoplankton productivity which, in turn, leads to increase fish production. In addition the growth of euglenophytes (Euglena, Phacus and Trachelomonas), acidic pH trend to group of phytoplankton will be retarded and water quality will be improved.
Higher abundance of euglenophyte has negative effects on the growth and production of fish through hampering light penetration, influencing water quality parameters and growth of other beneficial phytoplanktons (Leupold, 1988; Xavier et a1., 1991). In the present study, duckweed and lime have been used to see how they improve the water quality and control harmful euglenophytes bloom in ponds as well as increase the total fish production along with decreasing the cost of fertilizers and feeds.
Materials and methods
Experimental design and pond preparation
The experiment was carried out for a period of five months in twelve ponds at Bangladesh Agricultural University, Mymensingh, Bangladesh. The experiment had four treatments, where in T1 ponds were supplied with duckweed in the volume of 1/3 of the water surface, in T2 ponds were used with lime at the rate of 0.5 kg/decimal/month, in T3 ponds were supplied with both duckweed and lime,
and in T4 ponds were kept as control (without supply of duckweed and lime). The experimental ponds were drained out to eradicate all the undesirable fishes, renovated and liming was done in all the ponds at the rate of 1 kg/decimal. Ponds were filled up with underground water and fertilized at the rate of poultry dropping 10 kg/decimal, urea 100 g/decimal and TSP 100 g/decimal as initial doses.
Fish stocking and management
After seven days of fertilization, all the ponds were stocked with fingerlings at the rate of 40 fish per decimal with a ratio of 9:4:8:6:13 of silver carp (Hypophthalmichthys molitrix), catla (Catla catla), rohu (Labeo rohita), mrigal (Cirrhinus mrigala) and silver barb (Barbodes gonionotus) respectively. Both organic (cow dung) and inorganic fertilizers (urea and TSP) were applied in the ponds every 10 days interval. One day after stocking the same feeding regime was practiced among the four treatments. Mustard oil cake and rice bran were used as supplementary feed at the ratio of 1:1. Feed was applied in the ponds once a day at the rate of 4% body weight of the total fish biomass in the pond.
Analysis of water quality parameters
Some water quality parameters such as water temperature (°C), transparency (cm), dissolved oxygen (mg/L), pH, total alkalinity (mg/L), PO4-P (mg/L), NO3-N (mg/L), and chlorophyll-a content were measured and recorded fortnightly. Water temperature was recorded with a Celsius thermometer and transparency was measured with a secchi disc of 30 cm diameter. Dissolved oxygen was measured directly with a DO meter (Lutron,
5509) and a digital pH meter (CORNING pH meter 445) was used to measure pH. PO4-P (mg/L) and NO3-N (mg/L) were determined by a Hach Kit (DR/2010, a direct reading Spectrophotometer). Chlorophyll-a content was estimated by using a spectrophotometer (Milton Roy spectronic, model 1001) at 664 and 750 nm wavelengths using the formula of Boyd (1982).
Study of phytoplankton
Quantitative and qualitative counting of phytoplankton was done with the help of Sedgwick-Rafter Counting Cell (S-R cell) under a compound binocular microscope. The plankton population was determined by using the formula of Rahman (1992). Identification of phytoplankton up to generic level was made according to Needham and Needham (1963), Prescott (1964) and Bellinger (1992).
Gut content, growth and production of fish
Fish samples were collected with a cast net monthly to estimate the gut contents, growth in length (cm) and in weight (g), and to check up the health condition of fish. The fish was washed with clean water and then the body cavity of the fish was carefully opened and the alimentary canal was dissected out into a clean Petridis. Then the gut was opened with the help of scissors and forceps. Finally the gut contents were taken in a vial and made into a volume of 5 ml with distilled water and preserved with 5% buffered formalin until gut contents were examined. The following parameters were used to evaluate the growth:
(a) Length gained = Mean final length - Mean initial length.
(b) Weight gained = Mean final weight - Mean initial weight.
At the end of the experiment, all fish were harvested through repeated netting by seine net to calculate the gross production of fish.
Data analysis
All the data obtained throughout the study period were statistically analyzed by analysis of variance (ANOVA). All analyses were performed using SPSS14.0 for Windows. Differences were regarded significant when P<0.05.
Results
Water quality parameters
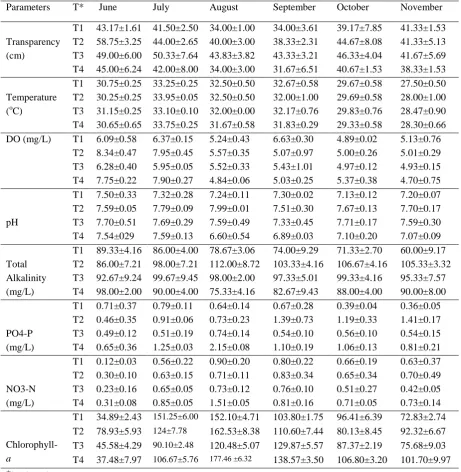
Throughout the study period, a number of physical and chemical parameters of the ponds such as water temperature (°C), transparency (cm), dissolved oxygen (mg/L), pH, total alkalinity (mg/L), PO4-P (mg/L), NO3-N (mg/L) and Chlorophyll-a content were determined. The results of physico-chemical parameters are shown in Table 1. All physical and chemical parameters of the ponds’ water were found to be within the acceptable ranges for the fish culture in all treatments.
Total phytoplankton population
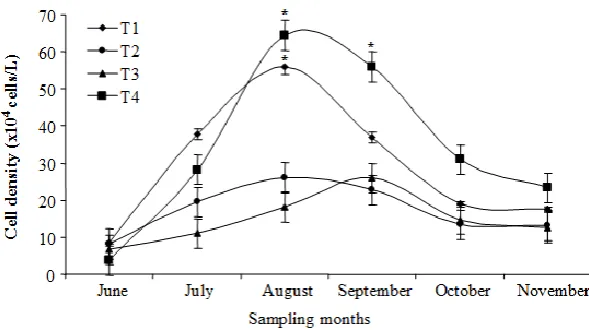
In the present study, 3 genera of euglenophytes, 9 genera of cyanophytes, 16 genera of chlorophytes and 5 genera of bacillariophytes were recorded during the experimental periods (Table 2). The mean abundance of total phytoplankton (Fig. 1) was significantly higher in T4 (32.42 ± 2.25 x 10⁴ cells/L), followed by T1 (27.39 ± 5.36 x 10⁴ cells/L), T2 (16.95 ± 7.24 x 10⁴ cells/L) and T3 (13.85 ± 7.58 cells/L). The total phytoplankton was found to vary from 8.56 - 56.03, 8.20 -
26.32, 5.76 - 25.97 and 3.75 - 64.47 x 10⁴ cells/L in T1, T2, T3 and T4 respectively (Fig. 2). The highest (64.47 ± 9.41 x 10⁴ cells/L) cell density was
observed in T4 in August and the lowest (5.76 ± 2.33 x 10⁴ cells/L) in T3 in June.
Table 1: Water quality parameters (mean ± SD; n = 3) in experimental ponds under four treatments
Parameters T* June July August September October November
Transparency (cm)
T1 43.17±1.61 41.50±2.50 34.00±1.00 34.00±3.61 39.17±7.85 41.33±1.53 T2 58.75±3.25 44.00±2.65 40.00±3.00 38.33±2.31 44.67±8.08 41.33±5.13 T3 49.00±6.00 50.33±7.64 43.83±3.82 43.33±3.21 46.33±4.04 41.67±5.69 T4 45.00±6.24 42.00±8.00 34.00±3.00 31.67±6.51 40.67±1.53 38.33±1.53 Temperature
(oC)
T1 30.75±0.25 33.25±0.25 32.50±0.50 32.67±0.58 29.67±0.58 27.50±0.50 T2 30.25±0.25 33.95±0.05 32.50±0.50 32.00±1.00 29.69±0.58 28.00±1.00 T3 31.15±0.25 33.10±0.10 32.00±0.00 32.17±0.76 29.83±0.76 28.47±0.90 T4 30.65±0.65 33.75±0.25 31.67±0.58 31.83±0.29 29.33±0.58 28.30±0.66 DO (mg/L) T1 6.09±0.58 6.37±0.15 5.24±0.43 6.63±0.30 4.89±0.02 5.13±0.76
T2 8.34±0.47 7.95±0.45 5.57±0.35 5.07±0.97 5.00±0.26 5.01±0.29 T3 6.28±0.40 5.95±0.05 5.52±0.33 5.43±1.01 4.97±0.12 4.93±0.15 T4 7.75±0.22 7.90±0.27 4.84±0.06 5.03±0.25 5.37±0.38 4.70±0.75
pH
T1 7.50±0.33 7.32±0.28 7.24±0.11 7.30±0.02 7.13±0.12 7.20±0.07 T2 7.59±0.05 7.79±0.09 7.99±0.01 7.51±0.30 7.67±0.13 7.70±0.17 T3 7.70±0.51 7.69±0.29 7.59±0.49 7.33±0.45 7.71±0.17 7.59±0.30 T4 7.54±029 7.59±0.13 6.60±0.54 6.89±0.03 7.10±0.20 7.07±0.09 Total
Alkalinity (mg/L)
T1 89.33±4.16 86.00±4.00 78.67±3.06 74.00±9.29 71.33±2.70 60.00±9.17 T2 86.00±7.21 98.00±7.21 112.00±8.72 103.33±4.16 106.67±4.16 105.33±3.32 T3 92.67±9.24 99.67±9.45 98.00±2.00 97.33±5.01 99.33±4.16 95.33±7.57 T4 98.00±2.00 90.00±4.00 75.33±4.16 82.67±9.43 88.00±4.00 90.00±8.00
PO4-P (mg/L)
T1 0.71±0.37 0.79±0.11 0.64±0.14 0.67±0.28 0.39±0.04 0.36±0.05 T2 0.46±0.35 0.91±0.06 0.73±0.23 1.39±0.73 1.19±0.33 1.41±0.17 T3 0.49±0.12 0.51±0.19 0.74±0.14 0.54±0.10 0.56±0.10 0.54±0.15 T4 0.65±0.36 1.25±0.03 2.15±0.08 1.10±0.19 1.06±0.13 0.81±0.21
NO3-N (mg/L)
T1 0.12±0.03 0.56±0.22 0.90±0.20 0.80±0.22 0.66±0.19 0.63±0.37 T2 0.30±0.10 0.63±0.15 0.71±0.11 0.83±0.34 0.65±0.34 0.70±0.49 T3 0.23±0.16 0.65±0.05 0.73±0.12 0.76±0.10 0.51±0.27 0.42±0.05 T4 0.31±0.08 0.85±0.05 1.51±0.05 0.81±0.16 0.71±0.05 0.73±0.14
Chlorophyll-a
T1 34.89±2.43 151.25±6.00 152.10±4.71 103.80±1.75 96.41±6.39 72.83±2.74 T2 78.93±5.93 124±7.78 162.53±8.38 110.60±7.44 80.13±8.45 92.32±6.67 T3 45.58±4.29 90.10±2.48 120.48±5.07 129.87±5.57 87.37±2.19 75.68±9.03 T4 37.48±7.97 106.67±5.76 177.46 ±6.32 138.57±3.50 106.80±3.20 101.70±9.97 *treatments
Table 2: Generic status of phytoplankton found in the different ponds during the study period Phytoplankton group Genera under each group
Euglenophyceae Euglena, Phacus and Trachelomonas
Cyanophyceae Aphanocapsa,Aphanizomenon, Anabaena, Anabaenopsis, Chroococcus,
Gomphosphaeria, Microcystis, Merismopedia and Gloeocapsa
Chlorophyceae Actinastrum, Ankistrodesmus, Botryococcus, Chlorella, Coelastrum,
Closterium, Scenedesmus, Pediastrum, Tetraedon, Staurastrum, Selenastrum,
Ulothrix, Zygnema, Volvox, Oocystis and Micractinium
Bacillariophyceae Cyclotella, Fragilaria, Navicula, Nitzschia and Synedra
Figure 1: Cell densities (mean ± SD; n = 3) of total phytoplankton population in different treatments during the study period. Values accompanied by different letters are statistically and significantly different (p < 0.05)
Figure 2: Monthly variations in abundance (mean ± SD; n = 3) of total phytoplankton in the experimental ponds under four treatments during the study period. Asterisks denote statistically significantly different (*P < 0.01)
Abundance of euglenophytes
During the study period, 3 genera of euglenophytes (Euglena, Phacus and
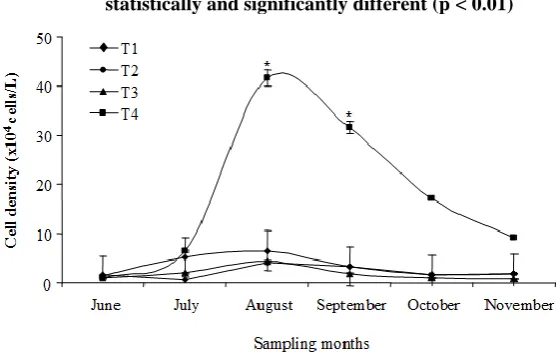
Trachelomonas) were recorded from the experimental ponds (Table 2). On the basis of mean value, it was observed that euglenophytes showed its highest cell density (17.62 ± 1.97 x 10⁴ cells/L) in T4 and ranked second (2.96 ± 0.20 x 10⁴ cells/L) in T2, followed by the ponds of T1 with a value of 1.94 ± 0.35 x 10⁴ cells/L. Euglenophytes showed the least
abundance (1.53 ± 0.42 x 10⁴ cells/L) in the ponds of T3 (Fig. 3). The number of euglenophytes ranged from 0.61- 4.12 x 10⁴, 1.41-b.57, 0.59 - 4,47 and 1.14 - 41.61 x 10⁴ cells/L in the ponds of T1, T2, T3 and T4 respectively (Fig 4). The highest cell density (41.61 x 10⁴ cells/L) was observed in the control ponds (T4) in August and the lowest (0.59 x 10⁴ cells/L) in the lime and duckweed treated ponds (T3) in June.
Figure 3: Cell densities (mean ± SD; n = 3) of euglenophytes in different treatments during the study period. Values accompanied by different letters are statistically and significantly different (p < 0.01)
Figure 4: Monthly variations in abundance (mean ± SD; n = 3) of total euglenophytes in the experimental ponds under four treatments during the study period. Asterisks denote statistical significant differences (*P < 0.01)
Figure 5: Species wise gross production of fish in different treatments during the study period. Gross productions of silver carp in all treatments are statistically and significantly different (p < 0.05)
Figure 6: Gross production of fish in different treatments during the study period. Values accompanied by different letters are statistically and significantly different (p < 0.05)
Table 3: Generic status of phytoplankton and zooplankton available in the gut contents of fishes Phytoplankton group Genera of each group
Euglenophyceae Euglena and Phacus
Cyanophyceae Aphanocapsa, Aphanizomenon, Anabaena, Chroococcus,
Gomphosphaeria and Microcystis
Bacillariophyceae Cyclotella, Fragilaria, Navicula, Nitzschia and Synedra
Chlorophyceae
Actinastrum, Ankistrodesmus, Botryococcus, Chlorella, Coelastrum, Closterium, Scenedesmus, Pediastrum, Tetraedon, Staurastrum, Selenastrum and Ulothrix Zooplankton group Genera of each group
Crustacea Cyclops, Daphnia and Nauplius Rorifera Brachionus and Keratella
Gut contents of fish
The analysis of gut contents of five species of fishes (rohu, catla, mrigal, silver carp and silver barb) in experimental ponds showed that they ate a variety of food items. Four groups of phytoplankton viz. euglenophytes, cyanophytes, chlorophytes and bacillariophytes consisting of 25 genera were identified and recorded from the gut contents of fishes during the study period (Table 3). Two groups of
zooplankton viz. crustacea and rotifera consisting of 5 genera were identified and recorded from the gut contents of fishes during the study period (Table 3). From the gut content analysis, it was observed that euglenophytes were found to be highest in the gut of silver barb followed by silver carp (Table 4). Less quantity of euglenophytes was found in the gut of rohu, catla and mrigal.
Table 4: Percent composition of euglenophytes in the gut of different fish species
Treatments Rohu Catla Mrigal Silver carp Silver barb
T1 3.92a 4.09a 1.75a 27.98b 28.99b
T2 4.52a 4.73a 2.61a 24.91b 31:85b
T3 2.78a 4.13a 3.16a 18.79b 31.11b
T4 4.14a 5.10a 1.78a 33.32b 42.69b a, b
Values with different characters are significantly different among species.
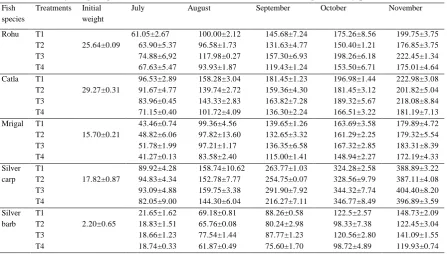
Table 5: Monthly weight (g; mean ± SD) of fishes in four treatments during the study period. Fish
species
Treatments Initial weight
July August September October November
Rohu T1
25.64±0.09
61.05±2.67 100.00±2.12 145.68±7.24 175.26±8.56 199.75±3.75 T2 63.90±5.37 96.58±1.73 131.63±4.77 150.40±1.21 176.85±3.75 T3 74.88±6,92 117.98±0.27 157.30±6.93 198.26±6.18 222.45±1.34 T4 67.63±5.47 93.93±1.87 119.43±1.24 153.50±6.71 175.01±4.64 Catla T1
29.27±0.31
96.53±2.89 158.28±3.04 181.45±1.23 196.98±1.44 222.98±3.08 T2 91.67±4.77 139.74±2.72 159.36±4.30 181.45±3.12 201.82±5.04 T3 83.96±0.45 143.33±2.83 163.82±7.28 189.32±5.67 218.08±8.84 T4 71.15±0.40 101.72±4.09 136.30±2.24 166.51±3.22 181.19±7.13 Mrigal T1
15.70±0.21
43.46±0.74 99.36±4.56 139.65±1.26 163.69±3.58 179.89±4.72 T2 48.82±6.06 97.82±13.60 132.65±3.32 161.29±2.25 179.32±5.54 T3 51.78±1.99 97.21±1.17 136.35±6.58 167.32±2.85 183.31±8.39 T4 41.27±0.13 83.58±2.40 115.00±1.41 148.94±2.27 172.19±4.33 Silver
carp T1
17.82±0.87
89.92±4.28 158.74±10.62 263.77±1.03 324.28±2.58 388.89±3.22 T2 94.83±4.34 152.78±7.77 254.75±0.07 328.56±9.79 387.11±4.08 T3 93.09±4.88 159.75±3.38 291.90±7.92 344.32±7.74 404.40±8.20 T4 82.05±9.00 144.30±6.04 216.27±7.11 346.77±8.49 396.89±3.59 Silver
barb T1
2.20±0.65
21.65±1.62 69.18±0.81 88.26±0.58 122.5±2.57 148.73±2.09 T2 18.83±1.51 65.76±0.08 80.24±2.98 98.33±7.38 122.45±3.04 T3 18.66±1.23 77.54±1.44 87.77±1.23 120.56±2.80 141.09±1.55 T4 18.74±0.33 61.87±0.49 75.60±1.70 98.72±4.89 119.93±0.74
Growth and production of fish
The growth of different species of fish viz. rohu, catla, silver carp, mrigal and silver barb in terms of weight gain was calculated and the obtained results are presented in table 5. The mean weight gain for all species was found to be the highest in T3 followed by T1. The lowest mean weight gain was recorded in the ponds of T4. On the basis of species wise gross fish production (Fig. 5) it was observed that silver carp showed the highest production followed by silver barb. The gross yields of fishes were 2133.60, 1967.75, 2816.51 and 1726.86 kg/ha/5 months in the ponds of T1, T2, T3 and T4, respectively (Fig. 6).
Discussion
The present study was conducted to control euglenophytes bloom for achieving better fish production using duckweed and lime in aquaculture ponds. The highest fish production which was obtained from duckweed and lime treated ponds indicates that the use of duckweed and lime are sustainable in controlling euglenophytes bloom, maintaining water quality and in achieving enhanced fish production.
The water quality parameters such as water temperature (°C), transparency (cm), dissolved oxygen (mg/L), pH, total alkalinity (mg/L), PO4-P (mg/L), NO3-N (mg/L) and chlorophyll-a contents of the experimental ponds were within the productive ranges and there was no abrupt change in any parameters of the pond water during the tenure of experiment (Table 1). Within limit, productive ranges of such water quality parameters have also
been observed by a number of other authors (Dewan et al., 1991; Wahab et al., 1995; Kohinoor et al., 1998; Haque et al., 1998; Uddin et al., 2007; Chowdhury et al., 2008).
A total number of 33 genera (Table 2) of phytoplanktons belonging to Euglenophyceae (3), Cyanophyceae (9), Bacillariophyceae (5) and Chlorophyceae (16) were recorded in the present study which strongly agrees with Kohinoor (2000) who recorded 34 genera of phytoplankton belonging to Euglenophyceae, Cyanophyceae, Bacillariophyceae and Chlorophyceae. More or less similar numbers of genera were recorded in the plankton population in the ponds of Bangladesh Agricultural University campus (Dewan et al., 1991; Wahab et al., 1995; Kohinoor et al., 1998). The mean abundance of total phytoplankton (Fig. 1) was significantly higher in T4 (32.42 ± 2.25 x 10⁴ cells/L), followed by T1 (27.39± 5.36 x 10⁴ cells/L), T2 (16.95 ± 7.24 x 10⁴ cells/L) and T3 (13.85 ± 7.58 cells/L). Phytoplankton abundance in aquaculture ponds were recorded in some other studies ranging from 2.0 - 8.0 x 10⁵ cells/L (Dewan et al., 1991), to 9.26 - 16.03 x 10⁴ cells/L (Wahab et al., 1991) and 10.70 - 50.65 x 10⁴ cells/L (Haque et al., 1998). The higher abundance of phytoplankton in the present study might be due to regular application of fertilizers.
The mean abundance of euglenophytes (17.62 x 10⁴ cells/L) was significantly higher inT4 (Fig. 3). On the other hand, euglenophytes showed monthly variations
(Fig. 4) and peaked during the August. The higher densities of euglenophytes in August might be due to comparatively higher water temperature (30 °C), acidic environment (pH around 6.5) and higher concentrations of nutrients (NO3-N and PO4-P). Kant and Kachroo (1977) observed that the maximum development of euglenophytes were in March and September. Most species of Euglena and Phacus can grow at high degrees of organic pollution (Tripathi and Sukla, 1993), high temperature and acidic environment (Olaveson et al., 1989; Xavier et al., 1991; Zakrys and Walne, 1994; Olaveson et al., 2000), at high organic loading rates (Phang and Ong, 1988). Higher numbers of euglenoid species were recorded when water temperature, nutrient values and BOD were high (Nwanknwo, 1995; Perniel et al., 1998). On the other hand, the lower cell density (Fig. 3) of euglenophytes was observed in the lime and duckweed treated ponds (T3) which might be due to alkaline pH and nutrient absorption by the duckweed. This result indicated that duckweed and lime are important to control euglenophytes bloom in aquaculture ponds.
From the gut content analysis, it was observed that euglenophytes were found to be highest in the gut of silver barb followed by silver carp (Table 4). Less quantities of euglenophytes were found in the gut of rohu, catla and mrigal. Silver carp and silver barb are widely represented as being planktivorous (Cremer et al., 1980; Miah et al., 1984). On the other hand, Bacillariophyceae was found to be the most dominant and preferred foods of silver barb (Mondol,
2000) which is in controversy to the present study. This might be due to changes in the feeding activity with change in season (Mirza, 1984) and also to shift in the electivity index in different species combinations considering the extent of intra and inter specific competitions (Wahab et al., 1991). However, silver carp and silver barb may use to control euglenophytes bloom in aquaculture ponds.
Fish growth rate depends on various factors such as genetic growth potential, culture techniques, environmental parameters and nutrients. In the present study, mean weight gain for all species was the highest in T3 followed by T1 (Table 5). Variations in fish production among different treatments might be due to bloom of euglenophytes as well as difference in the use of nutritional values of the fertilizers and manures used as production inputs. On the basis of species wise gross production it was observed that silver carp showed the highest production followed by silver barb (Fig. 5). The feeding tendency towards euglenophytes by these two species might explain the higher production of these two species. The gross yields were 2133.36, 1967.75, 2816.51 and 1726.86 kg/ha/5 months in T1, T2, T3 and T4, respectively (Fig. 6). The highest production of fish was obtained from lime and duckweed treated ponds (T3) that might support better water quality parameters and plankton populations. The lowest yields were found in control ponds (T4) which might be due to heavy bloom of euglenophytes that occurred in August. Fish production
in polyculture systems carried out by a number of other studies ranged from 5294 to 5670 kg/ha/yr in carp-silver barb culture (Wahab et al., 1995), while the productions of Indian major carp and Chinese carps were 1699 to 1870 kg/ha/5 months (Wahab et al., 1994), 3670 kg/ha/year (Miah et al., 1993), 3600 kg/ha/yr (Mazid et al., 1997). The findings of the present study are consistent with those obtained from these other studies.
To conclude, the better fish production approach in aquaculture system can be justified by controlling euglenophyte bloom which has been demonstrated by the present experiment where both duckweed and lime were used.
Acknowledgments
The financial support for World fish centre, Dhaka, Bangladesh is acknowledged. The authors wish to express their appreciation to Dr. MGQ Khan for his assistance, editing and valuable instruction during the preparation of this manuscript.
References
Bellinger E. G., 1992. A key to common algae: estuarine and some coastal species. The Institute of Water and Environment Management, London, UK, pp. 15-21.
Boyd C. E., 1982. Water quality management for pond fish culture. Elsevier Sci Pub Co Amsterdam-Oxford-New York, 318 pp.
Chowdhury M. M. R., Shahjahan M., Rahman M. S. and Sadiqul Islam M., 2008. Duckweed (Lemna minor) as supplementary feed in monoculture
of nile tilapia, Oreochromis niloticus. Journal of Fisheries and Aquatic Sciences, 3, 54-59.
Cremer M. C. and Smitherman R. O., 1980. Food habits and growth of silver carp and bighead carp in cages and ponds. Aquaculture, 20, 57-64.
Dewan S., Wahab M. A., Beveridge M. C. M., Rahman M. H. and Sarker B. K., 1991. Food selection, electivity and dietary overlap among planktivorous Chinese and Indian major carps and fingerlings grown in extensively managed rain-fed ponds in Bangladesh.
Journal of Aquaculture and Fisheries Management, 22, 277-294.
Haque M. S., Wahab M. A., Wahid M. I. and Haq M. S., 1998. Impacts of Thai silver barb (Puntius gonionotus
Bleeker) inclusion in the polyculture of carps. Bangladesh Journal of Fisheries Research, 2, 15-22.
Journey F., Landolt E. and Kandeler R., 1991. The family of Lemnaceae- a monographic study. Veroffentlich Ungen Des Geobotani Schen Institutes der Edg. Tech. Hochhule, Stiffung Ruobel, Zuerich, 638 pp.
Kant S. and Kachroo P., 1977.
Limnological studies in Kashmir Lakes. Hydrological features, composition and periodicity of phytoplatikton in the Dal and the Nagin Lakes. Phykos 16, 77-97.
Kohinoor, A. H. M., 2000. Development of culture technology of three small indigenous fish mola (Amblypharyngodon mola), punti (Puntius gonionotus) and chela (Chela cachius) with notes on some aspects of their biology. Ph.D. Thesis.
Department of Fisheries Management, Bangladesh Agricultural University, Mymensingh, 363 pp.
Kohinoor A. H. M., Islam M. L., Wahab M. A. and Thilsted S. H., 1998.
Effect of mola (Amblypharyngodon mola Ham.) on the growth and production of carps in polyculture.
Bangladesh Journal of Fisheries Research, 2, 119-126.
Leupold M. A. 1988. Water quality Assessment. Experimental Phycology: A Laboratory Mannual, pp. 47-55.
Mazid M. A., Zaher M. Z., Begum N. N., Ali M. Z. and Nahar F., 1997.
Formulation of cost effective feeds from locally available ingredients for carp polyculture systems for increased production. Aquaculture,
151, 71-78.
McIntosh A. W. and Kevern N. R., 1974. Toxicity of copper to zooplankton. Journal of Environmental Quality, 3, 166-170.
Miah M. S., Shahabuddin M. and Shah M. S., 1993. Effects of supplementary feed in carps polyculture systems. Bangladesh Journal of Agriculture Sciences, 20, 359-364.
Miah M. J. U., Dewan S. and Wahiduzzaman M., 1984. Studies on the type and amount of food taken by the silver carp,
Hypophthalmichthys molitrix and its diel, patterns of feeding in a Bangladesh pond. Bangladesh Journal of Fisheries, 7, 43-54.
Mirza J. A., 1984. Food and feeding habits of silver carp. Bangladesh Journal of Fisheries, 7, 31-35.
Mondol M. M. R., 2000. Food and Feeding habits of Amblypharyngodon mola (Mola), Puntius gonionotus (Thai sarpunti) and Cyprinus carpio
(Common carp) in rice field. M.S. Thesis. Department of Fisheries Management., Bangladesh Agricultural University, Mymensingh, 97 pp.
Needham J. G. and Needham P. R., 1962. A Guide to the study of Freshwater Biology. 5th edition, Liolden-day Inc., San Francisco, 106 pp.
Nwankwo D. I., 1995. Euglenoids of some polluted storm-water channels in Lagos, Nigeria. Tropical Freshwater Biology, 4,29-39.
Olaveson M. M. and Nalewajko C., 2000. Effects of acidity on the growth of two Euglena species.
Hydrobiologia, 433, 39-56.
Olaveson M. M. and Stokes P. M., 1989. Responses of the acidophilic alga Euglena mutabilis
(Euglenophyceae) to carbon enrichment at pH 3. Journal of Phycology, 25, 529-539.
Perniel M., Ruan R. and Martinez B., 1998. Nutrient removal from a stormwater detention pond using duckweed. Appl Engg Agric, 14, 605-609.
Phang S. M. and Ong K. C., 1988.
Algal biomass production in digested palm oil mill effluent. Biol wastes, 25, 177-191.
Prescott G. W., 1964. Algae of the Western Great Lakes Area. Wm. C. Brown. Co., Inc. Dubyque. Iowa, 946 pp.
Rahman M. S., 1992. Water quality Management in Aquaculture. BRAC Prokashana, Dhaka, 84 pp.
Rahmani G. N. H. and Sternberg S. P. K., 1999. Bioremoval of lead from water using Lemna minor. Biores Technol, 70,225-230.
Sharma K. P., Chaturvedi R. K., Sharma S. and Sharma K., 2000.
Scavenging potential of hydrophytes for copper removal from textile dye wastewaters. Bulletin of Environment Contamination and Toxicology, 65, 330-336.
Tripathi S. K. and Shukla A. C., 1993.
Euglenoids as indicators of Ganga waters pollution. Khidrobiologiya-Hydrobiology, 38, 27-32.
Uddin M. N., Rahman M. S. and Shahjahan M., 2007. Effects of duckweed (Lemna minor) as supplementary feed on monoculture of GIFT strain of tilapia (Oreochromis niloticus). Progressive Agriculture,
18, 183-188.
Wahab M. A., Ahmed Z. F., Islam M. A. and Rahmatullah S. M., 1995. Effect of introduction of common carp
(Cyprinus carpio) (L) on the pond ecology and growth of fish in
polyculture. Aquaculture Research,
26, 619-628.
Wahab M. A., Begum M. A. and Ahmed Z. F., 1991. The effects of silver carp introduction in the polyculture of major Indian carps. BAURes Progressive, 5, 429-437.
Wahab M. A., Ahmed Z. F., Haq M. S. and Begum M., 1994. Compatibility of silver carp in the polyculture of cyprinid fishes. Progressive Agriculture,5, 221-227.
Xavier M. B., Mainardes Pinto C. S. R. and Takino M., 1991. Euglena sanguinea, Ehrenberg bloom in a fish-breeding tank (Pindamonhangaba, Sao Paulo, Brazil). Arch Hydrobiol Suppl, Algological Studied, 26, 133-142.
Zakrys B. and Walne P. L., 1994.
Floristic, taxonomic and phytogeographic studies of green Euglenophyta from the Southeastern United States, with emphasis on new and rare species. Arch Hydrobiol Suppl, 102, 71-114.