Regular Article
ANALYTICALAND BIOANALYTICAL CHEMISTRY
RESEARCH
Published by the
Iranian Chemical Society
Anal. Bioanal. Chem. Res., Vol. 1, No. 2, 117-127, December 2014.
A Simple Image Analysis Method for Determination of Glucose by using Glucose
Oxidase CdTe/TGA Quantum Dots
J. Tashkhourian*, M. Akhond*, S. Hooshmand, T. Khosousi and B. Hemmateenejad
Department of Chemistry, College of Sciences, Shiraz University, Shiraz 71456, Iran
(Received 20 June 2014, Accepted 16 October 2014)
Glucose, as the major energy source in cellular metabolism, plays an important role in the natural growth of cells. Herein, a simple, rapid and low-cost method for the glucose determination by utilizing glucose oxidase and CdTe/thioglycolic acid (TGA) quantum dots (QDs) on a thin layer chromatography (TLC) plate has been described. The detection was based on the combination of the glucose enzymatic reaction and the quenching effect of H2O2 on the CdTe/TGA quantum dots photoluminescence. This QDs-based assay exhibits several
advantages. Enzyme immobilization and QDs modification process are not required and the high stability of the QDs towards photobleaching is beneficial to this sensing system. The proposed method is linear in concentration range of 1.00 × 10⁻¹-3.00 × 10⁻⁵ M of glucose and has a detection limit of 1.25 × 10⁻⁸ M. The results of real sample analysis show that the glucose oxidase CdTe/TGA QDs system would be a promising glucose-biosensing system.
Keywords: Image analysis, CdTe/TGA Quantum dots, Glucose, Glucose oxidase
INTRODUCTION
Chemical sensors and biosensors are becoming increasingly indispensable tools in chemistry environmental monitoring, industry, life science, medicine and biotechnology [1]. A biosensor is defined as a detecting device that combines a transducer with a biologically sensitive and selective component. Biosensors are critical for medical diagnostic and can measure compounds present in the environment, chemical processes, food and human body at low cost if compared with traditional analytical techniques. Recently, a tremendous research effort has been invested on miniaturization and construction of small integrated biosensors that are more affordable and more sensitive. Based on the type of transducer employed (electrochemical, optical, piezoelectric and thermal) biosensors can be broadly classified to electrochemical sensors and optical sensors [2-5]. Colorimetric optical assays are useful tools for the determination of chemical compounds in complex matrices. They have many advantageous such as: low costs,
*Corresponding author. E-mail: [email protected]
time saving, no need to sophisticated equipment, and significantly selective when they are properly tailored. Today, optical sensors are used in numerous research, and commercial applications.
lifetime in their use as optical labels [11]. Among various semiconductor materials, CdTe is one of the substances providing very high luminescence quantum efficiency [12]. CdTe QDs show increasing promise due to their large excitation Bohr radius (7.3 nm) and narrow bulk band gap of 1.4 eV and have been widely studied as luminescence probes and sensors [13].
Glucose, a simple sugar (monosaccharide), is an important carbohydrate in biology. Cells use it as a source of energy and a metabolic intermediate and its lack or excess can produce detrimental influence on cellular functions. The glucose level in blood is usually used as a clinical indicator of diabetes, and the monitoring of glucose levels in blood with faster and more accurate methods have become an increasingly active area of research [14-20]. Glucose detection plays an important role from several points of view ranging from life-science [21], biology [22,23], clinical analysis [24], food industry [25] and so forth. Since the first proposal of glucose sensor, in 1962 [26], a great deal of effort has been focused on fabricating smart sensors for precisely monitoring the glucose level, with high sensitivity, fast response, high reliability, good selectivity, and low cost [27]. The most widely used methods for the determination of glucose are based on the monitoring of hydrogen peroxide produced stoichiometrically during the oxidation of glucose by dissolved oxygen in the presence of glucose oxidase. Many glucose-assay methods, such as surface plasmon resonance (SPR) spectroscopy [28,29], fluorescence signal transmission [20,30-32] and electrochemical signal transduction [33-34] have been reported. Among these, the widely used commercial glucose test employs electrochemical sensors. In contrast to the electrochemical sensing method, the optical sensors are selective and nondestructive, easy to miniaturize, and require low power supply, and have been extensively used for glucose detection.
The scanner spectroscopy method was, firstly, introduced by Abbaspour’s research group [35]. In this method instead of measuring the transmittance or absorbance of light, the reflection properties of the strip were measured by using a hand scanner. Data stream composed of red, green, and blue (RGB) light intensities and the quantity and quality of analytes in the solution were estimated by applying of mathematical methods.
Herein, a glucose biosensor using the immobilized glucose oxidase (GOD) and CdTe/TGA QDs on a thin layer chromatography (TLC) plate is developed. In addition to easy storage and transport, rather than a solution-based sensor, the present strategy is based on possible realization of the chip-based sensors which will be designed in an array format for rapid, and high-throughput detection. In this work, using CdTe/TGA QDs as probes, it is intended to develop a new method for the determination of glucose based on the color change of CdTe/TGA QDs. Compared to other methods such as spectrophotometry and electrochemistry, this method is thought to be very simple and low cost for detection of glucose.
EXPERIMENTAL
Materials and Reagents
Analytical reagent grade CdCl2, thioglycolic acid,
glucose, silver nitrate, sodium borohydride, urea, ascorbic acid, acetaminophen, sodium hydroxide, phosphoric acid, fructose, lactose and saccharose (all from either Fluka or Merck chemical companies) were used as received without further purification. Tellurium powder and glucose oxidase were purchased from Sigma-Aldrich.
Instrumentation
The scanner (Canoscan-4200F) was used for scanning the TLC strip (Merck). Resolution of the scanner was regulated at 600 dpi. For analyzing color values in RGB (red, green, and blue) system, the Adobe Photoshop software CS6 (version 12) was used. An eppendorf micropipette was used for injecting samples on TLC strip. The pH values of buffer solutions were measured by a Metrohm (780) pH meter. The UV-Vis absorbance spectra were recorded on a Pharmacia Ultraspec model 4000UV/Vis double beam spectrophotometer. A Philips, model CM 10 transmission electron microscopy (TEM) was also used to determine the size and dispersivity of the silver nanoparticles.
Preparation of CdTe/TGA QDs
A Simple Image Analysis Method for Determination of Glucose/Anal. Bioanal. Chem. Res.,Vol. 1, No. 2, 117-127, December 2014.
stirring. After reduction of Te, a certain volume of the NaHTe solution was injected into a CdCl2 solution,
containing thioglycolic acid and deaerated by Ar gas. The molar ratio of Cd2+/Te2-/TGA was set to 1:0.5:2.4. The colloidal solution can be kept more than six months without any visible aggregation.
Images Analysis
Numerical data can be extracted from the scanner images. Color effective intensity for any RGB values of the color spot was calculated as follows:
AR = RS/Rb (1)
AG = GS/Gb (2)
AB = BS/Bb (3)
Here the AR, AG, and AB variables refer to the effective
intensity values at the three primary color ranges. The RS,
GS, and BS values correspond to average of red, green, and
blue light intensities of the sample, and Rb, Gb, Bb are
defined as average light intensities measured for the QDs /TLC plates as a blanks.
Procedure
Glucose forms a colorless product with CdTe/TGA QDs in the presence of glucose oxidase (GOx). To construct
stratified layer of strip biosensor for glucose, 10.0 μl of CdTe/TGA QDs were placed dropwise, with micropipette, on a TLC strip (1.5 × 1.5 cm), which produced orange color.
Then, 10.0 μl of GOx was injected on the CdTe/TGA QDs
and was dried at room temperature. Aliquots of 10.0 μl of glucose solutions were injected on separate dried TLC biosensor strips with immobilized CdTe/TGA and GOx. Sixteen minutes after formation of the colorless spots, the strips were scanned with scanner, and images of spots were analyzed by the written computer software for finding their R, G and B values. These values were used for obtaining the calibration curve.
RESULTS AND DISCUSSION
In this research, the scanner spectroscopy has been used as a tool to study the interaction between enzymatic reaction of
glucose and CdTe/TGA QDs. The CdTe/TGA QDs were chosen because of the maturity of water synthetical techniques, especially the controllability of particle sizes and multiple choice of capping ligands. Thioglycolic acid (TGA) was chosen as the modifier of QDs. Thioglycolic acid (TGA) is a popular, short and straight-chain stabilizing agent because its small steric hindrance is more effective as a stabilizing agent for QDs than the long and branched-chain agents to produce highly stable CdTe/TGA QDs [37-38].
Characterization and Spectral Features of
CdTe/TGA QDs
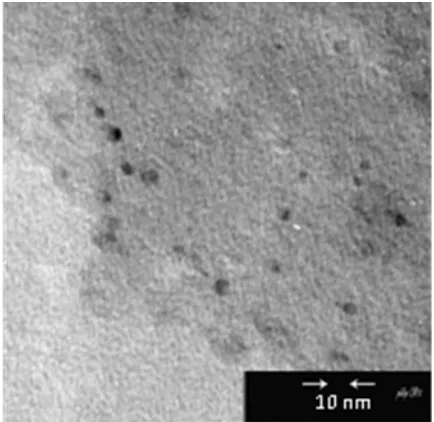
To investigate the prepared CdTe/TGA QDs, their UV-Vis and fluorescence spectra and also TEM image were recorded. As the reaction proceeded, the solution changed from colorless to transparent yellow and finally to red. Figure 1 shows the corresponding fluorescence and absorption spectra of this CdTe/TGA QDs. The absorption spectra were taken from prepared solution without dilution, and the fluorescence spectra were measured on as-prepared CdTe/TGA colloidal solutions taken from the refluxing reaction mixture. In the absorption spectra, the λmax CdTe
QDs is located at 541 nm. The sharp and narrow emission peak in the fluorescence spectra indicates that the nanoparticles have desirable dispersibility, and good fluorescence properties. The TEM image of CdTe/TGA QDs, as shown in Fig. 2, indicate that these nanoparticles have an average diameter of about 3.7 nm [39].
Principle of Operation
The basic principle of the CdTe/TGA QDS based glucose sensor is shown in Fig. 3. The detection is based on the combination of the glucose enzymatic reaction and the quenching effect of H2O2 on photoluminescence of the
CdTe/TGA QDs. The response mechanism of this sensor is based on the spot test phenomenon. In this sensor, hydrogen peroxide produced from enzymatic reaction of glucose diffuses into the TLC pores, and causes QDs to be colorless. It is assumed that in the presence of H2O2, the thiol
Fig. 1. UV-Vis absorption and fluorescence spectra of CdTe/TGA QDs.
Fig. 2. TEM image of CdTe/TGA QDs [39].
mechanism relied on the electron-transfer reaction occurring at the surface of the QDs where H2O2 is reduced to O2. This
property, in turn, lies in electron/hole traps on the QDs, which could be used as a good electron acceptor to form the non-fluorescent QDs anion and reduce the fluorescence [41,42].
Optimization of Parameters
To achieve figures of merit for glucose determination,
Fig. 3. Basic principle of QD-based glucose sensor.
Fig. 4. Surfaces of TLC with (a) 0.0 µl, (b) 3.0 µl, (c) 6.0µl (d) 9.0 µl and (e) 12 µl of QDs.
Fig. 5. Effect of injection volume of QDs solution on the response of colorimetric paper biosensor, glucose concentration 1.0 × 10⁻³ M; GOx, 5.0 mg ml-1; pH 6.5.
some key factors that influence on the glucose detection were studied. The concentration of GOx, pH, injection volume of CdTe/TGA QDs and glucose were optimized.
A Simple Image Analysis Method for Determination of Glucose/Anal. Bioanal. Chem. Res.,Vol. 1, No. 2, 117-127, December 2014.
the presence of 1.0 × 10⁻³ M glucose at pH = 6.5 is presented in Fig. 5. The results show that when the volume of QDs is increased, the color intensity is decreased and when 3.0 µl of QDs is injected on TLC, maximum color intensity is obtained. It seems that injection volumes more than 3.0 µl have created a non-uniform surface.
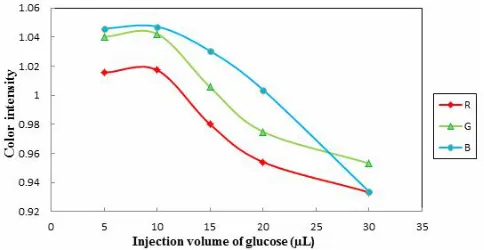
Injection volume of analyte. The influence of volume of analyte solution that must be injected on TLC strip was investigated. The optimum sample volume was obtained to be 10.0 µl. With greater injected volumes, spot spreading occurs due to diffusion, and consequently, the intensity of color is decreased. Results of this experiment are presented in Fig. 6.
Effect of pH. Since pH plays an important role in the enzymatic reactions, the effect of pH on the enzymatic reaction was studied. The quenching effect of glucose on the color intensity of QDs was investigated over a wide pH range of 3.5-9.5 adjusted with phosphate buffer as shown in Fig. 7. It is found that at pH 6.5, there is a maximum change in the color intensity. Therefore, pH 6.5 was chosen as the working pH when phosphate buffer solution (PBS) was used for adjusting pH of glucose solution and for further studies. Since enzymes are proteins, they are very sensitive to changes in pH. Each enzyme has its own optimum range for pH where it will be most active. This is the result of the effect of pH on a combination of factors: (1) the binding of the enzyme to the substrate, (2) the catalytic activity of the enzyme, (3) the ionization of the substrate, and (4) the variation of protein structure. The GOx enzyme typically is most active in a pH range of 4.0-7.0. Extremely high or low pH values generally result in complete loss of enzyme activity so maximum change in the color intensity was seen in pH 6.5. Also at low pH values, the fluorescence intensity decreases as a possible result of the deconstruction of the Cd2+-TGA complexes’ annulus due to the protonation of the surface binding thiolates [43].
Effect of glucose oxidase (GOx) concentration. The effect of enzyme concentration was studied by fixing glucose concentration at 10-3 M (10 µl). The concentration of GOx was varied from 3.0 to 8.0 mg ml-1. The color intensity values were increased by GOx concentration and maximum effective intensity was observed at 5.0 mg ml-1. The decrease in color intensity at GOx concentration >5.0 mg ml-1 could be due to lower substrate concentrations, as
Fig. 6. Effect of injection volume of glucose solution on the response of colorimetric paper biosensor, glucose concentration 1.0 × 10⁻³ M; GOx, 5.0 mg ml-1; pH 6.5.
Fig. 7. Effect of solution pH on the response of colorimetric paper biosensor, glucose concentration, 1.0 × 10⁻³
M; GOx, 5.0 mg ml-1; pH range from 3.5 to 9.5.
the reaction rate is strictly proportional to the substrate concentration. When the substrate concentration increases beyond a certain level, the binding sites are not sufficient for them. However, the reaction rate will only increase if the substrates are in excess. No matter how much substrate is available, if there is not an equal amount of enzyme to bond with, the leftover enzymes are left idle. The bonding of all substrates to all enzymes causes the reaction rate to reach to a maximum value which is called saturation. If the enzyme concentration increases further, there will be no effect on the rate because now there are enzymes that do not even need to work and may be prevented from effect of H2O2 on
Fig. 8. Effect of the GOx concentration on the response of colorimetric paper biosensor, glucose concentration, 1.0 × 10⁻³ M; GOx concentration range from 3.0 to 8.0 mg ml-1; pH, 6.5.
Fig. 9. Effect of reaction time on response of colorimetric paper biosensor, glucose concentration 1.0 × 10⁻³
M, GOx concentration 5.0 mg ml-1; pH 6.5.
Response time of the system. The response time of the system was evaluated under optimum experimental conditions for 1.0 × 10⁻³ M glucose (10.0 µl) by measuring the time required to achieve a 90% value of the steady color intensity. The results are shown in Fig. 9. The response time of the sensor was found to be 16 min.
Response stability of the system.To study the stability of color spot, 10.0 µl of glucose (1.0 × 10⁻³ M) was analysed under optimum experimental conditions. Scanning of the strip was done during the time periods of 5, 20, 35, 50, 75, 90, 105 and 120 min. The response, the sensor was stable
Fig. 10. Decay time of the signal of glucose colorimetric paper biosensor.
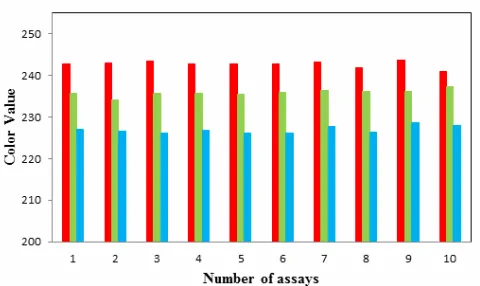
Fig. 11. Results of investigation of reproducibility.
for about 1.5 h after injection of sample because there was no change in the color intensity. Results of this study are shown in Fig. 10.
Reproducibility. To assess the precision of the method, determinations were carried out for a set of 10 measurements of 1.0 × 10⁻³ M glucose under optimal condition. The results are shown in Fig. 11 indicating that the sensor had a good precision.
Calibration Curve
A Simple Image Analysis Method for Determination of Glucose/Anal. Bioanal. Chem. Res.,Vol. 1, No. 2, 117-127, December 2014.
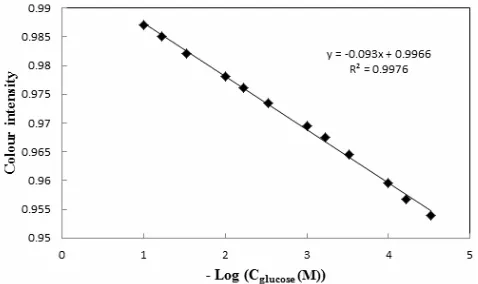
Fig. 12. Linear calibration curve for glucose (blue/red color intensity), concentration range from 1.0 × 10⁻¹ to 3.0 × 10⁻⁵ M; GOx 5.0 mg ml-1; pH 6.5.
analyzed using Photoshop program. Each pixel (elements of CCD) represents three values in the range of 0 to 255 corresponding to R, G and B color intensities. The assigned R, G and B values for black color are 0, 0 and 0 and for white color are 255, 255 and 255, for other colors they are between these extreme values. The average RGB values of pixels of each spot were taken as the analytical signals.
Figure 12 shows the calibration curve for glucose. The blue color intensity to the red color intensity ratio was found to be the most sensitive color with a wide linear range, so it was selected for data processing. Linear range of glucose in blue/red color intensity is 1.00 × 10⁻¹-3.00 × 10⁻⁵ M, as shown in Fig. 12.
Table 1. Detection Limit and Linear Range of Glucose by the Proposed System
Analytical signal Linear range (M) Detection limit (M)
R 1.00 × 10⁻¹-3.00 × 10⁻³ 1.91 × 10⁻⁵ G 1.00 × 10⁻¹-6.00 × 10⁻² 3.00 × 10⁻⁵ B 1.00 × 10⁻¹-6.00 × 10⁻² 4.26 × 10⁻⁵ B / R 1.00 × 10⁻¹-3.00 × 10⁻⁵ 1.25 × 10⁻⁸ R/G 1.00 × 10⁻¹-3.22 × 10⁻³ 2.42 × 10⁻⁶ R/B 1.00 × 10⁻¹-2.25 × 10⁻⁴ 1.25 × 10⁻⁶ G/R 1.00 × 10⁻¹-1.00 × 10⁻³ 5.32 × 10⁻⁶ G/B 1.00 × 10⁻¹-3.20 × 10⁻² 3.58 × 10⁻⁵ B/G 1.00 × 10⁻¹-4.30 × 10⁻⁴ 4.12 × 10⁻⁷
Table 2. The Effect of Various Species on Response of Colorimetric Paper Biosensor, Glucose Concentration of 1.0 × 10⁻³ M; GOx Concentration of 5.0 mg ml-1; pH 6.5
Species Fold of coexisting
substance of not causing interference ΔI
a
/I0
Acetaminophen 100 0.0078
Ascorbic acid 100 0.0219
Urea 100 0.0231
Saccharose 100 0.0015
Fructose 100 0.0089
Lactose 100 0.0065
a
ΔI = I - I0 where I0 and I are the color intensity of CdTe-Gox-glucose system in absence and
Detection Limit
Detection limit (DL) was calculated according to the following equation:
Where K is the confidence factor and most often chosen to be 2 or 3 (in the following Table K = 3), Sbk is standard
deviation of the blank measurement (n = 25) and m is the calibration slope. Results indicated that blue color intensity/red color intensity ratio is more sensitive to glucose concentration and has a wide linear range. The results are shown in Table 1.
Foreign Species Effect
The selectivity of a biosensor depends on two major factors: the enzyme-substrate reaction and selective measurements. The enzyme-substrate reaction is very
specific due to the nature of enzyme functionality. Glucose oxidase can only react with glucose without interfered by other types of sugars. To study the selectivity of the proposed method, the effect of various species such as urea, ascorbic acid, acetaminophen, saccharose, fructose, lactose on the determination of 1.0 × 10⁻³ M glucose was tested under optimum experimental conditions, which indicated no significant interferences. The results are given in Table 2.
Analysis of Artificial Urine
The proposed sensor was applied for the glucose determination in urine. Synthetic urine sample was prepared according to literature recommendation [44]. To do determination in urine, a certain amount of glucose was spiked to the urine, and their concentrations were determined by the proposed methods. The results are given in Table 3.
Table 3. Determination of Glucose in Artificial Urine
Artificial Urine Spiked (mM) Found (mM) Recovery (%)
1 2
0 0.50
ND* 0.49
- 98.00
3 0.10 0.104 104.00
4 0.050 0.047 94.00
Not detected.
Table 4. Analytical Results of Glucose in the Human Serum Samples
Real sample Measured (M)a Spiked (M) Found (M) Recovery(%)
1 0.35 × 10⁻³ - 0.34 × 10⁻³ -3.00 × 10⁻³ 3.42 × 10⁻³ 102.67 6.00 × 10⁻³ 6.16 × 10⁻³ 97.00 9.00 × 10⁻³ 9.82 × 10⁻³ 105.33 2 1.25 × 10⁻³ - 1.18 × 10⁻³
-3.00 × 10⁻³ 4.10 × 10⁻³ 97.33 6.00 × 10⁻³ 7.11 × 10⁻³ 98.83 9.00 × 10⁻³ 10.38 × 10⁻³ 102.22
a
A Simple Image Analysis Method for Determination of Glucose/Anal. Bioanal. Chem. Res.,Vol. 1, No. 2, 117-127, December 2014.
Analysis of Real Sample
In order to evaluate the feasibility of the proposed method, the developed scanner spectroscopic method was applied to the determination of glucose in three human serum samples. Deproteinization method [45] was used for glucose determination in human serum samples due to the interference of available proteins in serum with glucose measurement. The results of real sample analysis are listed in Table 4.
CONCLUSIONS
In this work, we have utilized the water-dispersible CdTe/TGA QDs as a reliable agent for the enzymatic detection of glucose concentration. A mechanism is put forward based on the color change of the CdTe/TGA QDs, which is caused by the H2O2 produced from the
GOx-catalyzed oxidation of glucose. This QD-based assay exhibits several advantages. First, enzyme immobilization
and QDs modification process are not required. Second, the high stability of the QDs towards photobleaching is beneficial to this sensing system. Third, this QD-based assay can sensitively detect glucose over a wide concentration range with the detection limit of 1.25 × 10⁻⁸ M, which can be used for the direct detection of lower levels of glucose in complicated biological systems. Moreover, the detection carried out on TLC plates make the measurement more convenient and portable. Given these unparalleled advantages, we expect that this QD-based label-free assay would be a promising tool for clinical diagnose of glucose and other fields. Comparison of different methods for the determination of H2O2 and glucose
with the proposed method is reported in.
ACKNOWLEDGMENTS
We gratefully acknowledge the support of this work by the Shiraz University Research Council.
Table 5. Comparison of Different Methods for the Determination of H2O2 and Glucose
Method System Linear range (M) Detection limit (M) Ref.
Fluorescence spectroscopy
Fluorescence quenching of the QDs by H2O2
1.8 × 10⁻⁶-1.0 × 10⁻³ 1.8 × 10⁻⁶ [40]
UV-Vis spectroscopy
The biosensor consisted of glucose oxidase (GOD) and horseradish peroxidase
2.7 × 10⁻⁴-3.3 × 10⁻² 5.55 × 10⁻⁴ [46]
UV-Vis spectroscopy
Oxidative reaction with potassium
ferricyanide 2.5 × 10
-3
-5.0 × 10⁻² 0.61 × 10⁻⁵ [47]
Spectrophotometric method
Quantitative determination of glucose with potassium ferricyanide as the oxidant
1.61 × 10⁻⁵-3.7 × 10⁻⁴ - [48]
Fluorescence spectroscopy
Based on nanocomposite films of CdTe quantum dots and glucose oxidase
0.5 × 10⁻³-16 × 10-3 0.5 × 10⁻³ [49]
Colorimetric method
Based on changes in the
physicochemical properties of ceria nanoparticles
Up to 10-1 0.5 × 10⁻³ [50]
Image analysis Based on the color change of
TGA-capped CdTe QDs. 1.0 × 10
-1
REFERENCES
[1] T.E. Edmonds (Ed.), Chemical Sensors, Chapman and Hall, New York, 1988.
[2] D.M.G. Preethichandra, E.M.I. Mala Ekanayake, Nano-Biosensor Development for Biomedical and Environmental Measurements, S.C. Mukhopadhyay, A. L.Ekuakille, A. Fuchs (Eds.): New Developments and Applications in Sensing Technology 83 (2011) 279-292.
[3] A. Sadanandom, R.M. Napier, Curr. Opin. Plant. Biol. 13 (2010) 736.
[4] I.L. Justino, A. Teresa, R. Santos, C.A. Duarte, Trends. Anal. Chem. 29 (2010) 1172.
[5] L. Su, W. Jia, C. Hou, Y. Lei, Biosens. Bioelectron. 26 (2011) 1788.
[6] D. Ahuja, D. Parande, J. Sci. Res. Rev. 1 (2012) 60. [7] X. Wu, H. Liu, J. Liu, K.N. Haley, J.A. Treadway,
J.P. Larson, N. Ge, F. Peale, M.P. Bruchez, Nat. Biotechnol. 21 (2003) 41.
[8] K. Grieve, P. Mulvaney, F. Grieser, Curr. Opin. Colloid Interf. Sci. 5 (2000) 168.
[9] P. Alivisatos, Nat. Biotechnol. 22 (2004) 47. [10] M. Nirmal, L. Brus, Acc. Chem. Res.32 (1999) 407. [11] R. Gill, M. Zayats, I. Willner, Angew. Chem. Int.
Ed.47 (2008) 7602.
[12] M.A. Jhonsi, R. Renganathan, J. Colloid Interf. Sci. 344 (2010) 596.
[13] J. Duan, L. Song, J. Zhan, Nano Res. 2 (2009) 61. [14] J. Tashkhourian, M.R. Hormozi Nezhad, J.
Khodaveisi, R. Dashti, Sen. Actuat. B 158 (2011) 185.
[15] L. Qingwen, L. Guoan, W. Yiming, Z. Xingrong, Mater. Sci. Eng. C 11 (2000) 67.
[16] E.A. Moschou, B.V. Sharma, S.K. Deo, S. Daunert, J. Fluoresc. 14 (2004) 535.
[17] M. Ben-Moshe, V.L. Alexeev, S.A. Asher, Anal. Chem. 78 (2006) 5149.
[18] T. Zhang, E.V. Anslyn, Org. Lett. 9 (2007) 1627. [19] M.C. Lee, S. Kabilan, A. Hussain, X. Yang, J. Blyth,
C.R. Lowe, Anal. Chem. 76 (2004) 5748.
[20] X.D. Ge, L. Tolosa, G. Rao, Anal. Chem. 76 (2004) 1403.
[21] D.M. Porterfield, Biosens. Bioelectron. 22 (2007)
1186.
[22] F. Rolland, E. Baena-Gonzalez, J. Sheen, Annu. Rev. Plant Biol. 57 (2006) 675.
[23] K. Ai, B. Zhang, L. Lu, Angew. Chem. Int. Ed. 48 (2009) 304.
[24] A. Heller, B. Feldman, Chem. Rev. 108 (2008) 2482. [25] L.A. Terry, S.F. White, L.J. Tigwell, J. Agric. Food
Chem. 53 (2005) 1309.
[26] L.C. Clark, C. Lyons, Acad. Sci. 102 (1962) 29. [27] M. Hu, J. Tian, H.T. Lu, L.X. Weng, L.H. Wang,
Talanta 82 (2010) 997.
[28] S. Lee, V.H. Perez-Luna, Anal. Chem. 77 (2005) 7204.
[29] K. Aslan, J.R. Lakowicz, C.D. Geddes, Anal. Chem. 77 (2005) 2007.
[30] G. Blagoi, N. Rosenzweig, Z. Rosenzweig, Anal. Chem. 77 (2005) 393.
[31] P.W. Barone, R.S. Parker, M.S. Strano, Anal. Chem. 77 (2005) 7556.
[32] B.L. Ibey, H.T. Beier, R.M. Rounds, G.L. Cote, Anal. Chem. 77 (2005) 7039.
[33] W. Chen, H. Yao, C.H. Tzang, J. Zhu, M. Yang, S.-T. Lee, Appl. Phys. Lett. 88 (2006) 213104/1-213104/3.
[34] T. Chen, K.A. Friedman, I. Lei, A. Heller, Anal. Chem. 72 (2000) 3757.
[35] A. Abbaspour, M.A. Mehrgardi, M.A. Noori, A. Kamyabi, Khalafi-Nezhad, M.N. Soltani Rad, Sens. Actuat. B: Chem. 113 (2006) 857.
[36] Y. Zhang, Y. Li, X.P. Yan, Anal. Chem. 81 (2009) 5001.
[37] M.A. Jhonsi, R. Renganathan, J. Colloid Interf. Sci. 344 (2010) 596.
[38] J.N. Tian, R.J. Liu, Y.C. Zhao, Q. Xu, S.L. Zhao, J. Colloid Interf. Sci. 336 (2009) 504.
[39] T. Khosousi, PhD Thesis, Shiraz University, Shiraz, Iran, 2012.
[40] M. Hu, J. Tian, H.T. Lu, L.X. Weng, L.H. Wang, Talanta 82 (2010) 997.
[41] Y.C. Shiang, C.C. Huang, H.T. Chang, Chem. Commun. 14 (2009) 3437.
[42] L.H. Cao, J. Ye, L.L. Tong, B. Tang, Chem. Eur. J. 14 (2008) 9633.
A Simple Image Analysis Method for Determination of Glucose/Anal. Bioanal. Chem. Res.,Vol. 1, No. 2, 117-127, December 2014.
Kornowski, A. Eychmller, H. Weller, J. Phys. Chem. B 102 (1998) 8360.
[44] S. Chutipongtanate, V. Thongboonkerd, Anal. Biochem. 402 (2010) 110.
[45] M.V. Martinez-Ortega, M.C. Garcia-Parrilla, A.M. Troncoso, Anal. Chim. Acta 502 (2004) 49.
[46] F.M. Lopesi, K.D.A. Batistai, G.L.A. Batistai, K.F. Fernandes, Sci. Tech. Aliment. 32 (2012) 65.
[47] A.W. Martinez, S.T. Phillips, M.J. Butte, G.M. Whitesides, Angew. Chem. Int. Ed. 46 (2007) 1318. [48] Y. Ni, C. Huang, S. Kokot, Anal. Chim. Acta 480
(2003) 53.
[49] M. Ornatska, E. Sharpe, D. Andreescu, S. Andreescu, Anal. Chem. 83 (2011) 4273.