The Effect of Portfolio Diversification for the Bursa Malaysia
Nadia Nadira Mohd Norsiman1, Noor Azuddin Yakob1 & Carl B. McGowan, Jr.2 1
Universiti Kebangsaan Malaysia, Malaysia 2
Norfolk State University, USA
Correspondence: Carl B. McGowan, Jr., Norfolk State University, USA. E-mail: [email protected]
Received: August 1, 2019 Accepted: September 17, 2019 Online Published: September 20, 2019
doi:10.5430/afr.v8n4p76 URL: https://doi.org/10.5430/afr.v8n4p76
Abstract
This paper examines the effect of portfolio diversification for stocks listed on the Malaysian stock exchange. We determine the extent to which the unsystematic risk component can be reduced through diversification posited by Modern Portfolio Theory. Prices of randomly selected stocks were obtained from Yahoo! Finance for the five year period starting from January 2010 to March 2014. In order to analyze the robustness of the empirical results, three sets of portfolios were tested in this study and each set contained 55 stocks. The total sample of 165 stocks was chosen from different sectors that are listed under Bursa Malaysia. In addition, the three samples were tested for two type of differencing intervals, daily and weekly, to obtain more robust results. The empirical findings of the study show that increasing the number of stocks in the sample portfolio leads to decreasing standard deviation (unsystematic risk) the investment portfolio for Malaysia Stock Market stocks until each portfolio is well-diversified. The uniqueness in this study is that the empirical results show that, the level of data frequency significantly influences changes in stock portfolio size required to obtain optimal portfolio diversification. Using the daily differencing interval, 45 stocks are need to eliminate unsystematic risk and using the weekly differencing interval, only 35 stocks are required to obtain a well-diversified portfolio.
Keywords: diversification, standard deviation, number of stocks, data frequency 1. Introduction
Modern Portfolio Theory (MPT) as proposed by Markowitz (1952) offers a widely acceptable framework for understanding the relationship between return and risk. Generally, MPT decomposes total risk into systematic and unsystematic risk and studies analyze the relationship between portfolio risk and the number of stocks in a well-diversified portfolio, especially for mature markets like the New York Stock Exchange (NYSE). As the largest stock exchange, the NYSE is a benchmark for other markets. Empirical studies show that approximately 20 to 30 securities will be needed to construct a well-diversified portfolio for investment portfolios of stocks listed on the NYSE (Statman, 1987; Alexeev et al., 2013).
Risk, is viewed as ‘negative’ in traditional terms. Webster’s dictionary, for instance, defines risk as ‘exposing to danger or hazard’. The Chinese symbols for risk ‘危機’ give a much better description of risk. The first symbol is the symbol for “danger”, while the second one is the symbol for “opportunity”, which means taking risk will include both danger and opportunity. We cannot have one without the other. Risk is the possibility of losing the original investment or the chance that the actual return may be different from the expected return. High risk will reduce the likelihood of a positive return due to the increased probability of a negative return (Tabak et al., 2011).
Loss of a major customer because of the customer’s bankruptcy symbolizes one source of unsystematic or business-specific or stakeholder risk. Unsystematic risk derives from internal factors prevailing within an organization where these factors are normally under the organization’s control. Meanwhile, systematic risk is a risk factor that is normally uncontrollable due to the influence of external factors on an organization such as interest rates, market risk, and inflationary risk. Systematic risk is non-diversifiable and affects the returns of all firms.
volatile stock markets is simple – diversification! Proponents of MPT argue that the systematic component of risk is the only risk that matters to stockholders because stockholders cannot diversify it away, while stockholders can diversify away unsystematic risk (Lubatkin et al., 1994; Lee et al., 2006). Evans and Archer (1968) graphically show the relationship between total risk, systematic risk, and unsystematic risk. They show that average portfolio risk becomes asymptotic to total risk as portfolio size increases.
Studies have been done on naive diversification where investors hold a portfolio of randomly selected stocks with equal investment. Tang (2004) shows that naive diversification is a simple but powerful way to reduce overall portfolio risk. Naive investors recognize that they have no useful or accurate information about individual stocks or future risk and return. Theoretically, portfolio management is built on the concept of diversification and describes techniques that lead to efficient diversification or an optimal portfolio, under the assumption that investors or the fund managers have the knowledge to construct optimal portfolios. But, it is impossible to have such accurate information about the risks and returns of individual stocks, as gathering information itself is costly. Hence, a lack of accurate information about future returns and individual returns push investors towards naive diversification.
1.1 Background of the Study
Alternatively, a very limited number of studies have been conducted for developing countries like Malaysia. Thus, our study aims to analyze the effect of portfolio diversification in the Malaysia stock market.
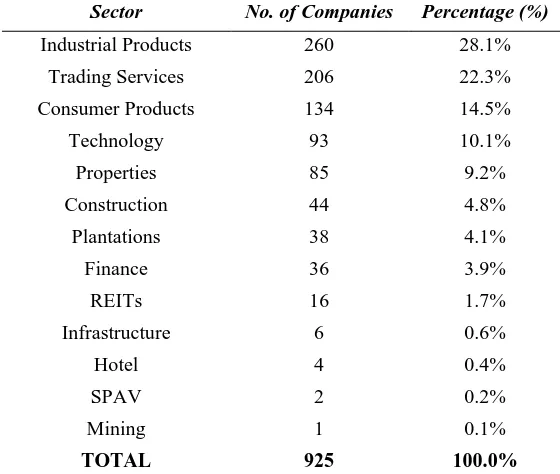
The Malaysia stock market was established in 1960 and the equity market has expanded over the past 59 years, which made the Malaysia market global. Malaysia stock market is governed by the exchange body known as Bursa Malaysia since the demutualization exercise in the year 2004. Bursa Malaysia, previously known as Kuala Lumpur Stock Exchange (KLSE), is an exchange holding company approved under Section 15 of the Capital Markets and Services Act 2007. It operates a fully integrated exchange, offering the complete range of exchange-related services including trading, clearing, settlement and depository services. It is one of the largest bourses in Asia, listing 925 companies
Bursa Malaysia offers a choice of two dynamic markets to companies seeking listing in Malaysia. The Main Market provides a market for established companies to raise funds. The ACE Market is an alternative sponsor-driven market designed for companies with growth potential from all business sectors. The total number of companies listed under Bursa Malaysia were 925 companies where 816 companies compose the main market and 109 companies compost the ACE Market with the details as shows in Table 1.
Total return from the investment portfolio is important to all investors. However, the number of securities in which to invest, the combination of securities to be held in the portfolio, and the risk involved in the portfolio are important considerations for all investors. This process is used to optimize losses of expected returns in the future due to unexpected volatility of the market stock.
We analyze the FTSE Bursa Malaysia KLCI Composite Index (FBM KLCI) for 5 years of performance from March 2009 to March 2014, during which time the index was very volatile but with steady increases in value. On 31 March 2014, the FBM KLCI rose 13.55 index points, seeing a positive performance of 0.74 per cent. As of the end of March 2014, FBM KLCI was ranked number nine of s0xteen selected FTSE Asia Pacific country indexes with a net market capitalization value of 516 (MYRbn). The Industrial Transportation sector had the best performance of up 8.66 per cent and the Automobiles & Parts sector showing the worst performance of down 6.95 per cent.
Table 1. Companies listed under Bursa Malaysia (www.bursamalaysia.com)
Sector No. of Companies Percentage (%)
Industrial Products 260 28.1%
Trading Services 206 22.3%
Consumer Products 134 14.5%
Technology 93 10.1%
Properties 85 9.2%
Construction 44 4.8%
Plantations 38 4.1%
Finance 36 3.9%
REITs 16 1.7%
Infrastructure 6 0.6%
Hotel 4 0.4%
SPAV 2 0.2%
Mining 1 0.1%
TOTAL 925 100.0%
As the movement of the FBM KLCI has been showing signs of continuous strength, staying above the 1,800 points level recently (1,849.21 on 31 March 2014), will 2014 be a good year for investment? Analysts and market observers have mixed opinions and each has their own opinion, however analysts and observers believe that FBM KLCI will move higher amid a challenging and volatile market.
1.2 Statement of the Problem
Through diversification, investors are able to decrease unsystematic risk in their portfolio. The problem is how to accomplish this. By increasing the number of stocks in the portfolio an investor can decrease total risk in the portfolio up to a maximum where total unsystematic risk is eliminated. Unsystematic risk can be diversified, but at what point is diversification sufficient to diversify away unsystematic risk. Substantial research indicates that adequate diversification can be achieved by holding of 20 to 30 stocks. However, most studies are done for mature markets rather than emerging markets. Therefore, in this research we will undertake to investigate how diversification might be implemented for the Malaysia Stock Market and how many stocks are needed for a well-diversified portfolio. Previous research uses daily stock prices but we examine if high frequency data can be used to test the effect of portfolio diversification on the Malaysia stock market.
1.3 Research Questions
Our research questions are as follows:
1) Is it true that unsystematic risk can be decreased through diversification?
2) How much diversification is enough to diversify away all unsystematic risk?
3) Is there any difference on the required portfolio size for diversification by using daily and weekly data? Which one is more relevant?
1.4 The Objectives of the Study
This study examines the effect of diversification in reducing portfolio risk by reducing unsystematic risk of the portfolio for Malaysia Stock Market. In order to do so, the main objectives are constructed as mentioned below: To investigate whether the portfolio risk can be reduced by increasing the number of stocks in the portfolio To determine the significant number of stock that needed to create a well-diversified portfolio risk using two different basis
1.5 Significance of Study
different from the expected returns. Taking the concept of not putting all your eggs in one basket, therefore, one way of reducing the risk of the portfolio is through diversification, through choosing the proportions of various assets as indicated by modern portfolio theory. For this paper, Malaysia Stock Market is used to derive the research sample. We use the Malaysia Stock Market to see if the empirical results are similar to empirical results from most of the research which has been done for developed countries and markets such as those in the US and Europe where researchers determined the appropriate stock range for constructing well diversified portfolios. Meanwhile, only a limited amount of research has been done for developing countries like Malaysia. We also examine a second question to determine if the empirical results are affected by using daily and weekly data to compare the different sizes of portfolio needed to achieve adequate diversification.
Nevertheless, the same question could be asked to determine how many stocks are enough to construct a well-diversified portfolio for stocks listed in Malaysia. In constructing portfolios, there are probably a hundred stocks or more than that can be compiled. Most research papers put the number in the 20-30 range for portfolio diversified the risk. Statman (1987) found that a well-diversified stock portfolio must include, at least 30 stocks for borrowing investors and 40 stocks for lending investors. Yexiao Xu (2003) shows that one needs to hold 20 stocks in a portfolio in order to diversify 90% of unsystematic risk and 95% of market volatility. Campbell, et.al (2000) show that by holding 20 or 30 stocks, a portfolio closely approximates a well-diversified portfolio in which all unsystematic risk is eliminated (Campbell et al., 2000).
We use 165 randomly selected companies, divided into three samples of 55 companies each, listed on the Bursa Malaysia. The aim of this research is to find the number of stocks needed to construct a well-diversified investment portfolio. Since investors can eliminate unsystematic risk by investing in a diversified portfolio, the only risk remaining in the portfolio is systematic risk and this is the risk for which investors must be compensated. The amounts of the compensation investors require depends on the amount of the systematic risk in the portfolio. One needs a measure for the systematic risk a portfolio contains. The measure of systematic risk is called beta and is denoted by the Greek letter 𝛽 and unsystematic risk is measured by standard deviation, 𝜎.
We examine two different data frequencies, daily and weekly, to identify which frequency interval is more relevant to Malaysia market stock. Even though many experts recommend maximum diversification, it seems that “buying the market portfolio” (Vitali et.al, 2013) which means hold many stocks in portfolio is adequate. For individual investors, constructing the market portfolio is difficult and lesser diversification provides an adequate and less costly alternative. For actively managed funds, a large number of assets can result in higher management fees. If portfolio diversification can be achieved with a relatively small number of stocks, the need for funds holding a large number of assets can be avoided.
1.6 Scope of Study
To narrow the scope of the research, the sampling of this research analyses companies listed on Bursa Malaysia. A sample of 165 stocks listed on the Main Market will be randomly selected for this study. The sample will be separated into three sets of 55 stocks. Data gathered from the chosen stocks (daily and weekly) will be used for risk calculation is discussed in the methodology section and the empirical results and conclusions will be discussed in subsequent sections.
2. Literature Review
It has been sixty-two years since Modern Portfolio Theory was introduced by Harry Markowitz, a Noble Prize winner deriving the current approach to portfolio creation and management. Markowitz (1952) developed the basic portfolio model known as the mean-variance framework and portfolio management theory and practice in Markowitz(1959). He showed that the variance of the rate of return was a meaningful measure of portfolio risk under a reasonable set of assumptions. The real issue was this theory indicated importance of diversifying investment to reduce the total risk of portfolio and how to diversify effectively.
Diversification can reduce portfolio risk without negatively impacting expected portfolio return. Unsystematic or diversifiable risk is the portion of risk in a portfolio that can be diversified away by holding a pool of individual assets. Alekneviciene et al., (2012) find that the increasing diversification of portfolio gradually eliminated non-systematic risk, leaving only the systematic or market-driven risk. However, too much diversification helped to reduce the risk but it would increase operating costs and decrease on return. If this situation happens, it is considered as inefficient portfolio. Modern portfolio theory has demonstrated the importance of diversification to investors because an investor can reduce portfolio risk without reducing portfolio return. Nevertheless, a famous question that is always being asked, how many stocks make a diversified portfolio?
Statman (1987) found that a well-diversified stock portfolio must include at least 30 stocks for a borrowing investor and 40 stocks for a lending investor. This result was different from what generally had been taught where the benefits of diversification can be gained with as few as 10 or 15 stocks. This analysis is similar to Elton and Gruber (1977), which showed that the benefit of risk reduction reduce significantly when more than 20 assets had been add in to the portfolio. Campbell (2000) found that the risk of the market model for stocks declined when the number of stocks for portfolio diversification has increased.
Conversely, Lee et al., (2000) showed that that 20 stocks are able to achieved 92% of diversification for US stocks. Meanwhile, similar empirical results were found for the Chinese Stock Market where researcher have shown that investor needs to hold 20 stocks in a portfolio in order to diversify away 90% of total unsystematic risk volatility or equivalent to 95% of the market volatility(Xu, 2003). This conclusion is very significant since such a level of holdings is much higher than the actual average level of holdings in China.
Portfolio size is negatively correlated with the unsystematic risk. Lee et al., (2006) show that large portfolios (80.42%) has a less volatility compared to medium portfolios (97.30%) and small portfolios (103.84%). Similarly, in the downside risk framework, the semi deviation of the large size portfolio was 29.39%, which was lower than medium (29.82%) and small (34.77%) size portfolios. Large size portfolios of stocks have lower risk compared to smaller size portfolios.
Alekneviciene et al., (2012) show that, in order to eliminate 98 % of diversifiable risk, naive portfolios of 22 stocks should be formed. These research results confirmed the Tang (2004) findings. Alexeev & Tapon (2013) recommend that professional portfolio managers who use standard deviation as a measure of risk and who seek to reduce 90% of diversifiable risk 90% percent of the time, instead of on average, should hold 49 stocks in the US; 43 in the UK; 39 in Japan; 40 in Canada; and 38 in Australia. Meanwhile other research found investor should hold 31 stocks during market volatile and 26 stocks when stock market is relatively stable to be well diversified (Hu et al., 2013).
Little (2013) posits that to be truly diversified in stock selection, it is advisable to have different industries (even different countries) and different sized companies. Portfolio diversification is increased with dissimilar companies from a variety of industries and the most important the stocks are not all affected by the same economic factors. Unrelated-diversified firms should show the lowest levels of such risk because they combine businesses whose cash flows are different and weakly correlated(Lubatkin and Chatterjee, 1994). More efficient cash management and allocations of investment capital, and growth in profits through cross-subsidization can lead to larger income than would be available from simple portfolio diversification.
For developed markets, 20 to 30 securities will provide adequate diversified portfolio. Most studies are conducted in developed countries like US (New York Stock Exchange, NYSE). Few studies have been constructed for developing countiesy like Malaysia. The empirical results could be different for developing markets because market volatility is different. The Asian financial crisis has had a significant impact on the stock price volatility over recent decades, Chan et.al (2013). Hoh et.al, (2011) showed that using data for the period 1998-2010 in the Malaysian stock market, a portfolio with 100 stocks can only achieve the diversification level of 70.22%. They indicate that this is in contrast with the study done by Ronald and Mitchell (2000) who showed that a portfolio with 30 stocks can achieve 86% of diversification level. However, the use of R2 of as a measurement in this research may impact the results.
for each differencing interval. Alexeev & Dungey (2013) they find that using lower frequency data investors can achieve a level of diversification 90% of the time compared with the results based on the high frequency data. However different finding from research done by Mengwei Lei (2012), taking a sample from the S&P 500 (SPY), Bank of America (BAC), Goldman Sachs (GS), JPMorgan (JPM), Coca-Cola (HPQ), Wal-Mart (WMT), and Verizon (VZ), researchers found that high-frequency data generates very reliable measures of volatility and correlations which could be used to produce more accurate results. Study shows there is a statistically significant positive relationship between assets returns, correlations and market volatility. Due to differences in research findings from previous studies, it is logical to examine the portfolio diversification effect of different differencing intervals for the stock market in Malaysia.
3. Data and Methodology
The hypothesis for this research was that the theory of risk reduction through portfolio diversification is applicable to the Bursa Malaysia. The aim was to identify the number of stocks needed to construct a well-diversified portfolio risk.
3.1 Data
A sample of 165 stocks were chosen from different economic sectors that are listed on the Bursa Malaysia. Three sets of portfolios were tested comprised of 55 stocks each. Based on previous studies done in Malaysia, 20 to 30 stocks are enough to achieve optimal diversification (Ng et.al., 2011; Gupta et.al., 2001). However, Hoh et.al. (2011) found that portfolios of 30 stocks with the highest reported earnings leads to a 63% diversification or risk. Using the findings as a benchmark, this study tested 55 stocks for each set of portfolio.
For the first sample of 55 stocks, from the top 100 stocks based on market capitalization ranking under Thomson Reuters, 55 stocks that have the highest price-earnings ratio for the year ended January 1, 2014 were selected. The reason for this sample is because most of the active portfolio managers tend to choose stocks based on two factors, valuation factors and growth factors. The price-earnings ratio is used to determine valuation factors(Richard, 2009). Meanwhile, the other 110 stocks were chosen randomly from companies listed on the Bursa Malaysia. We intended to identify the significant number of stocks for efficient portfolio diversification in Malaysia using daily differencing. Then we tested returns for the same stocks using a weekly differencing interval. All the data were from Yahoo! Finance for the period 1 January 2010 until 31 March 2014. Additionally, assuming a fixed level of diversification, the author fixed the portfolio sizes at 5, 15, 20, 25, 30, 35, 40, 45, 50 and 55 stocks and traced the dynamics of the diversification level through different portfolio sizes.
3.2 Methodology
One of the best-known measures of risk is the standard deviation of expected returns. It is a statistical measure of the dispersion of returns around the expected value whereby a larger variance or standard deviation indicates greater dispersion. The idea is that the more disperse the expected return, the greater the uncertainty of future returns. Although, there are numerous potential measures of risk, standard deviation of return will be used because (1) this measure is somewhat intuitive, (2) it is correct and is recognized as a risk measure, and (3) it has been used in most of the theoretical asset pricing models.
Traditionally, to calculate the expected rates of return (simple mean) from historical data uses the formula:
𝐸(𝑅) =∑ 𝑅𝑖
𝑛 𝑖=1
𝑛
In this case, ‘n’ represents the total number of stocks based on specific time horizon. Meanwhile, 𝑅𝑖 is total of return for those stocks.
Variance and standard deviation when analyzing historical data are calculated using these formulas:
𝜎2= ∑(𝑅𝑖 − 𝐸(𝑅)𝑖)2
𝑛 − 1
𝑛
𝑖=1
where:
𝑅𝑖= Return of stock
𝐸(𝑅)𝑖= Mean of stock
𝑛= number of stock
Portfolio risk is determined by the covariance and correlation of the stocks within the portfolio. Each of the stocks has a certain return for a particular period and a tendency to vary during the year. Besides this type of risk is not simply the average of individual security risks, standard deviations. To calculate portfolio risk, the analyst must account for the interrelationships among returns, that is, the covariances.
Covariance was a measure of the degree to which returns on two risky assets move in tandem. A positive covariance means that asset returns move together. A negative covariance means returns move inversely. Possessing financial assets that provide returns and have a high covariance with each other will not provide very much diversification
Correlation was a measure that determines degree to which two variable’s movements is associated. The correlation coefficient will vary from -1 to +1. A correlation of -1 indicates perfect negative correlation, and a correlation of +1 indicates perfect positive correlation. The correlation coefficient is calculated as:
Meanwhile, Markowitz was derived the general formula for the standard deviation of a portfolio as follows:
𝜎𝑝𝑜𝑟𝑡= √∑ 𝑊𝑖2𝜎𝑖2 𝑛
𝑖=1
+ ∑ ∑ 𝑊𝑖𝑊𝑗𝐶𝑂𝑉𝑖𝑗 𝑛
𝑗=1 𝑛
𝑖=1
Where:
𝜎𝑝𝑜𝑟𝑡= the standard deviation of portfolio
𝑊𝑖= the weights of individual assets in the portfolio, where weight are determined by the proposition of value in the
portfolio
𝜎𝑖2= the variance of rates of return for asset i
𝐶𝑂𝑉𝑖𝑗= the covariance between the rates of return for assets i and j, where 𝐶𝑂𝑉𝑖𝑗= 𝜌𝑖𝑗𝜎𝑖𝜎𝑗
This formula indicates that the standard deviation is a function of the variances for the individual assets that make up the portfolio and the covariances between all of the assets in the portfolio. The larger the portfolio the more impact the covariance has on portfolio risk and the lower the impact of individual security variance.
From the explanations of the formula used to calculate portfolio risk, it appears that a large number of calculations have to be done that will take time to calculate the statistics for the entire portfolio of stocks. However, Robert A. Haugen, Professor Emeritus of Finance from University of California at Irvine was found a simple way to calculate portfolio risk and which is being explained on his book “Modern Investment Theory Fifth Edition”. The steps can be simplified as below:
1) Find the rate of return for historical data each stocks:
𝑅̅𝑖= 𝐸𝑛𝑑𝑖𝑛𝑔 𝑉𝑎𝑙𝑢𝑒−𝐵𝑒𝑔𝑖𝑛𝑛𝑖𝑛𝑔 𝑉𝑎𝑙𝑢𝑒𝐵𝑒𝑔𝑖𝑛𝑛𝑖𝑛𝑔 𝑉𝑎𝑙𝑢𝑒 × 100
The rate of turn was calculated using the closing stock prices from 1 January 2010 until 31 March 2014 that were collected from Yahoo! Finance for both daily and weekly basis.
2) Calculate the portfolio expected return for each day/week by using this formula:
E(R)n=1,ij = ∑ (Wn+𝑅̅𝑖) + (Wn+𝑅̅𝑗) + …………. For example:
Find expected return for the first five stocks.
Weighted = 1/5 = 0.20
E(R)1st date = [(0.0x0.20)+(0.0x0.20)+(-0.003x0.20)+(0.0204x0.20)+(0.0336x0.20)
= 0.0102
Repeat the calculation for the rest of the sample dates using same method. COVij = ∑(Ri – E(R)i)( Rj – E(R)j)
N - 1
3) Use the traditional method to calculate the mean and the standard deviation.
𝐴𝑣𝑒𝑟𝑎𝑔𝑒 𝑀𝑒𝑎𝑛 =∑ 𝐸(𝑅)𝑖𝑗
𝑛 𝑖=1
𝑛
𝜎2= ∑(𝑅𝑖 − 𝐸(𝑅)𝑖)2
𝑛 − 1
𝑛
𝑖=1
𝜎 = √𝜎2
4. Empirical Results and Discussion
The main objective of this paper was to determine if increasing the portfolio size can help investors reduce unsystematic risk in their portfolio and create a diversified portfolio. The null and alternative hypotheses for this study were:
H0 = Unsystematic risk cannot be reduced by increasing the number of stocks in the portfolio.
H1 = Unsystematic risk can be reduced by increasing the number of stocks in the portfolio.
Previous empirical results indicate that approximately 20 to 30 securities will provide a diversified portfolio which support findings by Hu et.al (2013) where the authors find that the optimal number of holdings of stock in a portfolio is around 26–28 stocks. To measure diversification effects in the Malaysia Stock Market, three sets of stocks are presented in Table 2 as below, which are compiled in accordance with daily date starting from 1 January 2010 to 31 March 2014.
Statman (1987) found that using daily returns as the basis for calculating the standard deviation applied to measure unsystematic risk in his sample remained stable after 30 stocks, which provides evidence that at that level, the average portfolio reached adequate diversification. Alekneviciene et.al, (2012) found that in order to eliminate 98% of diversifiable risk, a naive portfolio with 22 stocks should be formed. Similar with other researches (Tang 2004; Ahuja 2011) using daily returns as the basis for calculating the standard deviation, their empirical results support the range of 20-30 stocks are enough to achieve well a diversified in portfolio.
However, researchers found that their findings using daily basis are not applicable in the case of Malaysia where the result in Table 2 shows that the standard deviation is only stable when portfolio size reached 45 stocks. This empirical result is supported by a research project conducted by Hoh et al. (2011), a portfolio of 30 stocks for Malaysia stock market brings only about 63% of diversification benefits which is less effective compared with developed market like United States. The reason of differences for level of effect in diversification is probably because of various factors such as the size and the efficiency of a market where a developed country like United States is more efficient by comparison with emerging country like Malaysia.
Table 2. Random Diversification Using Daily Basis
NO.OF STOCKS MEAN STDEV
DATA SET 1
5 0.0027 0.056
10 0.0018 0.029
15 0.0015 0.019
20 0.0014 0.015
25 0.0012 0.012
30 0.0012 0.01
35 0.0012 0.009
40 0.0011 0.008
45 0.0011 0.007
50 0.001 0.007
55 0.001 0.007
DATA SET 2
5 0.0015 0.023
10 0.001 0.015
15 0.0009 0.014
20 0.0009 0.013
25 0.0009 0.011
30 0.0008 0.011
35 0.0008 0.011
40 0.0008 0.01
45 0.0007 0.009
50 0.0008 0.009
55 0.0008 0.009
DATA SET 3
5 0.0028 0.057
10 0.0022 0.033
15 0.0019 0.022
20 0.0014 0.017
25 0.0014 0.014
30 0.0012 0.012
35 0.0012 0.011
40 0.0012 0.01
45 0.0012 0.009
50 0.0011 0.009
Figure 1. Stocks Selected Based on P/E rank
Figure 2. Randomly Selected
0.000 0.010 0.020 0.030 0.040 0.050 0.060
5 10 15 20 25 30 35 40 45 50 55
SET 1
STDEV
0.000 0.005 0.010 0.015 0.020 0.025
5 10 15 20 25 30 35 40 45 50 55
SET 2
STDEV Number of
Stock
Figure 3. Randomly Selected
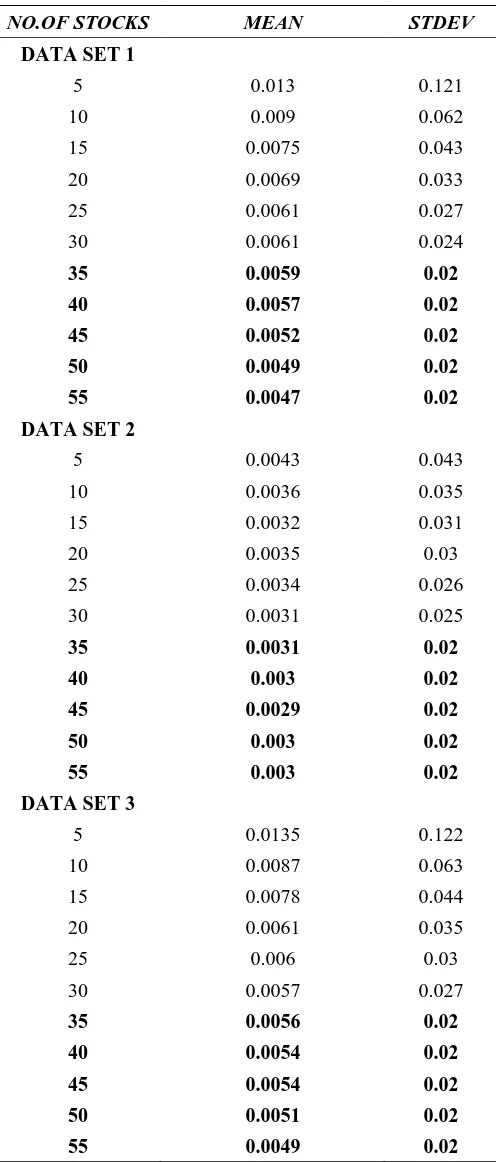
While many researchers have focused on finding the significant number of stock for eliminating unsystematic risk, some of them ignored the reality that it is risky to hold too many of stocks in portfolio. Even some studies find that investors should hold as many as 50 stocks to achieve adequate diversification and recommend holding a larger portfolio of stocks (Alexeev et.al, 2013), but in reality it is hard to achieve this much diversification since a large portfolio will incur higher costs especially for actively managed funds. When an investor owns too many stocks, it becomes nearly impossible to know each stock really well and the analyst may miss important information changes. This study provides empirical evidence on the importance of identifying how many stocks to hold by assessing the portfolio risk at different data frequencies. Based on research done by Alexeev&Dungey (2013), it is recommended that investors use low frequency data to decrease the number of stocks held for diversification and our empirical results support this conclusion as shown in Table 3 and Graphs 4 to 6 below:
0.000 0.010 0.020 0.030 0.040 0.050 0.060
5 10 15 20 25 30 35 40 45 50 55
SET 3
STDEV
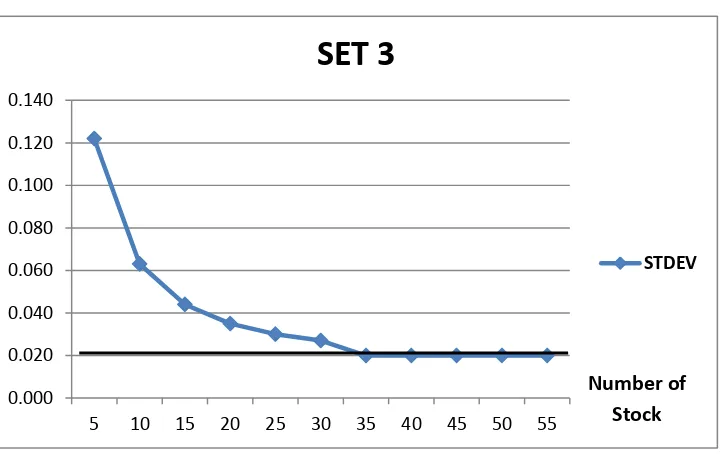
Table 3. Random Diversification Using Weekly Basis
NO.OF STOCKS MEAN STDEV
DATA SET 1
5 0.013 0.121
10 0.009 0.062
15 0.0075 0.043
20 0.0069 0.033
25 0.0061 0.027
30 0.0061 0.024
35 0.0059 0.02
40 0.0057 0.02
45 0.0052 0.02
50 0.0049 0.02
55 0.0047 0.02
DATA SET 2
5 0.0043 0.043
10 0.0036 0.035
15 0.0032 0.031
20 0.0035 0.03
25 0.0034 0.026
30 0.0031 0.025
35 0.0031 0.02
40 0.003 0.02
45 0.0029 0.02
50 0.003 0.02
55 0.003 0.02
DATA SET 3
5 0.0135 0.122
10 0.0087 0.063
15 0.0078 0.044
20 0.0061 0.035
25 0.006 0.03
30 0.0057 0.027
35 0.0056 0.02
40 0.0054 0.02
45 0.0054 0.02
50 0.0051 0.02
Figure 4. Stocks Selected Based on P/E rank
Figure 5. Randomly Selected 0.000
0.020 0.040 0.060 0.080 0.100 0.120 0.140
5 10 15 20 25 30 35 40 45 50 55
SET 1
STDEV
0.000 0.005 0.010 0.015 0.020 0.025 0.030 0.035 0.040 0.045 0.050
5 10 15 20 25 30 35 40 45 50 55
SET 2
STDEV Number of
Stock
Figure 6. Randomly Selected
From the table and charts above we see that the number of stocks needed to reduce the standard deviation was lower using weekly data (35 stocks) than using daily basis (45 stocks). Furthermore, using monthly-end data and random selection method, Gupta & Khoon (2001) found that a well-diversified portfolio for the Malaysian stocks market may be reached with only 30 stocks. Elton & Gruber (1977) used annual standard deviation for equally weighted portfolios of randomly selected NYSE securities and found that 30 stocks were enough to construct a diversified portfolio without unsystematic risk. As of all supported findings we can confidently said that by using low frequency data differencing is relevant and should be implemented for portfolio diversification analysis for the Malaysia Stock Market as low frequency data provides portfolio optimization with a lower number of stocks.
4.2 Discussion of Findings
The empirical results reported in this study share similarities and differences with earlier studies. First, let us compare these empirical results with some of traditional recommendations, firstly, Frank Reilly and Keith Brown in their book Investment Analysis and Portfolio Management reported that in one set of studies for randomly selected stocks, if we own about 12 to 18 stocks, by assuming the investor owns an equally weighted portfolio we can reach 90% of the benefits of diversification. Meanwhile Tang et.al, (20014) in their study of ten investment textbooks found that the smallest number was eight stocks whereas the largest was around 40 stocks and the majority suggested 10 to 20 stocks were needed to construct portfolios to eliminate unsystematic risk. Ahuja (2011) applied portfolio diversification theory in the Karachi Stock Exchange and concluded that a portfolio of ten stocks can diversify away a significant amount of risk.
However, the empirical results of this study show that to diminish unsystematic risk by using daily basis, 45 stocks are needed in a portfolio to get maximum diversification. This difference in the number of stocks required in a portfolio to eliminate unsystematic risk might results because of various factors like stock market size and efficiency. In fact, “sector” effects should be given more consideration when investing in an emerging market portfolio. Yet, it has been shown in Mohamad et.al (2006) who analyzed the opportunity for diversification across different economic sectors on portfolio investment in Malaysia. They found that the returns of different industry sectors generally tend to be highly correlated with each other. The findings show a high correlation coefficient for the six industry indices with the degree of correlation ranging from 44% to 92% such as the combination plantation-property 92.01% and property-trading 82%. This implies limited benefits of diversification across industries in Malaysia stock market. However, this correlation relationship is not stable over time.
The most famous research for portfolio diversification topic was Statmen (1987) with the title “How Many Stocks Make a Diversified Portfolio?” Statman found that a well-diversified portfolio for stocks randomly chosen must include at least 30 stocks for a borrowing investor and 40 stocks for a lending investor. This research finding is similar to this study when using weekly basis these empirical results indicate that the portfolio standard deviation on this sample remained stable after 30 stocks, which means all unsystematic risk is eliminated. Similar to empirical
0.000 0.020 0.040 0.060 0.080 0.100 0.120 0.140
5 10 15 20 25 30 35 40 45 50 55
SET 3
STDEV
results shown in Lee & Byrne 2000 which suggest 20-40 stocks enough to diminish unsystematic risk in a portfolio (Tang et.al, 2003; Alexeev&Tapon, 2013; Alekneviciene et.al, 2012 and Xu 2003).
Although studies such as Andersend and Bollerslev, 1997; Dacorogna, 2001 and Silvapulle and Granger, 2001 in Alexeev and Dungey, 2013; and Kris Boudt et.al, 2012, using high frequency data to investigate the implications of portfolio diversification because they believe high frequency data offers considerable gains for decision making and allows investors to reduce the number of stocks which they must hold in a portfolio to achieve the required risk reduction. However, Alexeev and Dungey (2013) find no references to works directly exploring the benefits of using high frequency data for portfolio diversification. In fact, their empirical results show that a 90% level of diversification can be achieved based on lower frequency data compared with these based on the 5 minutes data. Surprisingly, this study got the same empirical result testing the same stock sample set used in daily basis converted to weekly basis data. The number of stocks in a portfolio required for a well, diversified portfolio in Malaysia stock market decreased from 45 to 35 stocks. Other evidence from research done for Malaysia stock market using monthly basis data from year 2000 until 2007, Keat and Kim (2011) showed that a portfolio size of 11 stocks is generally sufficient to generate reasonable risk reduction. Besides, with the same differencing interval and with the same stock exchange during the period September 1988 until June 1997, Gupta and Khoon (2001) show that an investor needs to hold 30 stocks to construct a well-diversified portfolio.
The empirical results of this study show that portfolio diversification data frequency plays an important role in determining the optimal number of stocks required in a portfolio. The empirical results of this study support the theory of portfolio diversification that increasing the number of stocks held in a portfolio an investor is able to decrease the standard deviation of the portfolio until the portfolio standard deviation becomes stable that indicates all the unsystematic risk is being eliminated from the portfolio. Therefore, the empirical results indicate that the researcher should reject the null hypotheses.
H0 ≠ Unsystematic risk cannot be reduced by increasing the size of stocks in portfolio
H1 = Unsystematic risk can be reduced by increasing the size of stocks in portfolio
5. Conclusions and Recommendations 5.1 Summary of Findings
Modern portfolio theory has its origins in Markowitz (1952) in his paper entitled “Portfolio Selection.” Since then, many studies have been conducted to examine the relationship between portfolio risk and the number of stock needed to optimize the benefits of portfolio diversification. Previous research was done for developing countries like USA (New York Stock Exchange) but limited research has been done in emerging countries like Malaysia. Based on that reason, this study was done in Malaysia market stock.
According to the empirical findings, it can be concluded that Portfolio Diversification Theory is applicable for the Malaysia Stock Market by showing increasing the number of stocks held in a portfolio leads to decreasing standard deviation (unsystematic risk). The uniqueness of this study is that the empirical results show that the level of data frequency influences changes in the number of stocks in a portfolio are required to get optimal diversification. This can be shown in that where using daily differencing interval , 45 stocks are needed to eliminate unsystematic risk but using weekly differencing interval only 35 stocks are required to construct a well-diversified portfolio.
5.2 Limitations of this Research
This study only uses companies listed on Bursa Malaysia’s main market for the specific time horizon from 1 January 2010 until 31 March 2014. The mean and standard deviation were calculated based on daily and weekly price changes of stocks and the same data was used to examine the influences of data frequency on the number of stocks needed to be included in a portfolio to optimize the effects of diversification.
Furthermore, other factors like economy crisis, interest rates and transaction costs are not included in this study. Research was focused on finding the significant number of stock to eliminate unsystematic risk and that is why method like regression, correlation and covariance of stock was not calculated. Moreover, this portfolio was consisting only naive portfolio which it is assumed that all the stocks are equally weighted.
5.3 Recommendations
To improve the quality and reliability of the research, it is recommended that future researchers examine more data frequency intervals such as monthly and yearly basis since it is applicable to Malaysia stock market as the findings show that a decreasing on number of stocks are needed to eliminate risk with longer differencing intervals.
Even though experts agree to assume all stocks are equally weighted in the portfolio (naive portfolio), weighting might be different to maintain. A suggestion for future research is trying to compare the diversification effect between naive portfolio and differently-weighted portfolio.
In selecting sample stocks, although stocks are randomly chosen, diversification should be made across the different industries in the stock market. According to the discussion before, it is important to choose stocks that have very low correlation in order to get better empirical results. For other researchers who want to extend this study, it is suggested they run other methods like regression to determine factors such as correlation coefficient among stocks.
References
Ahuja, A. (2011). Portfolio Diversification in the Karachi Stock Exchange. PJETS, 1(1), 37-44. https://doi.org/10.22555/pjets.v1i1.139
Alekneviciene, V., Alekneviciute, E. & Rinkeviciene, R. (2012). Portfolio Size and Diversification Effect in Lithuanian Stock Exchange Market. Journal of Engineering Economics, 12(4), Pg 338-347. https://doi.org/10.5755/j01.ee.23.4.2565
Alexeev, V. & Dungey, M. (2013). Equity Portfolio Diversification with High Frequecy Data. Discussion Paper Series, 2013(19), 1-29.
Alexeev, V. & Tapon, F. (2013). Equity Portfolio Diversification: How Many Stocks are Enough? Evidence from Five Developed Markets. Australia: Tasmanian School of Business & Economics. https://doi.org/10.2139/ssrn.2182295
Andersen, T. G., T. B., F. X. & H. E. (2001). The Distribution of Realized Stock Return Volatility. Journal of Financial Economics, 61, 43-76. https://doi.org/10.1016/S0304-405X(01)00055-1
Brana, S. & Prat, S. (2010). The Introduction of Emerging Currencies into Portfolio: Towards More Complete Diversification Model. International Economics, 5-24. https://doi.org/10.1016/S2110-7017(13)60006-2
Campbell, J. Y., Lettau, M., Malkiel, B. G. & Xu, Y. (2000). Have Individual Stocks Become More Volatile? An Emprical Exploration of Idiosyncratic Risk. Journal of Finance, 1-41. https://doi.org/10.3386/w7590
Coeurdacier, N. & Guibaud, S. (2011). International Portfolio Diversification is Better Than You Think. Journal of International Money and Finance, 289-308.https://doi.org/10.1016/j.jimonfin.2010.10.003
Elton, E. J. (1977). Risk Reducation and Portfolio Size: An Analytic Solution. Journal of, 50, 415-437. (Evans and Archer 1968). https://doi.org/10.1086/295964
Goodale, J., Koerner, M. & J.Roney. (1997). Analyzing the Impact of Service Provider Empowerment on Perceptions of Service Quality Inside an Organization. Journal of Quality Management, 2(2), 191-215. https://doi.org/10.1016/S1084-8568(97)90003-1
Gupta, G. & Khoon, C. H. (2001). How Many Securities Make a Diversified Portfolio in KLSE Stocks. Asian Academy of Management Journal, 63-79.
HOH, A. K., WEI, H. C., CHUN, L. Y., HOU, N. K. & SHUN, T. X. (April 2011). Portfolio Diversification in Malaysia Stock Market. Department of Economics, 1-77.
Hu, J. L., Chang, T. P. & Chou, R. Y. (2013). Market conditions and the effect of diversification on mutual fund performance: should funds be more concentrative under crisis? Journal of Productivity Analysis. https://doi.org/10.1007/s11123-012-0331-x
K.-Y. N. & K.-L. G. (2011). Effects of Size and Allocation Method on Stock Portfolio Performance: A Simulation Study. 3rd International Conference on Information and Financial Engineering (pp. 538-542). Singapore: IACSIT Press.
Lee, C. L., Robinson, J. & Reed, R. (2006). An Exploration of the Relationship between Size and Risk in a Downside Risk Framework Applied to Malaysian Property Shares. 12th Pacific Rim Real Estate Society Conference, 1-15.
Little, K. (2013). Understanding Stock Diversification. Retrieved from About.com Stocks: http://stocks.about.com/od/understandingstocks/a/0606Diversifty.htm
Lubatkin, M. & Chatterjee, S. (1994). Extending Modern Portfolio Theory Into the Domain of Corporate Diversification: Does it Apply? The Academy of Management Journal, 37(1), 109-136. https://doi.org/10.2307/256772
Mohamad, S., Hassan, T. & Sori, Z. M. (2006). Diversification Across Economic Sectors and Implication on Portfolio Investment in Malaysia. Unpublished Journal from Faculty of Economics and Management, University Putra Malaysia, 155-172.
Ng, K. Y. & Goh, K. L. (2011). Effects of Size and Allocation Method on Stock Portfolio Performance: a Simulation Study. 2011 3rd International Conference on Information and Financial Engineering, 538-542. Singapore: IPEDR vol.12 (2011) © (2011) IACSIT Press.
Rezayat, F. & Yavas, B. F. (2006). International portfolio diversification: A study of linkages among the U.S., European and Japanese equity markets. Journal of Multinational Financial Management, 440-458. https://doi.org/10.1016/j.mulfin.2005.10.002
Richard, Y. (2009). Active management headwinds reserve course. Canary Wharf, London E14 5HS: Russell Research: Russell investment, Financial Services Authority, 25 The North Colonnade.
Statman, M. (1987). How Many Stock Make a Diversified Portfolio? Journal of Financial and Quantitative Analysis, 2, 353-363. https://doi.org/10.2307/2330969
Tabak, B. M., Fazio, D. M. & Cajuerio, D. O. (2011). The Effects of Loan Portfolio Concentration on Brazilian Banks’ Return and Risk. Journal of Banking & Finance, 3065-3076. https://doi.org/10.1016/j.jbankfin.2011.04.006
Tang, G. Y. (2004). How Efficient is Naive Portfolio Diversification? An Educational Note. The International Journal of Management Science, 155-160. https://doi.org/10.1016/j.omega.2003.10.002