R E S E A R C H
Open Access
Tn5
transposition in
Escherichia coli
is repressed
by Hfq and activated by over-expression of the
small non-coding RNA SgrS
Joseph A Ross, Ryan S Trussler, Morgan D Black, Crystal R McLellan and David B Haniford
*Abstract
Background:Hfq functions in post-transcriptional gene regulation in a wide range of bacteria, usually by promoting base pairing of mRNAs withtrans-encoded sRNAs. It was previously shown that Hfq down-regulatesTn10transposition by inhibitingIS10transposase expression at the post-transcriptional level. This provided the first example of Hfq playing a role in DNA transposition and led us to ask if a related transposon,Tn5, is similarly regulated.
Results:We show that Hfq strongly suppressesTn5transposition inEscherichia coliby inhibitingIS50transposase expression. However, in contrast to the situation forTn10, Hfq primarily inhibitsIS50transposase transcription. As Hfq does not typically function directly in transcription, we searched for a transcription factor that also down-regulatedIS50 transposase transcription and is itself under Hfq control. We show that Crp (cyclic AMP receptor protein) fits these criteria as: (1) disruption of thecrpgene led to an increase inIS50transposase expression and the magnitude of this increase was comparable to that observed for anhfqdisruption; and (2) Crp expression decreased inhfq−. We also demonstrate thatIS50transposase expression andTn5transposition are induced by over-expression of the sRNA SgrS and link this response to glucose limitation.
Conclusions:Tn5transposition is negatively regulated by Hfq primarily through inhibition ofIS50transposase transcription. Preliminary results support the possibility that this regulation is mediated through Crp. We also provide evidence that glucose limitation activatesIS50transposase transcription and transposition.
Keywords:Tn5/IS50, Hfq, Crp, SgrS, DNA transposition
Background
Transposase proteins catalyze the chemical steps in bac-terial transposition reactions. It follows that the regula-tion of expression of these genes is a critical feature in dictating the transposition frequency of most transpo-sons. In many instances, including Tn10/IS10and Tn5/ IS50, transposase gene promoters are inherently weak. In addition, DNA adenine methylase (DAM) limits initi-ation ofIS10andIS50transposase gene transcription by methylating promoter elements [1,2]. These factors to-gether make transcription initiation a limiting step in Tn10/IS10 and Tn5/IS50 transposition reactions [3,4]. There are also examples where translation of transposase transcripts is subject to both intrinsic and host levels of
regulation. In the case ofIS10transposase, the ribosome binding site is inherently weak and the transposon en-codes an antisense RNA that binds the translation initi-ation region (TIR), blocking ribosome binding [5,6]. There is also evidence that the ‘host’protein Hfq helps mediate the pairing interaction between the antisense RNA and theIS10transposase transcript [7,8].
Hfq is a global regulator of gene expression in bacteria. It typically functions at the post-transcriptional level, in-fluencing translation initiation and/or transcript stability by catalyzing the pairing of small RNAs (sRNA) and their mRNA targets (Figure 1B and reviewed in [9]). In contrast to the many examples of Hfq acting in a post-transcriptional capacity to impact gene expression, there is (to our knowledge) only one example in the literature of Hfq acting at the level of transcription to influence gene expression. In the case of ribosomal proteins rpsO, rpsT and rpsB-tsf, Hfq was shown to increase transcript * Correspondence:[email protected]
Department of Biochemistry, University of Western Ontario, London ONN6A 5C1, Canada
levels without influencing transcript stability. It was sug-gested that this is accomplished through Hfq binding to secondary structure elements in the respective transcripts that form early in the elongation phase of transcription and that this interaction reduces RNA polymerase pausing [10].
As noted above, Hfq has been implicated in the regu-lation of Tn10/IS10 transposition. Under conditions of hfqdeficiency, a large increase in bothTn10/IS10 trans-position (up to 80-fold) and transposase expression (up to 7-fold) were observed. The existing evidence is con-sistent with Hfq acting as a negative regulator of IS10 transposase expression by both antisense dependent and independent pathways. In support of the latter, it was found that hfqdeficiency (or hfq−) had a significant im-pact onTn10 transposition even when the level of anti-sense RNA was insufficient to impact on transposase expression (that is when Tn10 is present in single copy in the bacterial chromosome). In addition, there was a
synergistic increase in transposase expression when both hfq and the antisense RNA were knocked out, implying that Hfq does not function exclusively in the same path-way as the antisense RNA [7].
Taking the above results into account, and considering that most bacterial transposition systems are not regulated by antisense RNAs, we wondered if Hfq might play a more general role in regulating transposition systems. In the current work, we tested this hypothesis by asking ifTn5 transposition is also regulated by Hfq. LikeTn10,Tn5is a composite transposon (Figure 1A). The two transposons are closely related butTn5lacks an antisense RNA regula-tory system and consequently if Hfq were to regulate this system at the post-transcriptional level, it is likely that a trans-encoded sRNA would play a role [11-13]. Tn5 does encode an inhibitor protein that limitsTn5/IS50 transpos-ition by dimerizing with the transposase protein, forming an inactive complex [14]. Transposase and the inhibitor protein are expressed from overlapping promoters, P1 and
...CGGAACCTTTCCCGTTTTCCAGGATCTGATCTTCCAGGTGACCTCTTAAGATGGTAACGTTCATGATAACT...
T1 A A
0 1 -5
3
-T2
SD T’ase start
kanR
OE IS50L IE ble IE IS50R OE
R strR
0 1 -5
3 -LexA
...
5’ 3’
5’ 3’
5’ 3’
5’ 3’
5’ 3’ 5’ 3’
*
5’ 3’
3’ 5’
trans-sRNA
mRNA mRNA
cis-sRNA *
* *
** **
**
A
B
Hfq
Hfq
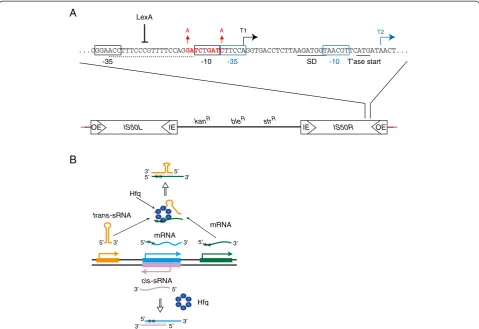
Figure 1Tn5/IS50structure and gene expression. (A)The structure ofTn5is shown along with transcription units withinIS50-Right. There are two distinct promoters defined by -35/-10 regions that control transposase (black) and inhibitor (blue) expression. T1 is the transposase transcript and T2 is the inhibitor transcript. The Shine-Dalgarno sequence of T1 is also shown. Expression of T1 but not T2 is regulated by DAM methylation at two GATC sequences (red) and potentially LexA binding (dotted line defines a putative LexA binding site). Mutations in thedamsites used in this work are shown.kanR,bleRandstrRare kanamycin, bleomycin and streptomycin resistance genes, respectively.(B)Post-transcriptional regulation by Hfq. Hfq
(blue hexamer) is shown catalyzing the pairing of an sRNA with an mRNA. The sRNA can be eithercisortransencoded relative to its target mRNA. In both cases the sRNA is shown pairing to the translation initiation region of the mRNA (asterisks) and would block translation.
P2 (color coded in Figure 1A), with the inhibitor transcript (T2) being expressed at a higher level than the transposase transcript (T1). T1 expression is down-regulated by DAM (reviewed in [15]). There is some evidence that P1 is also negatively regulated by LexA, an SOS-inducible transcrip-tional repressor [16]. However, there is little else known with regard to host proteins that influence either transpo-sase transcription or translation.
In the current work, we show that bothTn5transposition andIS50transposase expression increase significantly inE. coliunder conditions ofhfqdeficiency. However, unlike the situation in Tn10/IS10 transposition, the up-regulation of IS50transposase expression appears mainly to be due to an increase in transposase gene transcription. As Hfq does not typically function directly in transcription, we looked at the possibility that Hfq regulates IS50 transposase expression by controlling the expression of a transcription factor. To-wards this end, we provide evidence that Hfq acts in a regu-latory network with Crp (cyclic AMP receptor protein) to down-regulate IS50 transposase transcription. Finally, we demonstrate that over-expression of an sRNA (SgrS) acti-vates expression of the IS50 transposase gene specifically when cells are grown with glucose as the sole carbon source. Evidence is presented that this up-regulation is a consequence of glucose limitation, demonstrating that the IS50 transposase promoter (and Tn5 transposition) is re-sponsive to the nutrient status of the cell.
Results
Hfq is a potent negative regulator ofTn5transposition
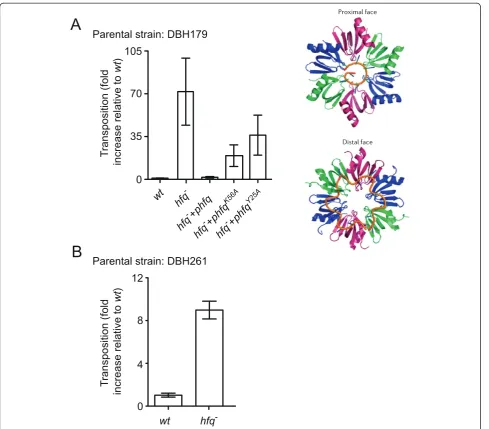
We asked if Hfq regulatesTn5transposition inE. coli by measuring the frequency ofTn5transposition under con-ditions of hfq deficiency using the ‘mating out’assay. In this assay, an F+ donor strain harboring a chromosomal copy of Tn5was mated to an F−recipient strain and the mating efficiency and number of transposition events were measured by plating mating mixes on the appropriate se-lective media (see Methods). We show in Figure 2A that in one donor strain background (DBH179)Tn5 transpos-ition increased by close to 75-fold under condtranspos-itions ofhfq deficiency. Note that we did not have a defective copy of Tn5to act as a negative control in this experiment.In lieu of this, we carried out physical mapping on a sampling of colonies present on ‘hop’ plates to ensure that bona fide transposition events were being measured in bothwtand hfq−strains (Additional file 1).
We also performed a complementation assay in the DBH179 strain background to further test that the in-crease in transposition reported above inhfq−was actually due to the absence of Hfq, as opposed to possible polar ef-fects of thehfqdisruption allele. Towards this end, we in-troduced hfq on a low-copy plasmid (pDH700) into the hfq−strain and measuredTn5transposition as above. We observed nearly complete complementation by
plasmid-bornehfq,as transposition was reduced approximately 45-fold relative to when nohfqwas present (Figure 2A). Fur-thermore, plasmid-encoded variants of hfq, including K56A and Y25A, which are impaired for RNA-binding at the ‘proximal’ and ‘distal’ surface, respectively, failed to complement hfq deficiency [17]. This confirms that spe-cific functions of Hfq, namely interaction with RNA via known RNA-binding surfaces, are required for effective repression ofTn5transposition.
We also tested the impact ofhfqdeficiency onTn5 trans-position in a second donor strain background (DBH261) via the ‘mating out’assay (Figure 2B). In this experiment hfq−also caused an increase inTn5transposition, although the magnitude of the effect was smaller (approximately 9-fold) than reported for the DBH179 strain background.
IS50transposase expression increases inhfq−cells
We next asked if hfq status influencedIS50transposase expression. In one approach, we measured transposase expression by constructingIS50-lacZtranscriptional and translational fusions (‘TCF’ and ‘TLF’, respectively; see Figure 3A for schematics), integrating these reporters into the chromosome of a lac− E. coli strain (DBH107), and then performing β-galactosidase assays. This was done for each reporter in isogenic strains that were ei-therwt, dam− or hfq−. As expected for a promoter that is DAM-sensitive, transposase expression increased in the context of both transcriptional and translational fu-sions in thedam−strain relative towt (approximately19-and 25-fold, respectively; Figure 3B). The increase in transposase expression for both constructs in dam− is indicative of expression coming predominantly from the P1 promoter [2]. Transposase expression in TCF and TLF constructs also increased in hfq− cells (11-fold and 7.4-fold, respectively), indicating that Hfq (or a factor under Hfq control) represses IS50 transposase expres-sion. As the TCF encodes only 15 nucleotides of the transposase transcript (T1), it seemed most likely that up-regulation of transposase expression inhfq− was pri-marily due to enhanced transcription in both TCF and TLF constructs.
containing the lpp promoter. These results support our contention that Hfq-directed regulation ofIS50 transpo-sase expression occurs at the transcriptional level be-cause the absence of the IS50 promoter and not the presence of theIS505′UTR was the dominant factor in observing strong up-regulation of reporter expression under conditions ofhfqdeficiency.
Hfq impacts steady-state levels of full-lengthIS50
trans-posase mRNA
To further assess the impact of hfqdeficiency on trans-posase gene expression, we looked at both the steady-state level and the stability of the transposase transcript (T1) inhfq+andhfq−cells. For the steady-state analysis, total RNA was isolated from various strains (wtor hfq−) Figure 2Frequencies ofTn5transposition inhfq−versuswtstrains ofE. coli. (A)Tn5transposition from the chromosome of DBH179 and derivatives (hfq−anddam−) was measured by the conjugal‘mating out’assay as described in Methods. For purposes oftrans-complementation, strains contained an empty vector or a low-copy plasmid encoding either wild typehfqWTor mutant forms ofhfq(K56A or Y25A) expressed from thehfq P3 promoter. The data was compiled from four independent experiments, each with at least three isolates of each strain. The average transposition frequency was 8.33 × 10⁻⁵events per mL of mating mix for thewtstrain (no‘hfqplasmid’) and for purposes of comparison this value was set at 1 and all other values normalized to this. The illustration shows the structure of an Hfq hexamer with RNA (gold) bound either to the proximal or distal face [9]. The Y25A mutation inhibits RNA binding to the distal face and the K56A mutation inhibits RNA binding to the proximal face. Adapted from Nature Reviews: Microbiology [9] with permission from Macmillan Publishers.(B)Tn5transposition from the chromosome of DBH261 and derivatives (hfq−and dam−) was measured as in(A). The data shown is from one experiment with five independent isolates of each strain. The average transposition frequency for thewtstrain was 2.57 × 10⁻⁶events per mL of mating mix. In(A)and(B)the error bars indicate standard error of the mean.
(DBH33 background) containing a multi-copy plasmid encoding the full-length transposase gene under the control of its native promoter. In addition to thewt ver-sion of this plasmid (pDH533), we also analyzed a mu-tant form containing mutations in the overlapping dam methylation sites in the transposase promoter (pDH752) (see Figure 1A); these mutations make this construct DAM insensitive. Primer extension was used to detect both T1 and T2 transcripts, as well as the lpp transcript
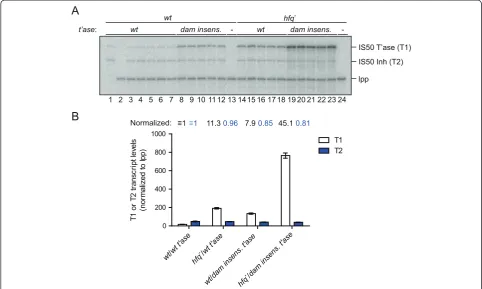
(loading control). As expected for a dam-sensitive pro-moter, levels of T1 increased substantially (approximately 8-fold) in wt cells containing the plasmid with the dam-insensitive promoter versuswtcells containing thewt pro-moter (compare lanes 3 to 7 with lanes 8 to 12 in Figure 5A and bar graph in Figure 5B). In contrast, there was no sig-nificant change in T2 levels in the above samples. Inhfq− (wt promoter) there was also a substantial increase in T1 levels (11-fold) versus the wtstrain (compare lanes 3 to 7 with lanes 14 to 18) and no significant change in T2 levels. Thus in an hfq−background there was an increase in the steady-state level of transposase transcript and this increase was slightly greater than that observed when methylation of the transposase promoter was blocked.
We also looked at the combined impact of knocking out Hfq and blocking DAM methylation on T1 levels (lanes 19 to 23 in Figure 5A). In comparison to wt, the ‘double mutant’situation resulted in a 45-fold increase in T1 levels. Based on the observed synergy, we think it unlikely that the observed impact of deleting hfq is linked to the regulation ofdamexpression.
To directly test if a component of Hfq-directed repres-sion ofIS50transposase expression is post-transcriptional, Figure 3Transposase-lacZtranslational and transcriptional
fusion reporter assays inwt,dam−andhfq−strains. (A) Schematic of theIS50-lacZtranscriptional fusion (TCF; upper) and translational fusion (TLF; lower) reporters. The TCF reporter encodes the first 80 bp ofIS50-Right (white rectangle) fused tolacZ(light blue rectangle). This fusion encodes only the first 15 nucleotides of the transposase (T1) transcript, which is expressed from the native promoter; the -35/-10 elements are shown in black. The inhibitor transcript is not expressed as the promoter for the inhibitor is missing its -10 region. The TLF encodes the first 128 bp ofIS50-Right. This includes up to the 12th codon of T1, which is fused in-frame to the 10thcodon oflacZ(purple rectangle). T1 and T2 and their respective promoter elements (-35/-10 sequences) are color-coded. Note that the start codon for the inhibitor protein has been mutated so that only transposase expression will give rise toβ-galactosidase activity. Also note that the transposase promoter in both the TCF and the TLF is sensitive to Dam methylation.(B) β-galactosidase activity (given in Miller Units) for isogenic strains (wt,dam−orhfq−) harboring either the TCF or TLF in single-copy in the chromosome ofE. coli. For each fusion, the activity was normalized to that of thewtstrain. The data sets shown for the TCF and TLF were compiled from two and three independent experiments, respectively, with each experiment including at least three replicates. Mean and standard error values are shown.
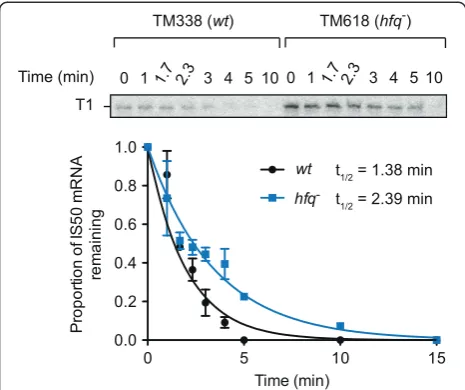
we compared the stability of theIS50 transposase mRNA (T1) in isogenic wt andhfq− strains. Total RNA was iso-lated from a pair of rifampicin-sensitive strains (TM338 and TM618) containing a plasmid encodingIS50 transpo-sase (pDH533) before and after rifampicin treatment as shown in Figure 6. Transposase mRNA was detected by primer extension. In thehfq−strain the half-life of the T1 transcript increased by approximately 1.7-fold, revealing thathfqstatus does impact on transposase mRNA stability. Taken together, the results from Figures 3, 4, 5 and 6 show thatIS50transposase expression is substantially re-duced in an hfq+ relative to an hfq−strain and that hfq status primarily affects transposase transcription.
Regulation ofTn5transposase expression by global
transcriptional regulators
As Hfq does not typically function directly in transcrip-tion, we set out to define a transcription factor that down-regulatesIS50transposase transcription and is itself regu-lated by Hfq. Toward this end, we asked if disrupting genes for two global transcription factors, Crp and Lrp [18], had an impact onIS50transposase expression. Note that we had to construct new TCF reporter strains for this work because the available crpand lrpdisruption strains
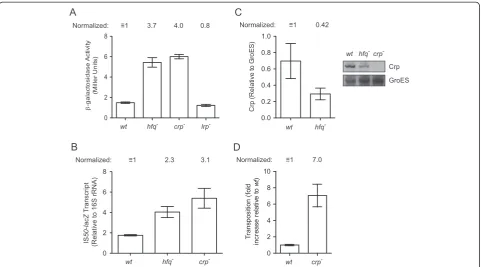
we used to transduce DBH107 to either crp− or lrp− were marked with the same antibiotic resistance gene used to select for a lysogen with a chromosomal copy of the TCF. We show in Figure 7A thatcrp−but notlrp−had a substantial impact on transposase expression. For ex-ample, in cells grown in exponential phase in Luria broth (LB), there was up-regulation of transposase expression (approximately 4-fold) in both crp− (DBH307) and hfq− (DBH306) strains but not in thelrp−strain (DBH315). We also performed semi-quantitative RT-PCR and show that transposase-lacZ transcript levels increased similarly in crp−and hfq−strains (Figure 7B). These results are con-sistent with Crp being a negative regulator ofIS50 trans-posase transcription.
We next asked if Crp expression was regulated by Hfq. Notably, work done in Yersinia pestis has shown that Hfq positively regulates Crp expression at the post-transcriptional level [20]. Towards this end we performed Western blot analysis with a Crp antibody on E. colicell extracts from wt (DBH303), hfq− (DBH306) and crp− (DBH307) strains (Figure 7C). The results show that lower levels of Crp are present in thehfq−strain, which is con-sistent with Hfq also being a positive regulator of Crp ex-pression inE. coli.
Figure 5Steady-state levels ofIS50transposase mRNA inwtandhfq−cells. (A)Plasmids encodingwtor DAM-InsensitiveIS50transposase genes were transformed intowt(DBH33) orhfq−(DBH16)E. colistrains. Total RNA was isolated from five different clones grown to mid-log phase for each of the indicated strains. Primer extension reactions were multiplexed using32P-labeled primers complimentary toIS50transposase (primer
oDH230) andlpp(primer oDH390) RNAs. The corresponding cDNAs were analyzed on a 10% sequencing gel. T1 and T2 are defined in Figure 1. Note that transcription oflppis known to be insensitive tohfqstatus [10].(B)Summary of data in(A).
Finally, we assessed the impact of knocking outcrpon Tn5transposition frequency using the‘mating out’assay (Figure 7D). In the absence ofcrp,Tn5transposition in-creased 7-fold, which is consistent with results from the transposase expression experiments.
IS50transposase expression andTn5transposition are
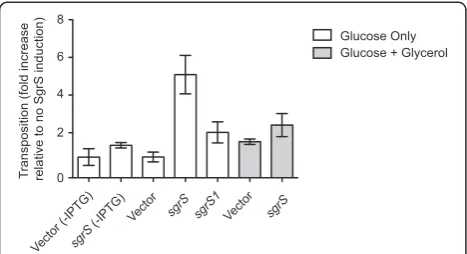
up-regulated by over-expression of the sRNA SgrS Over-expression of sRNAs can alter Hfq-regulated net-works by limiting the availability of Hfq [21,22]. Given our findings thatTn5 transposition and transposase gene ex-pression are affected byhfqstatus, we asked ifIS50 trans-posase expression might be sensitive to Hfq-titration. Towards this end, we measured transposase expression from the TLF under conditions where a single sRNA was over-expressed from an IPTG inducible promoter (pLlacO) in DBH33, which islacIq. Our initial screen included four different Hfq-dependent sRNAs, including RybB, RyeB, MicC and SgrS, all of which are expected to tightly bind Hfqin vivo; apparent equilibrium dissociation constants of approximately 3.3 nM and < 20 nM have been measured for MicC and SgrS, respectively [23-25]. Cells were grown in M9 glucose and sRNA expression was induced for 4 hours in exponential phase. We show in Figure 8A that only one of the sRNAs tested, SgrS, had a significant impact on transposase expression. Induction of SgrS increased transposase expression just over three-fold. Given the
comparable Hfq binding affinities of the sRNAs tested, it seemed unlikely that SgrS expression was increasing trans-posase expression through an Hfq-titration mechanism.
SgrS down-regulates the expression of several known targets, including the primary glucose transporter encoded by theptsGgene, a mannose transporter encoded by man-XYZ and it up-regulates the expression of yigL, a phos-phatase involved in phospho-sugar detoxification [26]. As we observed up-regulation ofIS50transposase expression in cells over-expressing SgrS in M9 glucose media, we considered the possibility that this effect was a response to glucose limitation. In fact, we show in Additional file 2 that induction of SgrS in M9 glucose resulted in a sub-stantial slowing of bacterial growth, as would be expected if nutrients had become growth-rate limiting. To further test the glucose limitation hypothesis, we performed a similar experiment in rich media (LB) and in M9 glucose supplemented with glycerol, a carbon source whose im-port is not dependent on glucose transim-porters [27]. We also tested the response of the reporter to over-expression of an SgrS mutant, sgrS1, that is incapable of down-regulating glucose import [28]. In these experiments we used aTn5TCF as a reporter in the DBH107 strain back-ground; DBH107 has a complete deletion of the lac op-eron and consequently the plasmid-encoded sRNA genes are constitutively expressed. To avoid problems in grow-ing these cells, cultures were initially propagated in either LB or M9 glucose/glycerol and then where indicated, switched to other media.
We show in Figure 8B that after approximately 4 hours of SgrS over-expression in M9 glucose, reporter expres-sion increased close to 5-fold relative to a ‘vector’ con-trol. In contrast, over-expression of SgrS1 was incapable of up-regulating reporter expression under these same conditions, suggesting that SgrS must be able to down-regulate glucose import and or retention in order to in-crease transposase transcription. When cells were grown in M9 glucose supplemented with glycerol, expression of SgrS as above caused only an approximately 2-fold in-crease in transposase expression. Importantly, the re-duced effects of SgrS on transposase expression under ‘glycerol’ conditions cannot be explained by differential expression of the respective sRNAs, as levels of SgrS and SgrS1 were similar in M9 glucose with or without gly-cerol (Figure 8C). Also, we failed to see significant trans-posase induction when SgrS was over-expressed in LB media where there are multiple carbon sources. Finally, consistent with the glucose limitation hypothesis, we also show in Figure 8B that increased transposase ex-pression resulting from SgrS exex-pression in M9 glucose was the only condition that inhibited cell growth.
Given that transposition frequency is expected to be roughly proportional to transposase expression, we also
asked if glucose limitation had an impact on Tn5
Figure 6IS50transposase mRNA half-life analysis.Strains TM338 (wt) and TM618 (hfq−) were transformed withIS50transposase encoding plasmid pDH533 and total RNA was isolated either before or after the addition of rifampicin (at the indicated time points). Transposase RNA was detected as described in Figure 5. The bands were quantified (ImageQuant) and T1 normalized to un-extended primer before plotting the proportion of RNA remaining after rifampicin addition (time zero = 1.0). The data was fit to a one-phase exponential decay curve by non-linear regression (Prism) to determine the half-life (t1/2). The data shown is a compilation from
transposition. Cells encoding a chromosomal copy of Tn5 were transformed with an SgrS-expressing plasmid (or vec-tor only control) and the frequency of Tn5 transposition was measured using the‘mating out’assay. Note that cells were grown in M9 glucose media and SgrS expression was induced only when donor strains were subcultured on the day of mating. We show in Figure 9 that induction specific-ally of SgrS resulted in a 5-fold increase inTn5 transpos-ition relative to the vector only control. Notably, when cells were grown in M9 supplemented with glucose and glycerol, induction of SgrS did not result in a significant in-crease inTn5 transposition. Also, we observed a reduced growth rate only in cultures where SgrS was induced in M9 glucose media (data not shown). The results of the ‘mating out’analysis are thus entirely consistent with the gene expression experiments presented in Figure 8.
Discussion
Hfq is a global regulator of gene expression in bacteria. However, until recently, Hfq had not been linked to the
control of transposable elements. Work in the Tn10/ IS10system provided the first example of Hfq inhibiting a transposon [7]. In the current work, we asked if the transposition of a related element,Tn5/IS50, is also reg-ulated by Hfq. We show thatTn5transposition andIS50 transposase expression are repressed by Hfq; however, the mechanism of repression is atypical for Hfq, involving predominantly a block in IS50 transposase transcription. Preliminary evidence is presented that is consistent with Hfq modulating IS50 transposase transcription through regulation of Crp. We also show that transposase tran-scription and Tn5 transposition are activated by over-expression of the sRNA SgrS and provide evidence that this is a transcriptional response to glucose limitation.
Hfq negatively regulatesTn5transposition
The results of ‘mating out’ experiments were consistent with Hfq acting as a strong negative regulator of Tn5 transposition.Tn5transposition increased close to 75-fold Figure 7Gene expression andTn5transposition assays in strains harboring disruptions of global transcriptional regulators. (A)
β-galactosidase activity for isogenic strains (wt,hfq−,crp−andlrp−) harboring the TCF in single-copy in the chromosome (DBH303 and derivatives). Cells were grown to mid-log phase in Luria broth (LB). Mean and standard error values of duplicate experiments, each of which included at least three replicates, are shown.(B)IS50-lacZtranscript levels. Total RNA was extracted from cells described in panel(A), and subjected to RT-PCR.(C) Western blot analysis of Crp levels in cellular extracts fromwtandhfq−cells grown in LB. As a negative control,crp−cells were also analyzed. A representative image is shown in the inset. Crp levels were normalized to GroES, which is known to be insensitive tohfqstatus [19].(D)Tn5 transposition from the chromosome of DBH179 (wt) and DBH345 (crp−) was measured by the conjugal‘mating out’assay as described in Methods. The data is from a single experiment wherein five independent clones of each strain were tested. Mean and standard error values are shown. The average transposition frequency was 1.70 × 10⁻⁴events per mL of mating mix for thewtstrain and for purposes of comparison this value was set at 1 and the‘crp’value was normalized to this. In two other independent experiments the fold increase inTn5transposition for crp−versuswtdid not differ by more than 20% compared to the experiment shown (data not shown). For experiments in(A-C), mean and standard error values from at least three independent isolates are shown.
in onehfq−strain (DBH179 background). The magnitude of this increase was somewhat surprising given that up-regulation of Tn10 in hfq−, under essentially antisense-minus conditions, was about 7-fold [7]. However, in a dif-ferent hfq− strain (DBH261 background) Tn5 transpos-ition increased only 9-fold. At this point it is unclear why there was such a large discrepancy in the ‘mating out’ values for the two strains. One possibility is that colony counts in the DBH179‘mating out’(hfq−) included clones
that had‘jack-pot’ events. That is, colonies were counted that did not derive from independent transposition events. This could explain the high standard error associated with the transposition frequency in thehfq−column in Figure 2A. If, for example, we removed the 3 most prominent outliers from the (DBH179)hfq−data set, the fold increase in trans-position dropped to 15-fold, which is more in line with what we observed in the DBH261 strain background and forTn10in single copy [7].
Figure 8Transposase-lacZexpression assays in cells over-expressing sRNAs. (A)Transposase expression from anIS50translational fusion (TLF) (see Figure 3A) present on a low-copy plasmid (pDH798) was measured in the presence of a compatible plasmid expressing one of the indicated sRNAs from the induciblepLlacOpromoter in DBH33. Cells were grown in M9 glucose and 0.1 mM IPTG was added to subcultures to induce sRNA expression. Transposase expression was measured 4 hours after IPTG addition. Expression levels were normalized to the strain with the vector only control.(B)The impact of different growth media on SgrS-induced up-regulation of transposase expression was evaluated using a single-copy TCF fusion (see Figure 3A) present in the chromosome of DBH265. Note that thesgrS1 allele of SgrS contains a two-nucleotide mutation that inhibits its ability to down-regulate expression of the glucose transporter encoded byptsG. Subcultures were grown in either M9 glucose, M9 glucose + glycerol, or Luria broth (LB), as indicated.β-galactosidase activity was measured approximately 4 to 6 hours after subcultures were started. In (A)and(B)mean and standard error values of duplicate experiments, each of which included at least three replicates, are shown.(C)Northern blot of RNA isolated from cells in(B). RNA was extracted from cells immediately before starting the Miller assay and visualized by Northern blotting with
A trans-complementation (Figure 2A) experiment pro-vided definitive proof that the increase in Tn5 transpos-ition detected in one of our hfq− ‘mating out’ strains (DBH179 background) was in fact due to hfqdeficiency. In addition, the failure of two Hfq RNA-binding face mutants to provide complementation was consistent with Hfq-directed inhibition ofTn5transposition relying on functions of Hfq required in canonical Hfq-directed regulatory pathways [17]. That is, Hfq must retain the ability to bind both mRNAs and sRNAs to influenceTn5 transposition.
Hfq, Crp andIS50transposase gene expression
Evidence that hfqstatus influences IS50transposase ex-pression came from two types of experiments. First, the expression of transposase-lacZ reporter genes in both transcriptional and translational fusion constructs in-creased significantly under conditions of hfq deficiency. Second, the steady-state level of the native transposase transcript also increased significantly in hfq−. Import-antly, the large increase in steady-state transcript level (11-fold) coincided with a less substantial increase in transposase mRNA stability (less than 2-fold increase in half-life). In addition, up-regulation of reporter expres-sion inhfq−for a TLF was almost completely abrogated when the IS50 transposase promoter was replaced by a heterologous promoter. Taken together, these results are consistent with Hfq (or a factor regulated by Hfq) sup-pressing IS50 transposase expression predominantly at the level of transcription. Notably the suppressive effect of Hfq onIS50transposase transcription was remarkably
specific, as the level of a second transcript (T2) encoded byIS50was not affected byhfqstatus.
As Hfq does not typically act directly in gene transcrip-tion, we think it likely that Hfq acts indirectly on theIS50 transposase promoter. In addition to DAM, only one other transcription factor, LexA, has been implicated as a regula-tor of transposase transcription. There is a weak LexA-binding site in the transposase promoter (Figure 1A); how-ever, lexA deficiency was shown to increase transposase transcription only two to three-fold in a TCF [16]. As we have seen increases in transposase expression of up to 11-fold for a TCF inhfq−, it seems unlikely that Hfq would be working through LexA. In contrast, transposase expression increased in dam− to a level more in line with that ob-served inhfq−(less than two-fold difference in the TCF). However, the observed synergy between hfq− and muta-tions that rendered theIS50transposase promoter DAM-insensitive led us to conclude that Hfq does not regulate IS50 transcription by impacting DAM levels (and, there-fore, promoter methylation). These results provided motiv-ation to search for other targets of Hfq that impinge on IS50 transposase transcription. This search identified Crp as an additional negative regulator of IS50 transposase transcription. Notably, transposase expression increased to approximately the same level in crp− and hfq− in the experiment in Figure 7. The similar magnitude of up-regulation of transposase expression inhfq−andcrp−could be indicative of Hfq acting upstream of Crp to inhibit transposase expression. We did in fact find evidence of Hfq positively regulating Crp protein levels (Figure 7C). This observation is consistent with work recently published in theY. pestissystem where it was found that Crp protein levels decreased approximately five-fold in an hfq disrup-tion strain [20].
Crp is a known activator/repressor of transcription [18] and, therefore, more likely than Hfq to be directly involved in regulatingIS50transposase expression at the transcrip-tional level. Given our evidence that Hfq positively regu-lates crp expression, a plausible scenario explaining our expression data is that the observed up-regulation ofIS50 transposase transcription in hfq− is a result of decreased Crp protein levels. Crp may act either directly or indirectly on theIS50transposase promoter to repress transcription. This is currently a working model as we have not yet tested the possibility that Crp binds the IS50 transposase pro-moter and it may only be coincidental that transposase ex-pression increased to similar levels inhfq−andcrp−strains. Notably, we also found that Tn5 transposition increased when the crp gene was disrupted, although the extent of the increase was smaller than that observed in the isogenic hfqdisruption strain. This could be indicative of additional factors in the Hfq regulon impinging onTn5transposition.
There is precedent for Crp down-regulating the tran-scription of a transposase gene. In the case of IS2, Figure 9Impact of SgrS expression onTn5transposition.
Transposition of a chromosomal copy ofTn5was measured in DBH179 using the‘mating out’assay. DBH179 containing one of the indicated plasmids was grown overnight in M9 glucose and then subcultured in either M9 glucose or M9 glucose plus glycerol before mating with the recipient strain and plating on selective media as described in Figure 2. IPTG was added to the subculture (to 0.1 mM) to induce SgrS expression, except where indicated (-IPTG). The average transposition frequency for the‘no SgrS’control was 5.52 × 10⁻⁵events per mL of mating mix. All
other transposition frequencies were normalized to this value. Mean and standard error values of duplicate experiments, each of which included at least five replicates for each experimental group, are shown.
transposase transcription increased close to 200-fold in crp−. It was also shown through protein-DNA foot-printing that Crp binds directly to the IS2 transposase promoter [29]. Interestingly, based on the consensus binding sequence for Crp, the authors of the above study predicted that Crp would bind to theIS50 trans-posase gene. However, the predicted crp binding site is located downstream of the transposase promoter and is not present in our TCF (where we detected increased transposase expression in crp−). Nevertheless, it would be worthwhile to test for Crp binding to theIS50 trans-posase promoter as the results of Crp ChIP-chip studies revealed the presence of thousands of weakcrp binding sites scattered throughout the E. coligenome [30]. It is also possible that Crp acts indirectly on the IS50 trans-posase promoter by regulating the expression of an-other transcription factor.
Tn5transposition and metabolic stress
We also identified conditions that activate transposase ex-pression and transposition; over-exex-pression of the sRNA SgrS increased transposase expression and transposition approximately five-fold. We favor the possibility that this induction is a consequence of glucose limitation but cannot formally rule out the possibility that SgrS targets an as yet undefined regulatory pathway that impinges on transposase expression. Our reasoning for this is that we observed in-duction of transposase expression and transposition specif-ically when cells were grown with glucose as the major carbon source and SgrS is known to prevent expression and function of the major glucose transporter encoded by theptsGgene [26]. Consistent with this idea, we found that transposase induction levels correlated with a reduced growth rate. Furthermore, we demonstrated that: (i) an al-lele of SgrS (sgrS1) that is incapable of down-regulating ptsG expression failed to induce transposase expression in M9 glucose; (ii) under conditions where SgrS was expressed in M9 glucose media supplemented with glycerol, we failed to see induction of transposase expression to the same ex-tent as when glycerol was absent; (iii) SgrS expression did not impact transposase expression when cells were grown in rich media (LB) and (iv) over-expression of 3 other sRNAs (RybB, RyeB and MicC) that are not expected to influence glucose transport did not increase transposase expression in M9 glucose [31-33]. Precedent for nutri-tional stress influencing transposition comes from earlier work in the IS903 system where mutations in a gene (aspA) required for fermentative metabolism during an-aerobic growth caused transposition to occur at an accel-erated rate [34].
At this point it is unclear as to what factors are driving the induction of the transposase gene under SgrS over-expression conditions. With regard to further defining the mechanism of IS50transposase up-regulation under
SgrS over-expression conditions, it would also be advanta-geous to find alternative experimental conditions for achieving this increased expression. If, for example, simply starving cells by restricting a carbon source during growth achieves the same end as over-expressing SgrS in M9 glu-cose media, an unbiased screen to search for genetic factors that are necessary for the up-regulation of transposase expression could be performed to reveal the regulatory net-work impinging on the transposase promoter. As it stands, any factors that influence SgrS expression would interfere with the outcome of such a screen. Alternatively, if it was found that restricting glucose is not sufficient for inducing transposase expression, the possibility that SgrS plays a more direct role in controlling transposase expression would have to be considered.
Conclusions
In this work, we have identified several genes that impact onIS50transposase expression, includinghfq,crpandsgrS. Hfq and Crp proteins are negative regulators and SgrS RNA (under specific growth conditions) is a positive regu-lator of transposase gene expression. Exactly how these fac-tors impinge on transposase expression remains to be worked out and at this point it is not clear if we are seeing modulation of the same regulatory network in opposite di-rections when hfq and crp genes are disrupted and SgrS RNA is over-expressed.Tn5/IS50is the second transposon identified that is affected by disruption of thehfqgene and the first that does not encode an antisense RNA. This raises the possibility that Hfq influences the transposition frequency of many other bacterial transposons.
Methods
Plasmids, bacteriophage and strains
The IS50 translational fusion plasmid (pDH798) is a pWKS30-derivative containing base pairs 1 to 431 ofIS50 (nucleotides 1 to 366 of T1) fused to codon 10 [35] of the E. coli lacZgene. TheIS50transcriptional fusion plasmid (pDH682) is a pUC18-derivative containing base pairs 1 to 80 ofIS50(nucleotides 1 to 15 of T1) fused to nucleotide -16 (relative to the translational start codon) oflacZ.
Plas-mids encoding sRNAs (pDH764, sgrS; pDH766, rybB;
pDH768, micC; pDH772, ryeB) and the corresponding
empty vector control (pDH763) were kindly provided by S Gottesman. The plasmid encoding sgrS1 (pDH895) was kindly provided by C Vanderpool. Plasmids encoding Hfq (pDH700, wt) and mutant derivatives (pDH701, K56A; pDH713, Y25A) are described in Rosset al[8]. Details of plasmid constructions are provided in Additional file 3 and a list of oligonucleotides used in this work is provided in Additional file 4.
an antibiotic resistance gene (eitherkanRorcmR) into the hisoperon of pNK81 and then infecting a strain harboring one of these plasmids withλNK1039, which also contains thehisoperon. Antibiotic resistant lysogens from the above crosses were selected by replica plating and subsequently phage released from the lysogens were purified, giving rise to λDBH849 (IS50-lacZ-kanRTCF), λDBH888 (IS50-lacZ-CmRTCF) andλDBH812 (IS50-lacZ-KanRTLF).
E. coli strains for the ‘mating out’ assay were con-structed by P1 transduction ofTn5from ER2507 (NEB) into DBH33, DBH344 and DBH259. Strains containing chromosomalIS50-lacZfusions were generated by
lysoge-nizing DBH107 with λDBH849 (DBH265), λDBH888
(DBH303) or λDBH812 (DBH281). Mutant derivatives of these strains were generated by P1 transduction. A list of all of the strains, plasmids and bacteriophage used in this work is presented in Table 1.
‘Mating out’assay
Conjugal ‘mating out’ experiments were performed es-sentially as described for single-copy chromosomal transposons in Ross et al. [7], except that for measuring transposition inhfq−versuswt,donor growth was carried out in M9 glucose media supplemented with kanamycin (25 μg/mL) and amino acids, instead of LB. DBH13 was used as the recipient. Total exconjugants and transpos-ition events with DBH179 and derivatives were scored by plating mating mixes on M9 glucose plates supplemented with leucine, thiamine and streptomycin (150 μg/mL) or streptomycin and kanamycin (25 μg/mL), respectively. Total exconjugants and transposition events with DBH261 and derivatives were scored by plating mating mixes on M9 glucose plates supplemented with leucine, thiamine, streptomycin (150 μg/mL) and gentamicin (12.5 μg/mL) or streptomycin, gentamicin and kanamycin (25 μg/mL), respectively.
β-galactosidase assays
Cells were grown in M9 glucose (with arginine and thiamine) or LB. In situations where strains contained plasmids, plasmids were maintained by including the appropriate antibiotic. Overnight cultures (0.05 mL) were used to seed subcultures (1.5 mL), which typically were grown to mid-log phase before being processed for the Miller assay as previously described [7].
RNA isolation, primer extension and Northern blot analysis
Total RNA was isolated essentially as described in [50]. For steady-state analysis, cells were grown to mid-log phase in LB before RNA isolation. For half-life analysis, rifampicin (dissolved in dimethyl sulfoxide; DMSO) was added to cell cultures (to 200μg/mL) to arrest transcrip-tion and RNA was isolated immediately before and after
rifampicin addition at the indicated time intervals. Primer extension analysis was carried out using32P-labeled primers oDH230 and oDH390, end-labeled with OptiKinase (USB, Cleveland, OH, USA) according to manufacturer’s instruc-tions. Extension reactions used 5 μg of RNA, and Super-script III reverse tranSuper-scriptase essentially as described in [51], except that annealing was performed at 65°C (with no ice treatment) before extending at 55°C for 45 minutes. Ex-tension products were resolved on 6% and 10% denaturing polyacrylamide gels. For Northern blot analysis, 2 μg of RNA was mixed with an equal volume of denaturing load dye (95% deionized formamide [v/v], 10 mM EDTA, 0.5× TBE, 3% xylene cyanol [w/v]), heated to 95°C for 2 minutes, and resolved on a 6% polyacrylamide gel containing 7 M urea. Separated RNAs were electro-transferred to Hybond N (GE Healthcare, Mississauga, ON, Canada) in 0.5× TBE and fixed with UV. Annealing and washing was performed in ULTRAhyb buffer (Ambion, Burlington, ON, Canada) according to the manufacturer’s instructions, using RNA probes complimentary to SgrS or the 5S rRNA (internal standard). To construct the radiolabeled RNA probes, DNA templates for in vitro transcription were made by PCR with primers oDH232/233 (SgrS) and oDH234/235 (5S rRNA) - note that, for each primer pair, the forward pri-mer includes the T7 core promoter. These templates were transcribedin vitroin the presence of32P-UTP to generate uniformly labeled RNA probes.In vitrotranscription reac-tions were performed in 25μL volumes with approximately 1μg DNA template, 1 × T7 RNA polymerase buffer (NEB, Beverly, MA, USA), 20 units RNasin (Promega, Madison, WI, USA), 4 mM dithiothreitol (DTT), 0.16 mg/mL BSA, 0.4 mM each of GTP, CTP and ATP, 0.01 mM UTP, 50μCi [α-32
P]UTP, and 100 units of T7 RNA polymerase.
Western blot
Cells were centrifuged (2 minutes at 21,000 ×g), resus-pended in SDS load mix (2% [w/v] SDS, 10% [v/v] glycerol, 50 mM Tris-HCl pH 6.8, 0.25% [w/v] bromophenol blue, 0.8 M β-mercaptoethanol) and heated at 95°C for 5 mi-nutes. To normalize for differences in growth between the various samples, the OD600of each sample was measured
and the volume spun normalized to give an equivalent to OD600 approximately equal to 0.35. The resulting lysates
were subjected to SDS-PAGE on a 12% polyacrylamide gel, proteins transferred to PVDF (Roche, Indianapolis, IN, USA) and Crp was detected by Western blot with a poly-clonal rabbit anti-Crp antibody (kind gift of H Aiba). The primary antibody was diluted 1:20,000 in TBST; the sec-ondary antibody (anti-rabbit IgG-horseradish peroxidase (HRP) conjugate; Promega, Madison, WI, USA) was used at 1:5,000. Crp was visualized with a Pierce ECL 2 Western blotting substrate (Thermo Scientific, Rockford, IL, USA) and PhosphorImager (GE Healthcare). The membranes were stripped and GroES detected (rabbit anti-GroES
Table 1 Plasmids, bacteriophage and strains
Strain or Plasmid Relevant genotype Use Source or reference
E. coli
DBH13 HB101 [F−leu−pro−]; StrR ‘Mating out’recipient [36]
ER2507 zjc::Tn5; KanR Source ofzjc::Tn5 NEB
DBH179 NK5830 [recA−arg−/F’lacpro+]zjc::Tn5; KanR ‘Mating out’donor This study
DBH184 DBH179hfq-1::Ωcat; KanRCmR ‘Mating out’donor This study
DBH228 RZ211/pOX38Gen Source of pOX38Gen [37]
DBH233 HW-5 [phoA4(Am)his-45 recA1 rpsL99 met-54F−]; StrR Parent strain [38]
DBH259 DBH233/pOX38Gen; StrRGenR Parent strain This study
DBH261 DBH259zjc::Tn5; StrRGenRKanR ‘Mating out’donor This study
DBH271 DBH261hfq-1::Ωcat; StrRGenRKanRCmR ‘Mating out’donor This study
DBH272 DBH261dam::Tn9cat; StrRGenRKanRCmR ‘Mating out’donor This study
DBH107 MC4100 [F−Δ(argF-lac)169* rpsL150]; StrR Parent strain [39]
DBH265 DBH107/λDBH849; StrRKanR Miller Assay This study
DBH267 DBH265hfq-1::Ωcat; StrRCmRKanR Miller Assay This study
DBH268 DBH265dam::Tn9cat; StrRCmRKanR Miller Assay This study
DBH281 DBH107/λDBH812; StrRKanR Miller Assay This study
DBH283 DBH281hfq-1::Ωcat; StrRCmRKanR Miller Assay This study
DBH285 DBH281dam::Tn9cat; StrRCmRKanR Miller Assay This study
DBH303 DBH107/λDBH888; StrRCmR Miller Assay This study
DBH306 DBH303Δhfq722::kan; StrRCmRKanR Miller Assay This study
DBH307 DBH303Δcrp765::kan; StrRCmRKanR Miller Assay This study
DBH315 DBH303Δlrp787::kan; StrRCmRKanR Miller Assay This study
DBH33 NK5830 [recA−arg−/F’lacpro+] Parent strain [40]
DBH16 DBH33hfq-1::Ωcat; CmR Parent strain [7]
DBH241 DBH33dam::Tn9cat; CmR Parent strain This study
DBH238 DBH33/λDBH849; KanR Miller Assay This study
DBH239 DBH238hfq-1::Ωcat; KanRCmR Miller Assay This study
DBH240 DBH238dam::Tn9cat; KanRCmR Miller Assay This study
DBH208 DBH33/λDBH812; KanR Miller Assay This study
DBH210 DBH208hfq-1::Ωcat; KanRCmR Miller Assay This study
DBH237 DBH208dam::Tn9cat; KanRCmR Miller Assay This study
DBH323 DBH107recA−; StrR Miller Assay This study
DBH326 DBH107recA−hfq-1::Ωcat; StrRCmR Miller Assay This study
DBH242 DBH33Δcrp765::kan Parent strain This study
DBH344 DBH242Δcrp765; KanS Parent strain This study
DBH345 DBH344zjc::Tn5; KanR ‘Mating out’donor This study
TM338 W3110mlc rne-Flag-cat; rifSCmR RNA half-life measurements [41]
TM618 W3110mlc rne-Flag-catΔhfq; rifSCmR RNA half-life measurements [42]
DH5α recA− Plasmid propagation Invitrogen
Plasmids
pWKS30 pSC101-derived; low copy-number ori ; ApR ‘Empty vector’for Hfq expression [35]
pDH700 pWKS30-P3-hfqWT; ApR HfqWTexpression [7]
pDH701 pWKS30-P3-hfqK56A; Ap
R
HfqK56Aexpression [7]
pDH713 pWKS30-P3-hfqY25A; Ap
R
antibody from Sigma-Aldrich (St Louis, MO, USA) at 1:10,000) for use as an internal standard; GroES is not sen-sitive tohfqstatus [19]. Bands were quantified using Ima-geQuant software (GE Healthcare) and Crp levels plotted relative to GroES.
Additional files
Additional file 1:MappingTn5transposition events.Southern blot and ST-PCR characterization ofTn5transposition events inwtandhfq−strains.
Additional file 2:Impact of SgrS over-expression on growth rate in M9 glucose.Growth curves of cells in which SgrS RNA was or was not induced by IPTG addition and corresponding Northern blot showing SgrS levels.
Additional file 3:Details of plasmids constructed for this work.
Additional file 4:List of oligonucleotides used in this work.
Abbreviations
BSA:bovine serum albumin; Crp: cyclic AMP-receptor protein; DAM: DNA adenine methylase; DMSO: dimethyl sulfoxide; DTT: dithiothreitol; EDTA: ethylenediaminetetraacetic acid; LB: Luria broth; PAGE: polyacrylamide gel electrophoresis; PCR: polymerase chain reaction; RT-PCR: reverse
transcription polymerase chain reaction; sRNA: small RNA; SDS: sodium dodecyl sulfate; TBE: Tris borate-EDTA buffer; TBST: 20 mM Tris-HCl (pH 7.5), 150 mM sodium chloride, 0.5% Tween-20; TCF: transcriptional fusion; TIR: translation initiation region; TLF: translational fusion; UTR: untranslated region; UV: ultraviolet light.
Competing interests
The authors declare that they have no competing interest.
Authors’contributions
JR performed‘mating out’assays,β-galactosidase assays in Figures 3, 7 and 8, RT-PCR assays, Western blot assays, participated in the design of the study and helped draft the manuscript. RT performed theβ-galactosidase assay in Figure 4, steady-state transcript measurements and RNA half-life measure-ments and prepared figures. MDB helped construct chromosomal reporter strains. CRM made the initial discovery thatTn5transposition is up-regulated under conditions of hfq deficiency and constructedIS50-reporter plasmids and expression plasmids. DBH participated in the design of the study, helped in constructing strains and plasmids, performed the‘mating out’experiment in Figure 7D and drafted the manuscript. All authors read and approved the final manuscript.
Acknowledgements
We thank Michael Ellis for providing comments on the manuscript and for useful discussions, and Claire Young for assistance with P1 transductions. We also thank S Gottesman and C Vanderpool for providing pLlacO-sRNA Table 1 Plasmids, bacteriophage and strains(Continued)
pDH533 pUC18-derivative;Tn5t’ase M56A; ApRCmR Source ofTn5transposase (No Inh.) [43]
pDH752 pDH533 with t’ase mutated to G53A,C61A; ApRCmR DAM-insensitive t’ase This study
pDH828 pDH533 with t’ase mutated to D97A; ApRCmR Catalytic−t’ase This study
pNK81 pBR333-derivative; encodes his operon; ApR Lambda crosses [44]
pDH682 pUC18-derivative;IS50-lacZTCF; ApR Source of TCF This study
pDH838 pDH682-derivative; TCF‘marked’with kanR Parent of pDH849 This study
pDH883 pDH682-derivative; TCF‘marked’with cmR Parent of pDH888 This study
pDH849 TCF-kanRfrom pDH682 cloned into BclI-cut pNK81; ApRKanR For crossing TCF ontoλ This study
pDH888 TCF-cmRcloned onto BclI-cut pNK81; ApRCmR For crossing TCF ontoλ This study
pDH658 pRZ9905-derivative; full-lengthIS50-lacZTLF; ApR Parent of pDH795 This study
pDH795 pDH658-derivative;‘deletion’TLF used in this study; ApR Parent of pDH804 This study
pDH804 pDH795-derivative; TLF‘marked’with kanR Parent of pDH812 This study
pDH812 TLF-kanRcloned into BclI-cut pNK81; ApRKanR For crossing TLF ontoλ This study
pDH753 pWKS30-derivative; containsIS50-lacZTLF from pDH658; ApR Parent of pDH798 This study
pDH798 pDH753-derivative; ApSKanR Miller Assay This study
pDH763 pBR-plac; ApR Vector for sRNA-induction [45]
pDH764 pBR-plac-sgrS; ApR SgrS-induction [46]
pDH895 pBR-plac-sgrS1; ApR SgrS1-induction [47]
pDH766 pBR-plac-rybB; ApR RybB-induction [48]
pDH768 pBR-plac-micC; ApR MicC-induction [48]
pDH772 pBR-plac-ryeB; ApR RyeB-induction [48]
pDH908 pDH795-derivative; Lpp-TLF Miller Assay This study
Phage
λNK1039 Encodes his operon Parent phage [49]
λDBH812 IS50-lacZtranslational fusion (TLF) from pDH812 marked with kanR Chromosomal TLF construction This study
λDBH849 IS50-lacZtranscriptional fusion (TCF) marked with kanR Chromosomal TCF construction This study
λDBH888 IS50-lacZtranscriptional fusion (TCF) marked with cmR Chromosomal TCF construction This study
expression plasmids and thesgrS1allele, respectively, and H Aiba for providing an anti-Crp antibody. Finally, we thank W Reznikoff for providing IS50transposase plasmids and T Naas for providing anE. colistrain harboring pOX38-Gen. This work was supported by a grant to DBH (MOP 11281) from Canadian Institutes of Health Research. JR and CM were supported by OGS and NSERC scholarships.
Received: 18 August 2014 Accepted: 11 November 2014
References
1. Roberts D, Hoopes BC, McClure WR, Kleckner N:IS10 transposition is regulated by DNA adenine methylation.Cell1985,43(1):117–130. 2. Yin JC, Krebs MP, Reznikoff WS:Effect of dam methylation on Tn5
transposition.J Mol Biol1988,199(1):35–45.
3. Raleigh EA, Kleckner N:Quantitation of insertion sequence IS10 transposase gene expression by a method generally applicable to any rarely expressed gene.Proc Natl Acad Sci U S A1986,83(6):1787–1791. 4. Krebs MP, Reznikoff WS:Transcriptional and translational initiation sites of
IS50. Control of transposase and inhibitor expression.J Mol Biol1986,
192(4):781–791.
5. Simons RW, Kleckner N:Translational control of IS10 transposition. Cell1983,34(2):683–691.
6. Ma C, Simons RW:The IS10 antisense RNA blocks ribosome binding at the transposase translation initiation site.EMBO J1990,9(4):1267–1274. 7. Ross JA, Wardle SJ, Haniford DB:Tn10/IS10 transposition is downregulated
at the level of transposase expression by the RNA-binding protein Hfq. Mol Microbiol2010,78(3):607–621.
8. Ross JA, Ellis MJ, Hossain S, Haniford DB:Hfq restructures RNA-IN and RNA-OUT and facilitates antisense pairing in the Tn10/IS10 system. RNA2013,19(5):670–684.
9. Vogel J, Luisi BF:Hfq and its constellation of RNA.Nat Rev Microbiol2011,
9(8):578–589.
10. Le Derout J, Boni IV, Regnier P, Hajnsdorf E:Hfq affects mRNA levels independently of degradation.BMC Mol Biol2010,11:17.
11. Mahillon J, Chandler M:Insertion sequences.Microbiol Mol Biol Rev1998,
62(3):725–774.
12. Kennedy AK, Guhathakurta A, Kleckner N, Haniford DB:Tn10 transposition via a DNA hairpin intermediate.Cell1998,95(1):125–134.
13. Bhasin A, Goryshin IY, Reznikoff WS:Hairpin formation in Tn5 transposition.J Biol Chem1999,274(52):37021–37029.
14. Mahnke Braam LA, Goryshin IY, Reznikoff WS:A mechanism for Tn5 inhibition. carboxyl-terminal dimerization.J Biol Chem1999,274(1):86–92. 15. Reznikoff WS:Transposon Tn5.Annu Rev Genet2008,42:269–286. 16. Kuan CT, Tessman I:LexA protein ofEscherichia colirepresses expression
of the Tn5 transposase gene.J Bacteriol1991,173(20):6406–6410. 17. Mikulecky PJ, Kaw MK, Brescia CC, Takach JC, Sledjeski DD, Feig AL:
Escherichia coliHfq has distinct interaction surfaces for DsrA, rpoS and poly(A) RNAs.Nat Struct Mol Biol2004,11(12):1206–1214.
18. Martinez-Antonio A, Collado-Vides J:Identifying global regulators in transcriptional regulatory networks in bacteria.Curr Opin Microbiol2003,
6(5):482–489.
19. Guisbert E, Rhodius VA, Ahuja N, Witkin E, Gross CA:Hfq modulates the sigmaE-mediated envelope stress response and the sigma32-mediated cytoplasmic stress response inEscherichia coli.J Bacteriol2007,
189(5):1963–1973.
20. Lathem WW, Schroeder JA, Bellows LE, Ritzert JT, Koo JT, Price PA, Caulfield AJ, Goldman WE:Posttranscriptional regulation of theYersinia pestis
cyclic AMP receptor protein Crp and impact on virulence.mBio2014,
5(1):e01038-01013.
21. Hussein R, Lim HN:Disruption of small RNA signaling caused by competition for Hfq.Proc Natl Acad Sci U S A2011,108(3):1110–1115. 22. Moon K, Gottesman S:Competition among Hfq-binding small RNAs in
Escherichia coli.Mol Microbiol2011,82(6):1545–1562.
23. Wassarman KM, Repoila F, Rosenow C, Storz G, Gottesman S:Identification of novel small RNAs using comparative genomics and microarrays. Genes Dev2001,15(13):1637–1651.
24. Ishikawa H, Otaka H, Maki K, Morita T, Aiba H:The functional Hfq-binding module of bacterial sRNAs consists of a double or single hairpin
preceded by a U-rich sequence and followed by a 3′poly(U) tail. RNA (New York, NY)2012,18(5):1062–1074.
25. Fender A, Elf J, Hampel K, Zimmermann B, Wagner EG:RNAs actively cycle on the Sm-like protein Hfq.Genes Dev2010,24(23):2621–2626. 26. Papenfort K, Vogel J:Small RNA functions in carbon metabolism and
virulence of enteric pathogens.Front Cell Infect Microbiol2014,4:91. 27. Agre P, Bonhivers M, Borgnia MJ:The aquaporins, blueprints for cellular
plumbing systems.J Biol Chem1998,273(24):14659–14662.
28. Rice JB, Vanderpool CK:The small RNA SgrS controls sugar-phosphate accumulation by regulating multiple PTS genes.Nucleic Acids Res2011,
39(9):3806–3819.
29. Hu ST, Wang HC, Lei GS, Wang SH:Negative regulation of IS2
transposition by the cyclic AMP (cAMP)-cAMP receptor protein complex. J Bacteriol1998,180(10):2682–2688.
30. Grainger DC, Hurd D, Harrison M, Holdstock J, Busby SJ:Studies of the distribution ofEscherichia colicAMP-receptor protein and RNA polymerase along the E. coli chromosome.Proc Natl Acad Sci U S A 2005,102(49):17693–17698.
31. Johansen J, Eriksen M, Kallipolitis B, Valentin-Hansen P:Down-regulation of outer membrane proteins by noncoding RNAs: unraveling the cAMP-CRP- and sigmaE-dependent CyaR-ompX regulatory case.J Mol Biol2008,
383(1):1–9.
32. Frohlich KS, Papenfort K, Berger AA, Vogel J:A conserved RpoS-dependent small RNA controls the synthesis of major porin OmpD.Nucleic Acids Res 2012,40(8):3623–3640.
33. Chen S, Zhang A, Blyn LB, Storz G:MicC, a second small-RNA regulator of Omp protein expression inEscherichia coli.J Bacteriol2004,186(20):6689–6697. 34. Twiss E, Coros AM, Tavakoli NP, Derbyshire KM:Transposition is modulated
by a diverse set of host factors inEscherichia coliand is stimulated by nutritional stress.Mol Microbiol2005,57(6):1593–1607.
35. Wang RF, Kushner SR:Construction of versatile low-copy number vectors for cloning, sequencing and gene expression inEscherichia coli. Gene1991,100:195–199.
36. Bolivar F, Backman K:Plasmids ofEscherichia colias cloning vectors. Methods Enzymol1979,68:245–267.
37. Cuzon G, Naas T, Nordmann P:Functional characterization of Tn4401, a Tn3-based transposon involved in blaKPC gene mobilization.Antimicrob Agents Chemother2011,55(11):5370–5373.
38. Hoffman EP, Wilhelm RC:Genetic mapping and dominance of the amber suppressor, Su1 (supD), inEscherichia coliK-12.J Bacteriol1970,103(1):32–36. 39. Casadaban MJ:Transposition and fusion of the lac genes to selected
promoters inEscherichia coliusing bacteriophage lambda and Mu.J Mol Biol1976,104(3):541–555.
40. Foster TJ, Davis MA, Roberts DE, Takeshita K, Kleckner N:Genetic organization of transposon Tn10.Cell1981,23(1):201–213. 41. Morita T, Kawamoto H, Mizota T, Inada T, Aiba H:Enolase in the RNA
degradosome plays a crucial role in the rapid decay of glucose transporter mRNA in the response to phosphosugar stress inEscherichia coli.Mol Microbiol2004,54(4):1063–1075.
42. Morita T, Maki K, Aiba H:RNase E-based ribonucleoprotein complexes: mechanical basis of mRNA destabilization mediated by bacterial non-coding RNAs.Genes Dev2005,19(18):2176–2186.
43. Whitfield CR, Wardle SJ, Haniford DB:The global bacterial regulator H-NS promotes transpososome formation and transposition in the Tn5 system. Nucleic Acids Res2009,37(2):309–321.
44. Way JC, Davis MA, Morisato D, Roberts DE, Kleckner N:New Tn10 derivatives for transposon mutagenesis and for construction of lacZ operon fusions by transposition.Gene1984,32(3):369–379.
45. Guillier M, Gottesman S:Remodelling of theEscherichia coliouter membrane by two small regulatory RNAs.Mol Microbiol2006,59(1):231–247.
46. Vanderpool CK, Gottesman S:Involvement of a novel transcriptional activator and small RNA in post-transcriptional regulation of the glucose phosphoenolpyruvate phosphotransferase system.Mol Microbiol2004,
54(4):1076–1089.
47. Wadler CS, Vanderpool CK:Characterization of homologs of the small RNA SgrS reveals diversity in function.Nucleic Acids Res2009,37(16):5477–5485. 48. Mandin P, Gottesman S:Integrating anaerobic/aerobic sensing and the
general stress response through the ArcZ small RNA.EMBO J2010,
29(18):3094–3107.
promote formation of an excised transposon fragment.Cell1989,
59(2):385–394.
50. Garrey SM, Mackie GA:Roles of the 5′-phosphate sensor domain in RNase E.Mol Microbiol2011,80(6):1613–1624.
51. Wilkinson KA, Merino EJ, Weeks KM:Selective 2′-hydroxyl acylation analyzed by primer extension (SHAPE): quantitative RNA structure analysis at single nucleotide resolution.Nat Protoc2006,1(3):1610–1616.
doi:10.1186/s13100-014-0027-z
Cite this article as:Rosset al.:Tn5transposition inEscherichia coliis repressed by Hfq and activated by over-expression of the small non-coding RNA SgrS.Mobile DNA20145:27.
Submit your next manuscript to BioMed Central and take full advantage of:
• Convenient online submission
• Thorough peer review
• No space constraints or color figure charges
• Immediate publication on acceptance
• Inclusion in PubMed, CAS, Scopus and Google Scholar
• Research which is freely available for redistribution
Submit your manuscript at www.biomedcentral.com/submit